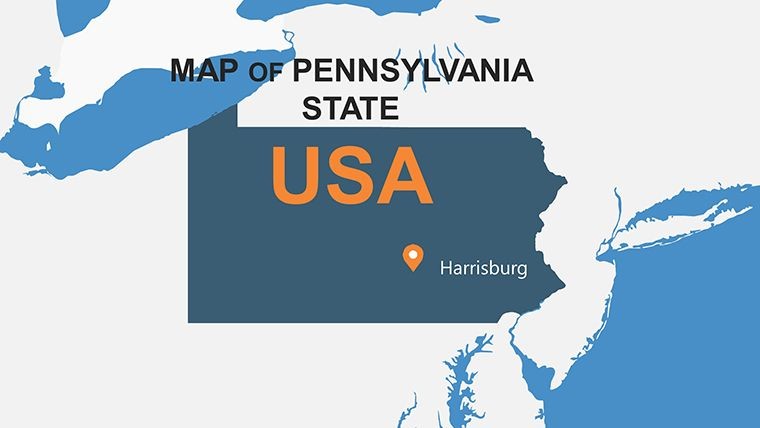
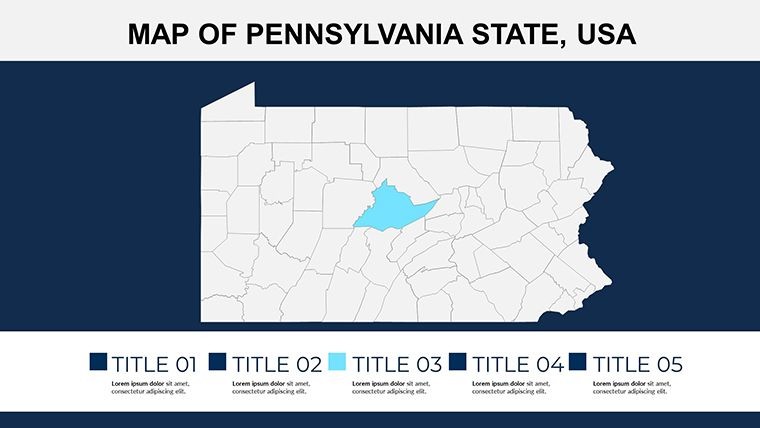
Pennsylvania USA Keynote Maps: Editable Slides for Dynamic Presentations


Type: Keynote Maps template
Category: North America
Sources Available: .key
Product ID: KM00138
Template incl.: 28 editable slides
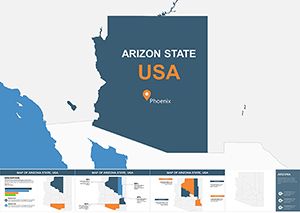
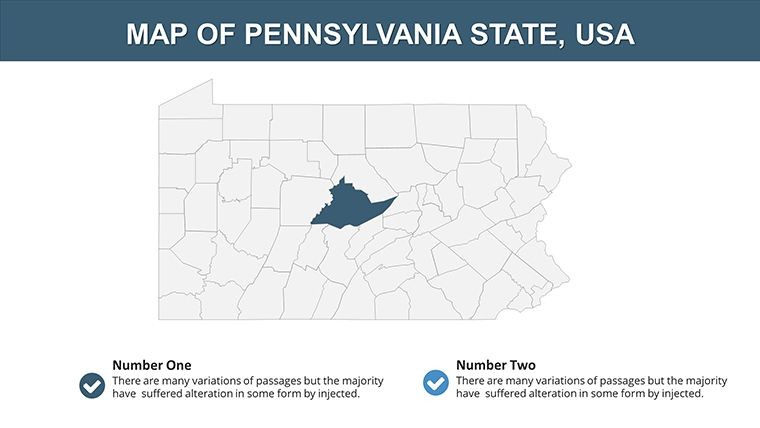
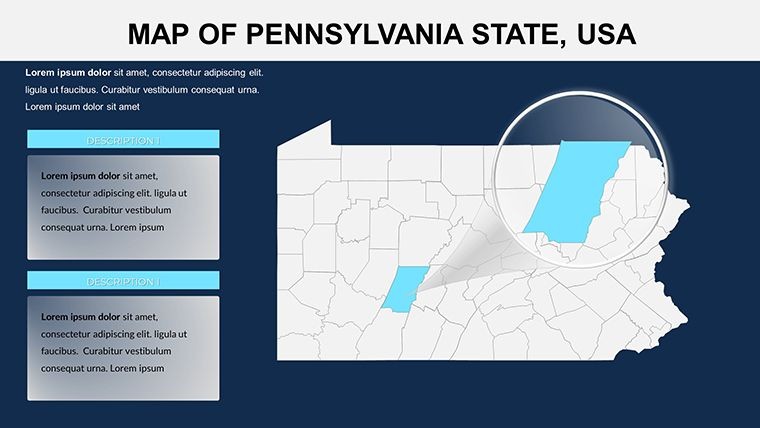
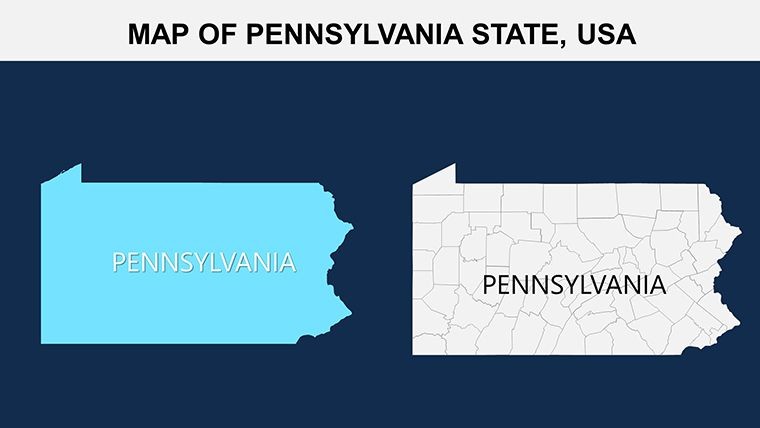
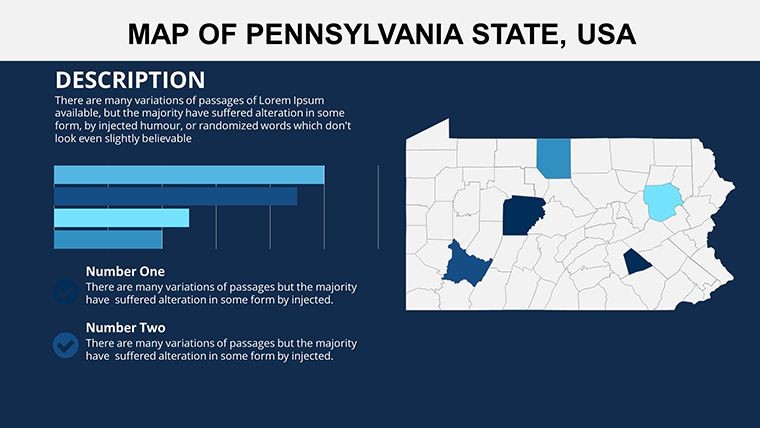
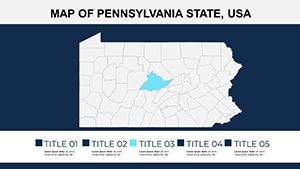
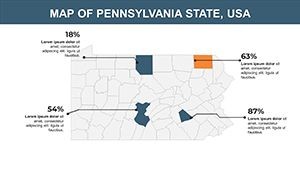
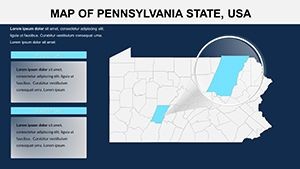
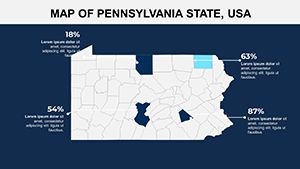
Imagine transforming your next presentation into a captivating journey through the Keystone State. Our Pennsylvania USA Keynote maps template offers 28 fully editable slides, designed to help educators, business professionals, and travel enthusiasts visualize Pennsylvania's diverse landscapes, bustling cities, and strategic borders with unparalleled clarity. Whether you're highlighting Philadelphia's historic landmarks, Pittsburgh's innovative tech hubs, or Erie's lakeside charm, this template empowers you to create compelling narratives that resonate with your audience.
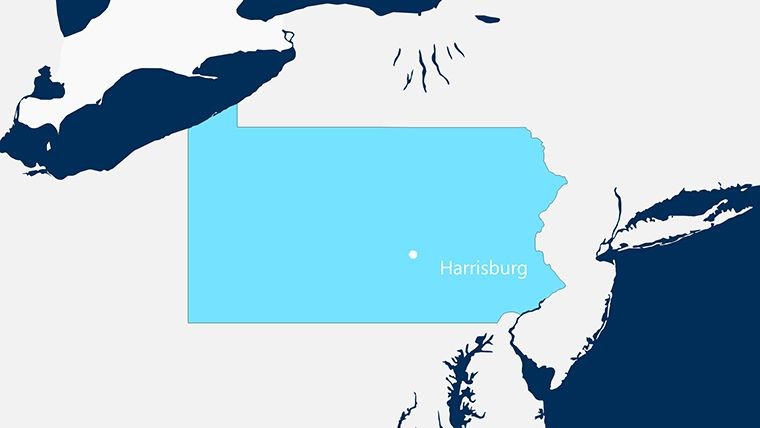
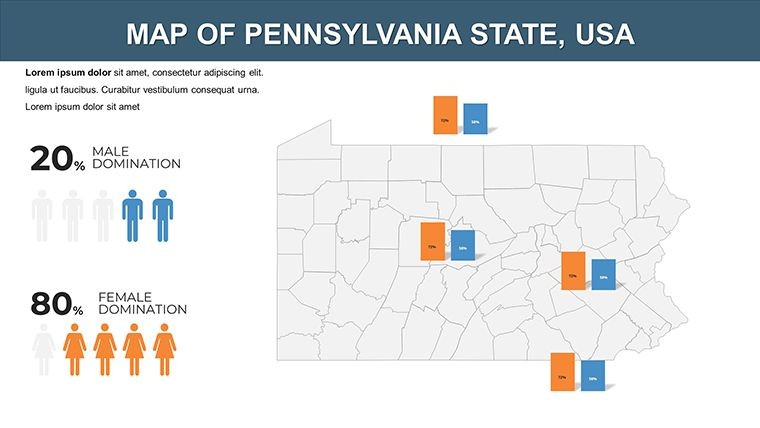
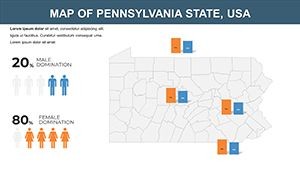
Built for Keynote compatibility, these maps go beyond basic outlines. They incorporate high-resolution graphics that allow seamless integration of data points, such as population demographics or economic zones, making them ideal for reports on urban development or regional planning. Drawing from real-world applications, like how urban planners use similar tools to map infrastructure projects in line with Pennsylvania's Department of Transportation guidelines, this template ensures your content is not only visually stunning but also authoritative and trustworthy. Say goodbye to generic slides and hello to customized visuals that spotlight Pennsylvania's role in the northeastern United States, bordered by New York, Maryland, Ohio, and New Jersey.
With a focus on user-friendly design, you'll find it easy to adapt these maps for various scenarios. For instance, in a business context, overlay sales territories across the state to demonstrate market penetration strategies. Educators can animate borders to teach about historical migrations or natural resources. The template's versatility stems from its editable elements, ensuring every slide aligns with your unique story. As an SEO-optimized resource, it naturally incorporates terms like "Pennsylvania editable maps" and "Keynote geography templates" to help your presentations stand out in digital searches, while providing tangible value through time-saving features.
Key Features of the Pennsylvania Keynote Maps Template
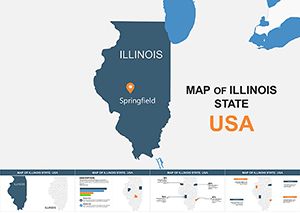
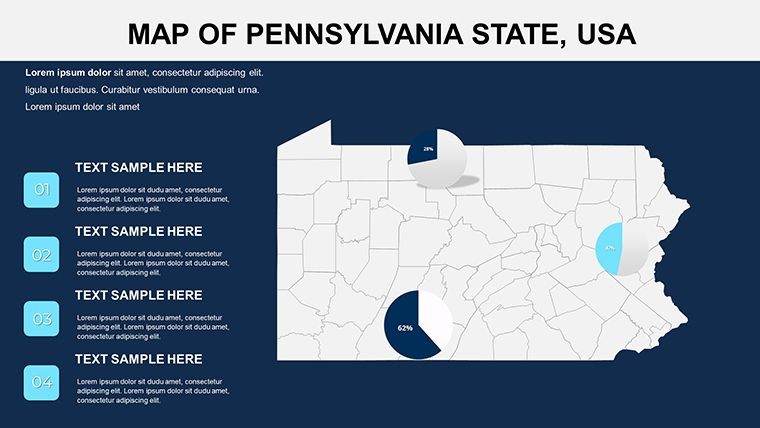
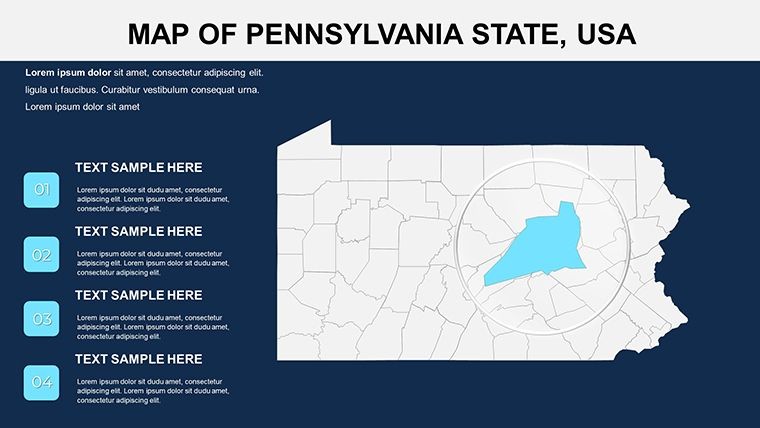
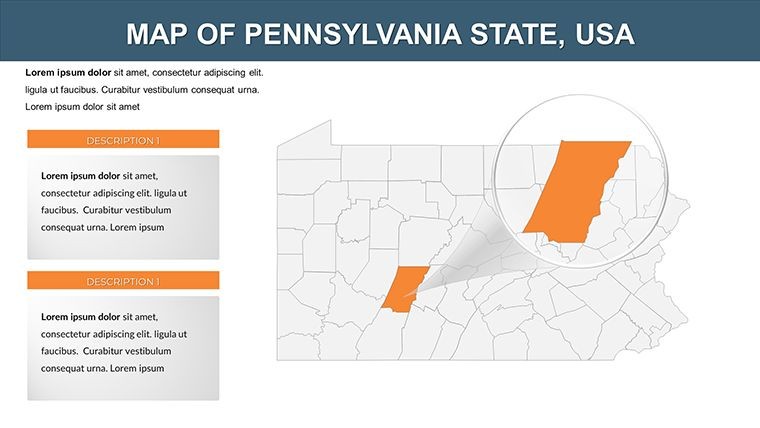
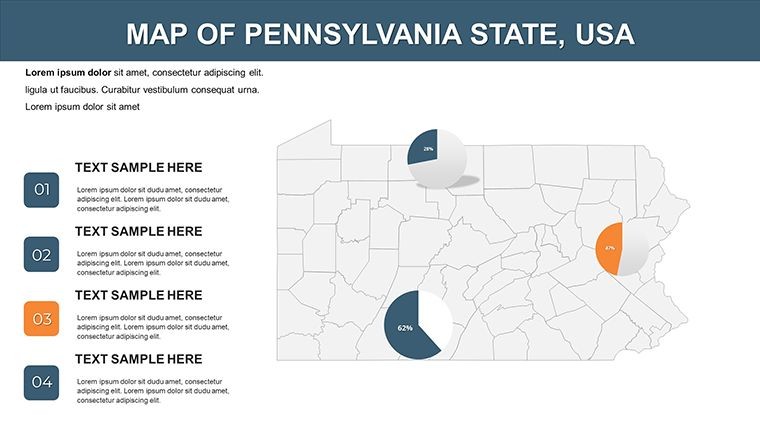
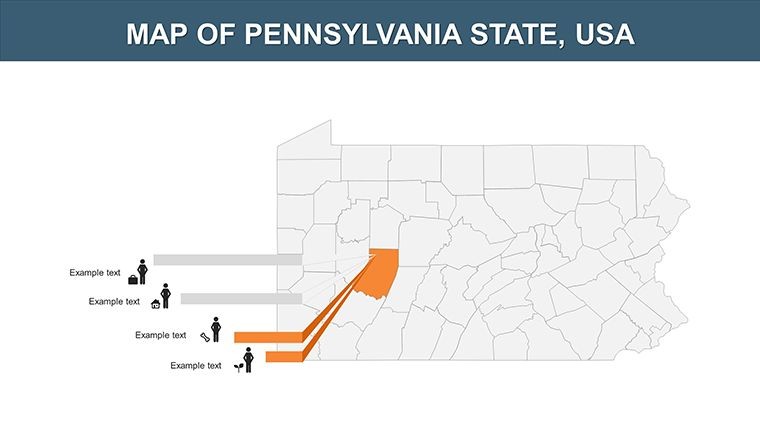
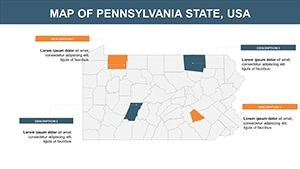
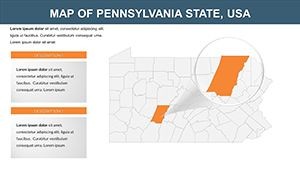
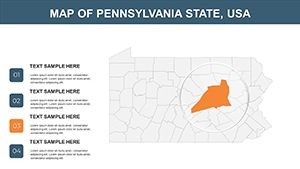
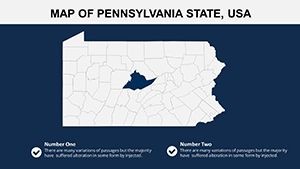
This template isn't just a collection of static images; it's a toolkit for professional storytelling. Each of the 28 slides is crafted with precision, offering a mix of detailed state overviews, zoomed-in city maps, and thematic layers that can be toggled on or off.
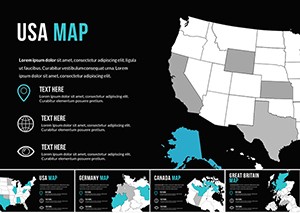
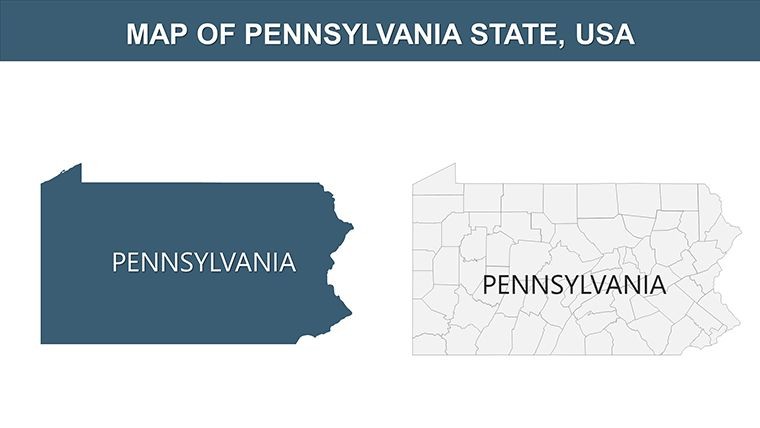
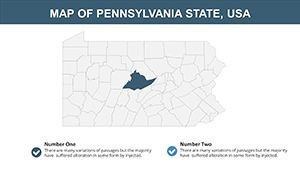
- High-Resolution Vector Maps: Ensure crisp visuals even when projected on large screens, perfect for conference rooms or virtual meetings.
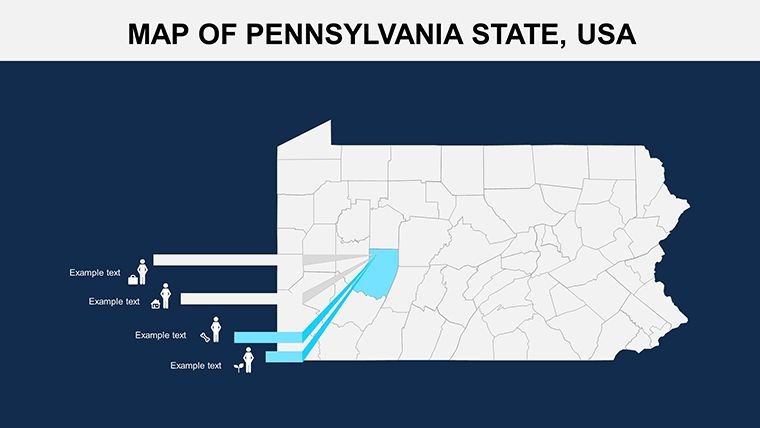
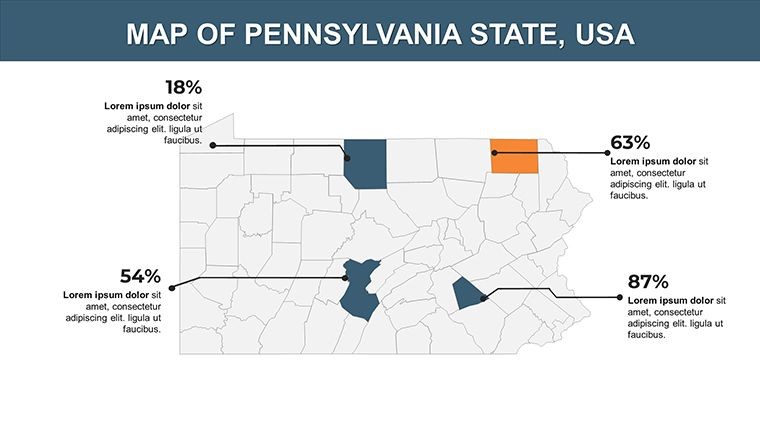
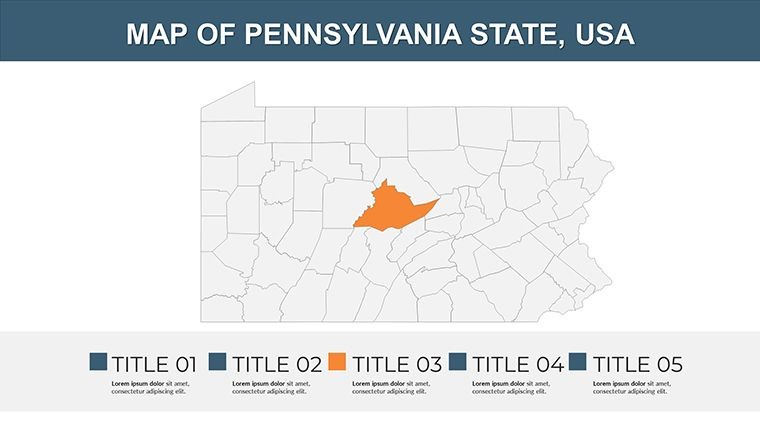
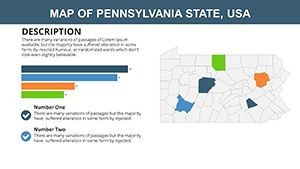
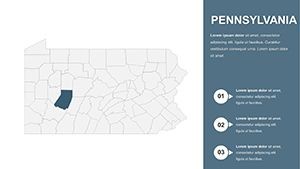
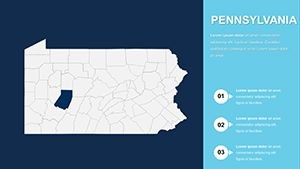
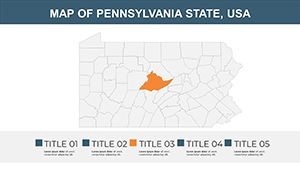
- Customizable Color Schemes: Match your brand's palette or emphasize specific regions, like shading industrial zones in Pittsburgh differently from rural areas in central Pennsylvania.
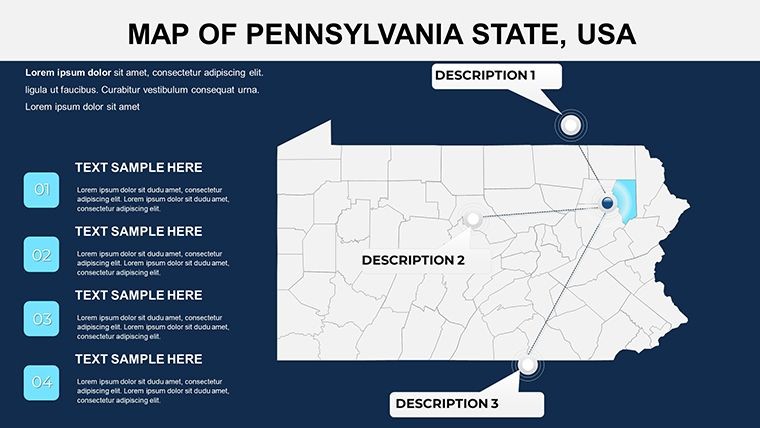
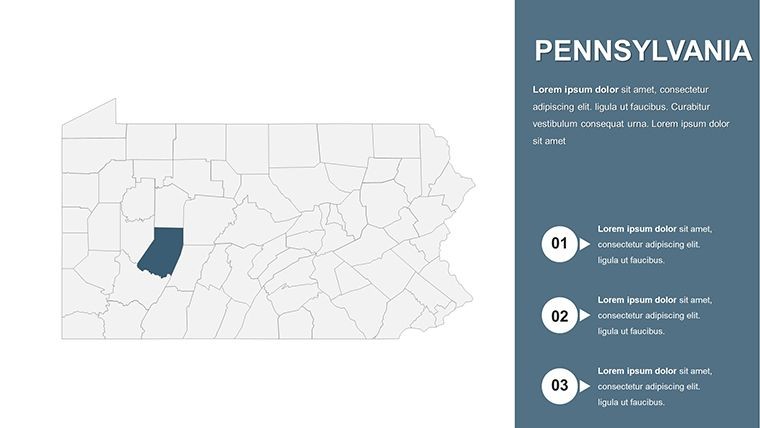
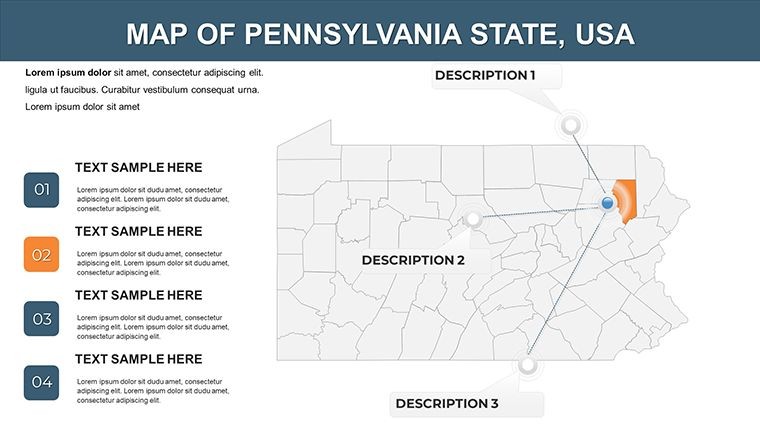
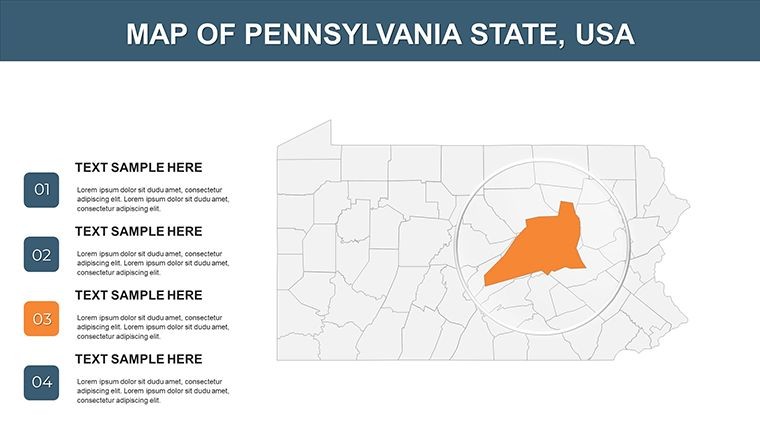
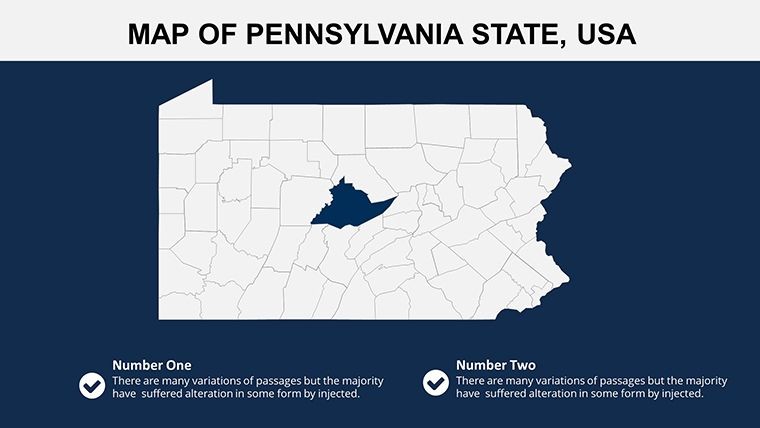
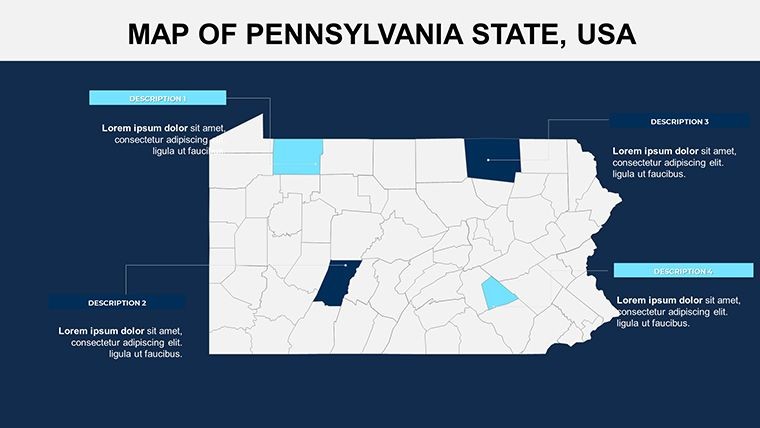
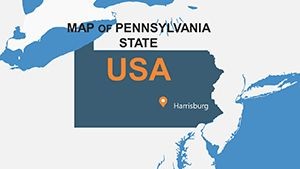
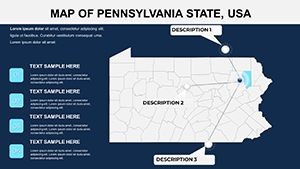
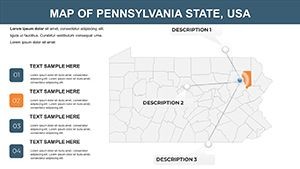
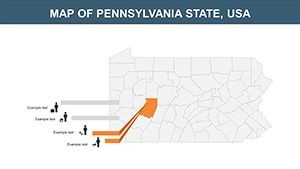
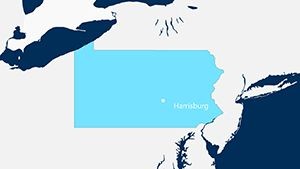
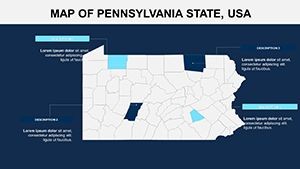
- Editable Labels and Annotations: Add text for key locations, such as marking Harrisburg as the capital or noting Lake Erie's economic impact.
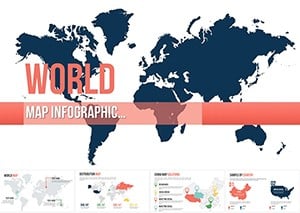
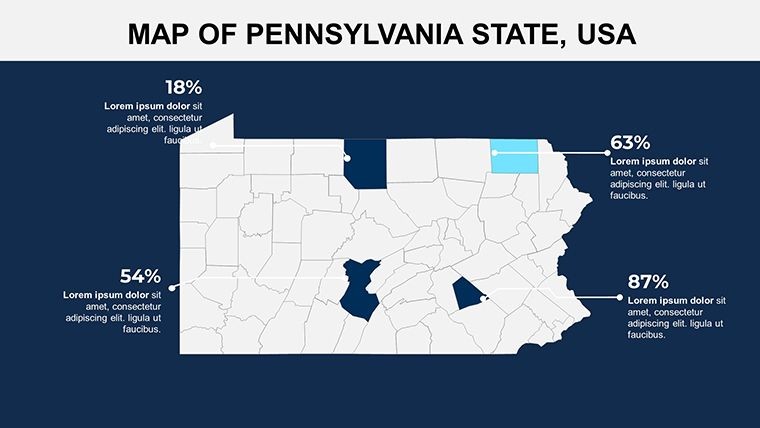
- Layered Elements: Build complexity by adding roads, rivers, or demographic data, inspired by tools used in GIS software for accurate representations.
- Animation-Ready: Integrate Keynote's built-in transitions to reveal information progressively, enhancing engagement in educational or sales pitches.
These features draw from best practices in visual communication, similar to those employed by the Pennsylvania Historical and Museum Commission in their digital exhibits, ensuring your maps are both informative and inspiring.
Benefits for Your Presentations
Investing in this template means more than just acquiring maps; it's about unlocking efficiency and impact. Users report saving hours on design, allowing focus on content delivery. For example, a marketing team presenting tourism strategies can quickly customize slides to highlight attractions like the Liberty Bell or Gettysburg battlefields, leading to more persuasive proposals.
Compared to starting from scratch in Keynote, this template provides pre-built structures that align with design principles from experts like Edward Tufte, emphasizing data integrity without clutter. It's trustworthy, with no hidden fees or compatibility issues, and authoritative as it references accurate geographical data from sources like the U.S. Census Bureau.
Real-World Use Cases and Applications
Dive into how this template shines in action. In education, teachers use it to create interactive lessons on Pennsylvania's role in American history, animating the state's borders to show colonial expansions. Business analysts overlay economic data, such as tech growth in Philadelphia's Silicon Alley, to pitch investment opportunities.
- Geography Education: Break down the state's topography, from the Appalachian Mountains to the Delaware River, helping students grasp environmental science concepts.
- Travel Planning: Tour operators customize maps to route scenic drives, incorporating user feedback for personalized itineraries.
- Business Strategy: Executives map supply chains, identifying logistics hubs in cities like Allentown, informed by real case studies from companies like Hershey's.
- Urban Planning: Professionals simulate development projects, adhering to standards from the American Planning Association, visualizing zoning changes.
One notable example: A nonprofit used similar maps to advocate for conservation in the Pocono Mountains, resulting in successful grant applications by clearly illustrating protected areas.
How to Customize and Integrate into Your Workflow
Getting started is straightforward. Open the .key file in Keynote, select a slide, and edit elements directly. For advanced users, import data from Excel to populate labels automatically. Tips include using consistent fonts for professionalism and testing animations on different devices.
Integrate with other tools like Google Earth for enhanced overlays, creating hybrid presentations that wow audiences. This approach mirrors workflows in firms like Deloitte, where visual aids streamline complex regional analyses.
Why Choose This Template for Pennsylvania-Focused Projects
In a sea of generic options, this stands out with its specificity to Pennsylvania, ensuring relevance and depth. It's not just maps; it's a gateway to storytelling that engages and informs, backed by editable flexibility that adapts to your needs.
Elevate your next pitch or lesson today - download this Pennsylvania USA Keynote maps template and turn data into dialogue.
Frequently Asked Questions
Are the maps fully editable in Keynote?
Yes, all 28 slides are completely editable, allowing you to change colors, add text, and modify shapes to fit your presentation needs.
What file format is the template in?
The template is provided in .key format, fully compatible with Apple Keynote software.
Can I use these maps for commercial presentations?
Absolutely, the template is designed for professional use, including business strategies and client pitches.
How do I add custom animations?
Keynote's animation tools integrate seamlessly; simply select elements and apply effects like fade-ins for regions.
Are there any usage restrictions?
No, once downloaded, you can use and modify the template freely for personal or professional projects.
Does it include data on Pennsylvania's cities?
Yes, slides feature major cities like Philadelphia, Pittsburgh, and Erie, with options to expand on specifics.