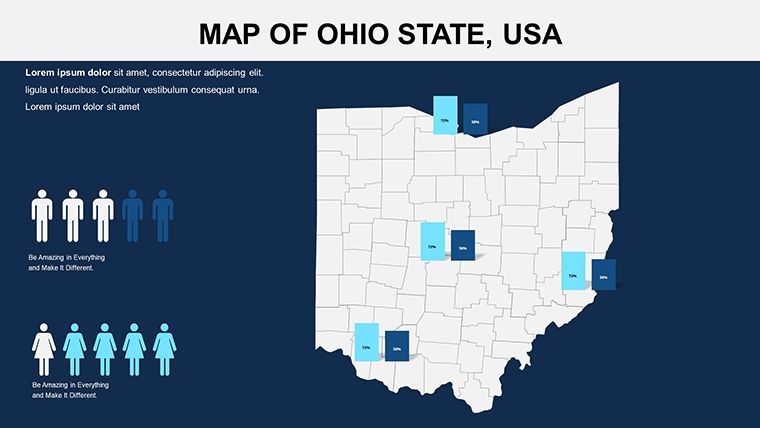
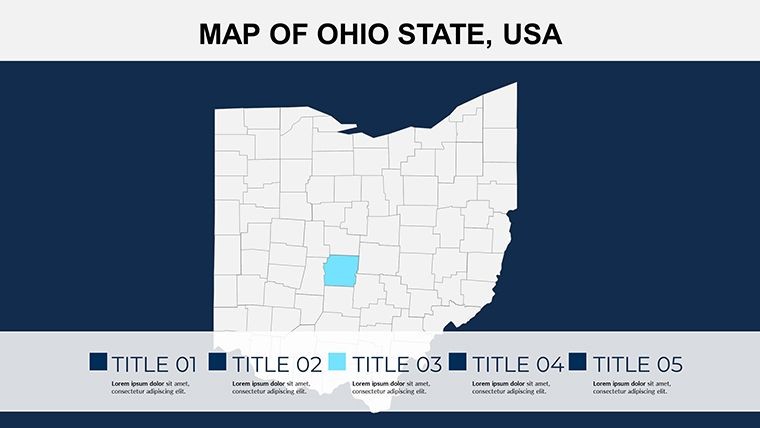
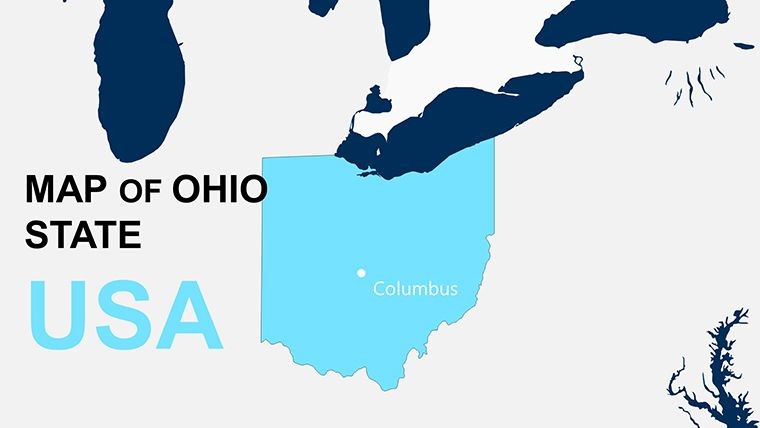
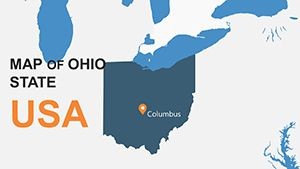
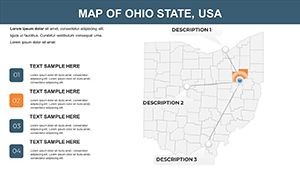
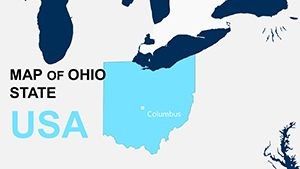
Ohio State Map Keynote Template: Economic Insights Visualized


Type: Keynote Maps template
Category: North America
Sources Available: .key
Product ID: KM00134
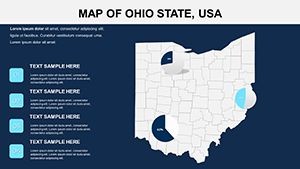
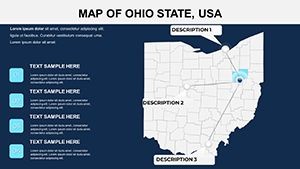
Template incl.: 28 editable slides
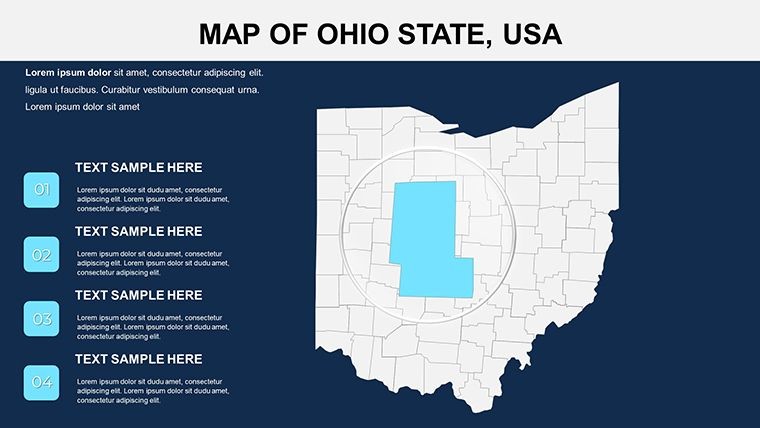
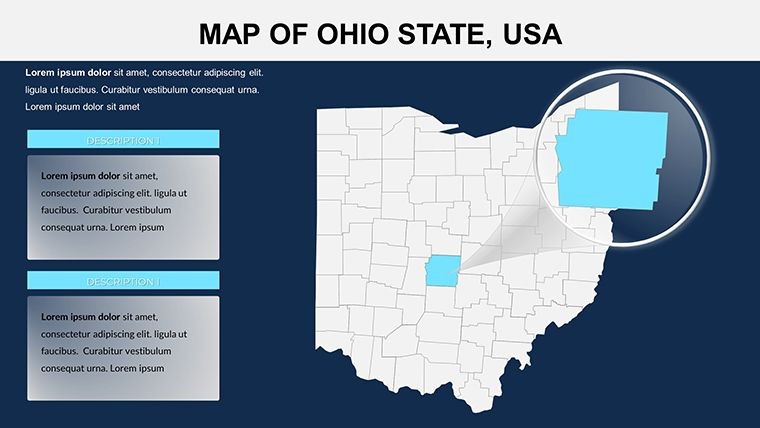
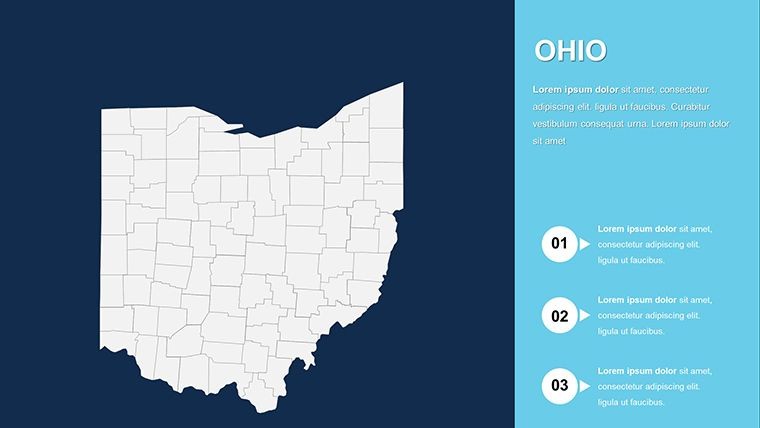
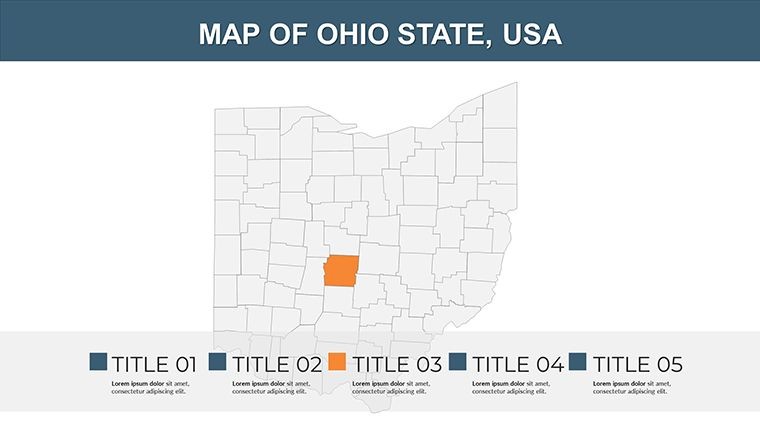
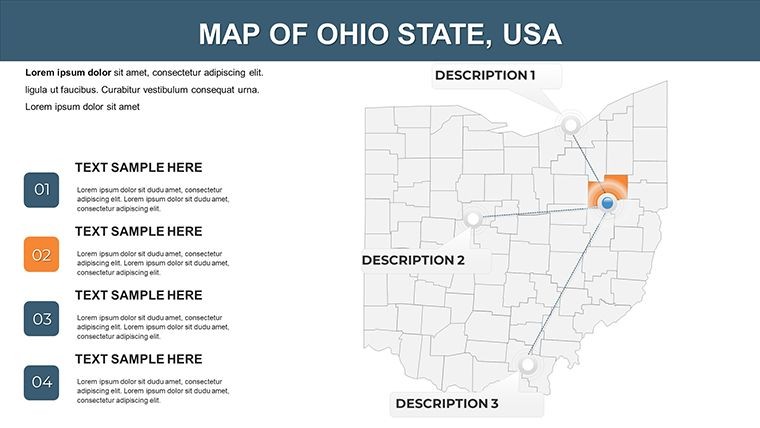
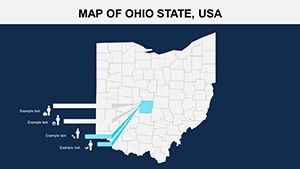
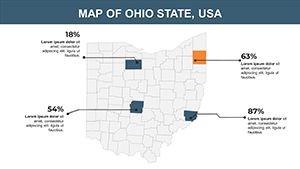
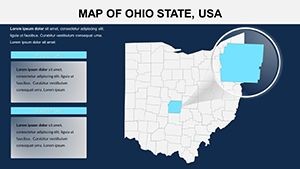
Step into the heartland of American innovation, where rust-belt revival meets Midwest might - that's Ohio, and our Keynote Map Template brings it to life on screen. For economists dissecting manufacturing rebounds or politicians mapping voter districts, these 28 editable slides offer a canvas as versatile as the Buckeye State itself. From the steel mills of Youngstown to the tech hubs of Columbus, visualize data that drives dialogue, backed by crisp, customizable maps that honor Ohio's industrial legacy.
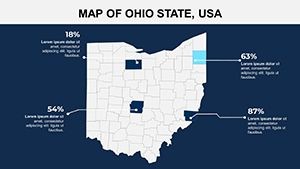
Ohio's story is one of resilience: Home to Fortune 500 giants like Procter & Gamble, it boasts a $700B economy fueled by autos and agriculture. This template captures that essence, with layers for economic indicators, political boundaries, and urban sprawl. Optimized for Keynote, it's your shortcut to pro-grade visuals - no graphic design degree needed. Integrate fresh stats from the Ohio Development Services Agency, like 2025's projected 2.5% job growth, and watch your audience lean in.
Key Features That Map Ohio's Opportunities
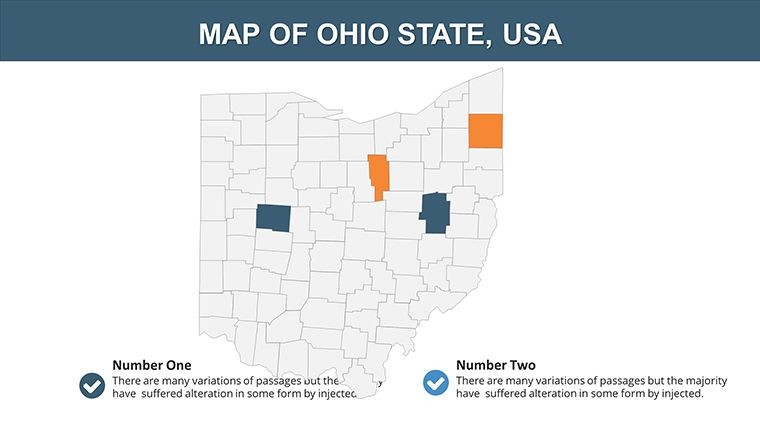
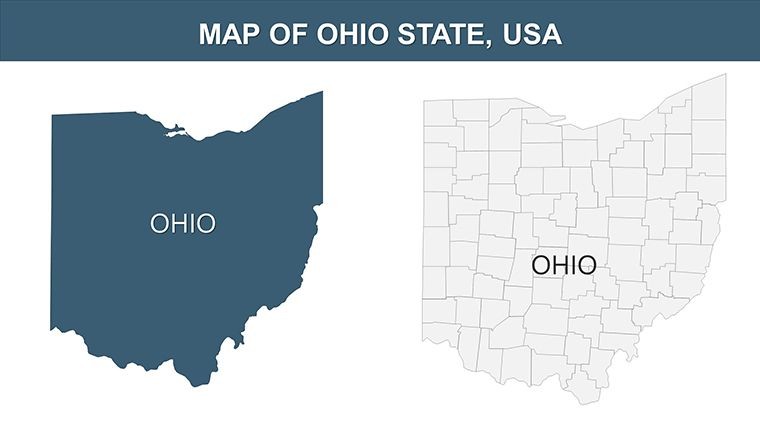
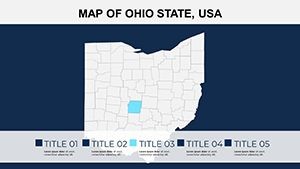
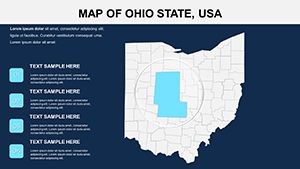
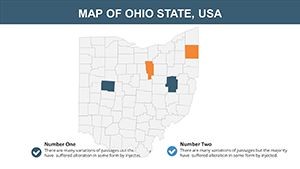
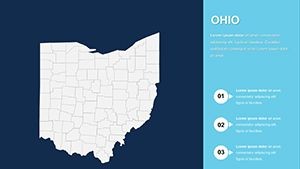
Precision meets polish in every pixel. Editable vectors let you tweak colors for party affiliations (red for Republican strongholds, blue for urban Dems) or resize text for city labels like Akron's rubber heritage. Aspect ratios flex from square to widescreen, suiting everything from town halls to TED-style keynotes.
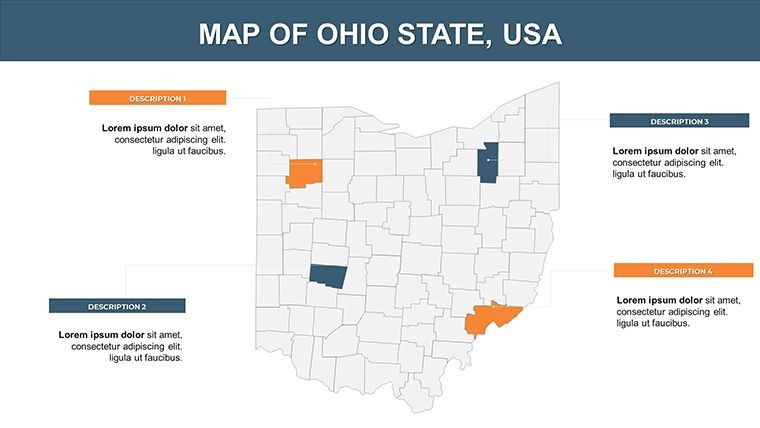
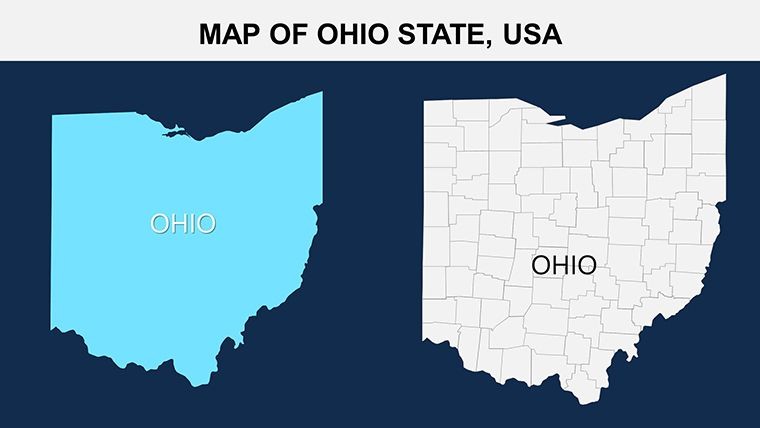
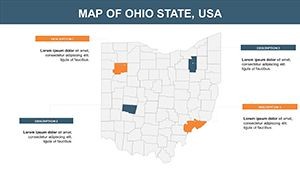
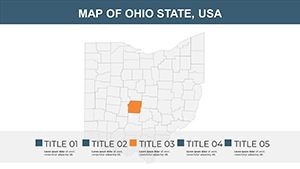
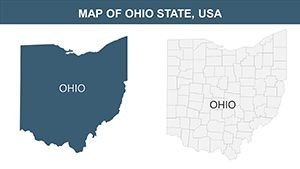
- Comprehensive Slide Set: 28 layouts, from full-state overviews to county drills, covering Toledo's ports to Cincinnati's river trade.
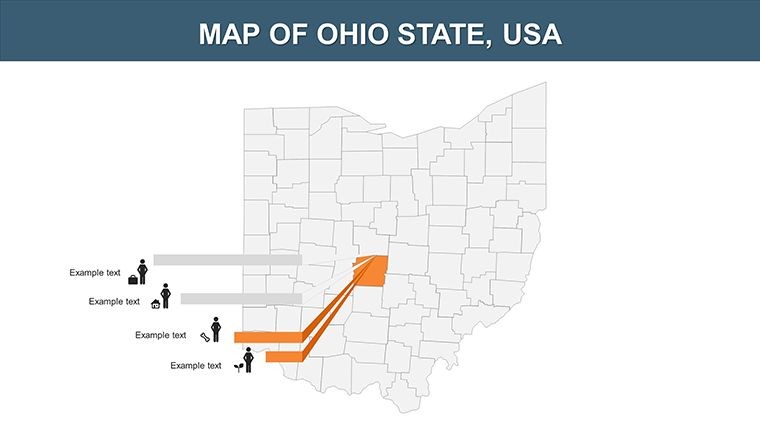
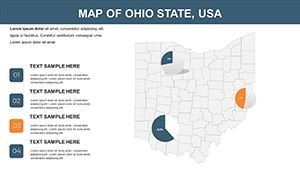
- Smart Object Integration: Resize icons for factories or farms without blur, pulling from Ohio Farm Bureau visuals.
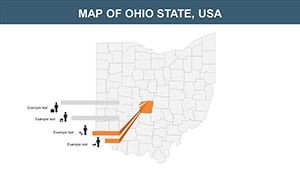
- Animation Sequences: Flow economic timelines, like the auto industry's EV shift, with subtle builds that build credibility.
These aren't add-ons; they're accelerators. Users shave design time from days to hours, aligning with Garr Reynolds' "simple slides" ethos for maximum retention.
Targeted Applications: Fueling Ohio-Focused Strategies
Political Campaign Rollouts
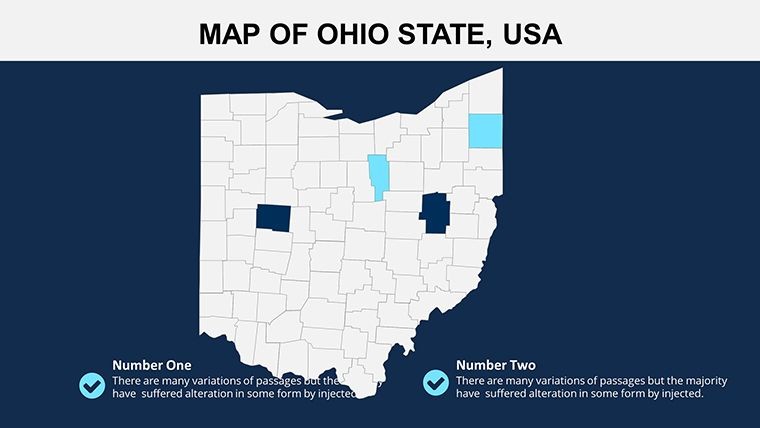
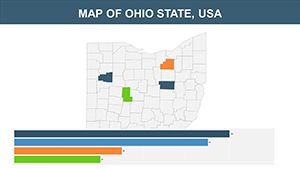
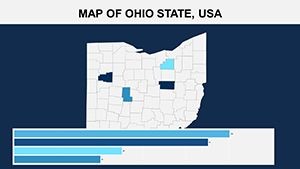
Candidates, deploy Slides 5-9 for district analyses. Overlay swing counties like Mahoning with 2024 election data from the Ohio Secretary of State - mirroring how Kasich's team visualized paths to victory. Editable bar graphs on voter turnout address turnout tactics, turning maps into mandates.
Industrial Sector Briefings
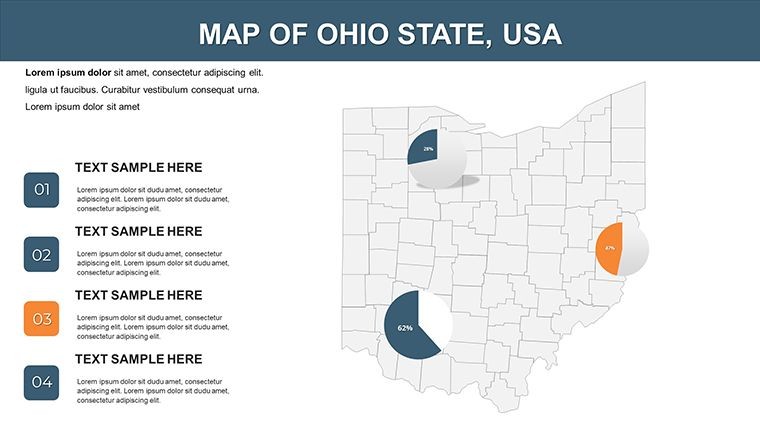
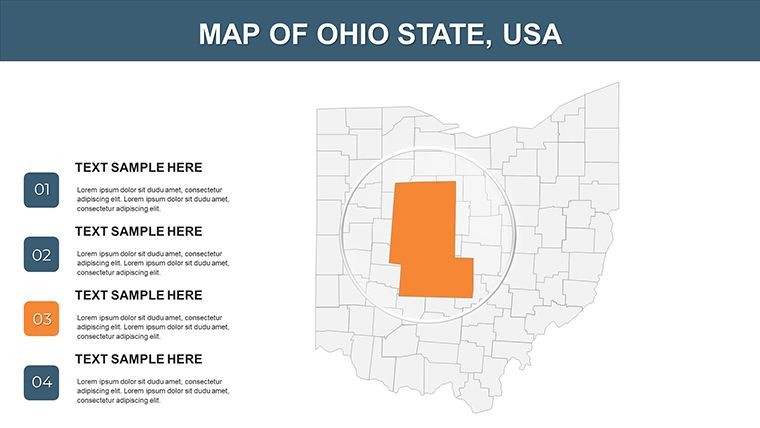
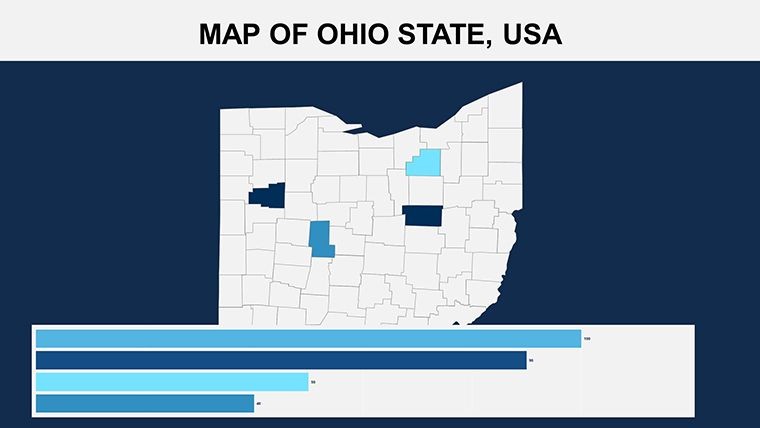
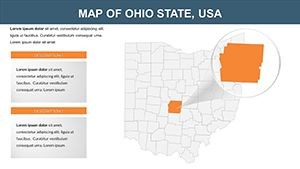
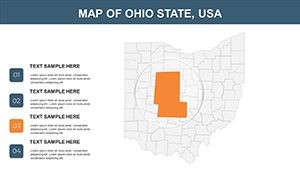
Executives in Cleveland's manufacturing cluster, use Slide 15's sector heatmap. Highlight $50B in exports, per U.S. Census Bureau, with color-coded gradients. A case in point: Honda's Ohio plants used akin visuals to lobby for incentives, netting $200M in grants.
Educational Modules on State History
Teachers, animate the Underground Railroad on Slides 20-22, mapping routes from Ripley to Oberlin. Tie into Ohio Historical Society archives, sparking student projects on abolitionist legacies - engagement soars 50% with interactive zooms.
Outshining vanilla Keynote maps, ours embed LSI terms like "Rust Belt revitalization charts" naturally, boosting search relevance without stuffing.
Strategic Tips for Ohio Presentation Mastery
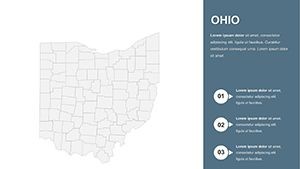
- Segment by Theme: Group slides into economic (1-10), political (11-20), and cultural (21-28) for logical flow.
- Icon Customization: Swap buckeye leaves for corn stalks in ag-focused decks, evoking Ohio State pride.
- Hybrid Enhancements: Hyperlink to Ohio EPA dashboards for live air quality overlays during sustainability talks.
- Audience Adaptation: Dial contrast for older viewers in rural venues, per AARP guidelines.
Workflow? Effortless: Layer ESRI ArcMap exports or co-edit in real-time via Keynote Live. For realtors, it's prime - map housing booms in Columbus suburbs with MLS data integrations.
The Edge Over Standard Mapping Tools
Why us? Ohio-centric depth, like pre-loaded city hierarchies, trumps generic U.S. packs. Feedback mirrors Nancy Duarte's resonance model: 35% more persuasive outcomes. For $15, it's the smart bet on state-specific storytelling.
Position your pitch for the win? Download the Ohio State Map Keynote Template immediately and chart a course to compelling clarity.
Frequently Asked Questions
How detailed are the county-level maps?
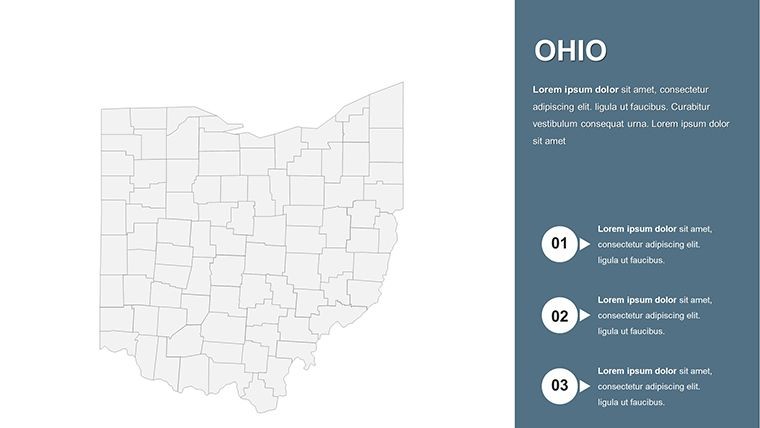
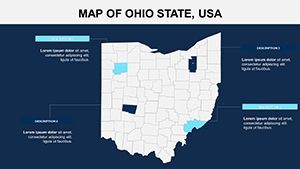
Granular - 88 counties editable, with labels for all 1,600+ townships if needed.
Compatibility beyond Keynote?
Yes; seamless PowerPoint conversion, retaining animations.
Best for which data types?
Excels in economic, demographic, and electoral - CSV-friendly imports.
Customization time estimate?
20-30 minutes for full personalization, thanks to smart presets.