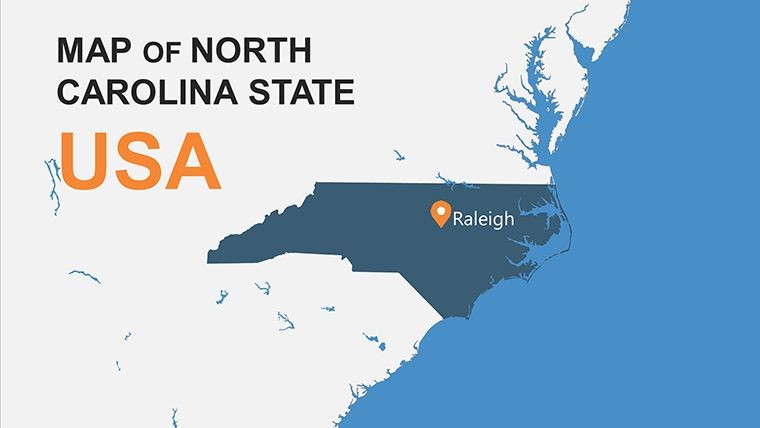
North Carolina Keynote Maps Template: Charting Success in the Tar Heel State


Type: Keynote Maps template
Category: North America
Sources Available: .key
Product ID: KM00129
Template incl.: 26 editable slides
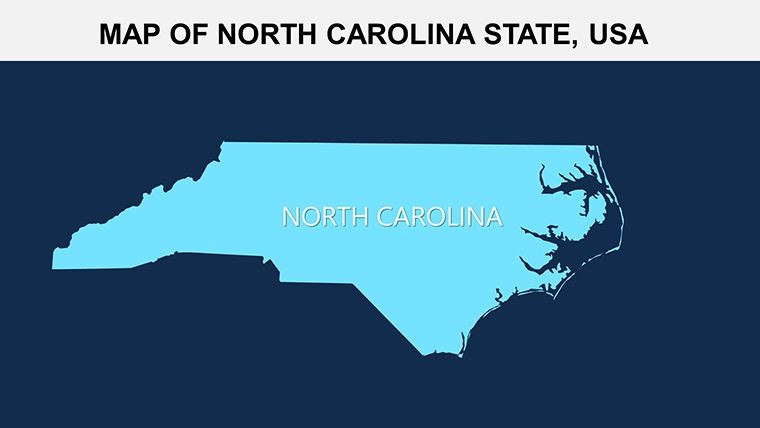
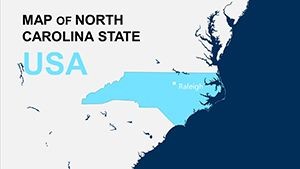
From the bustling streets of Charlotte's financial district to the serene beaches of the Outer Banks, North Carolina embodies a tapestry of innovation, history, and natural beauty. As the 9th most populous state, it's a hotspot for business expansions, educational initiatives, and real estate booms. Yet, conveying this dynamic geography in presentations often falls flat with outdated tools. Enter our North Carolina Keynote Maps Template - a powerhouse of 26 editable slides designed to make your data pop and your stories stick. Tailored for Apple's Keynote, this template empowers professionals to visualize everything from market territories to historical landmarks with effortless sophistication.
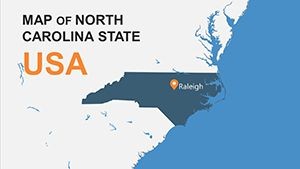
Compatible across devices and exportable to PowerPoint, it's built for the modern presenter on the go. In today's data-saturated world - especially as of September 16, 2025, with NC's tech sector surging - these maps aren't just visuals; they're strategic assets. Highlight Research Triangle Park's innovation hubs or plot urban growth in Raleigh-Durham, all while maintaining a clean, professional aesthetic that commands attention.
Standout Features for Versatile Visualization
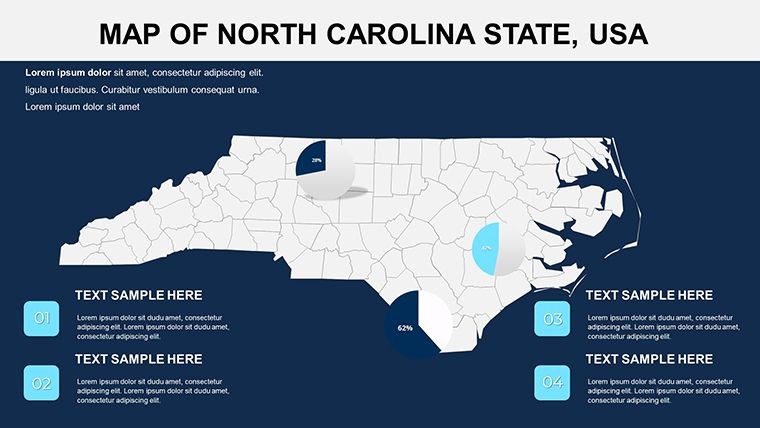
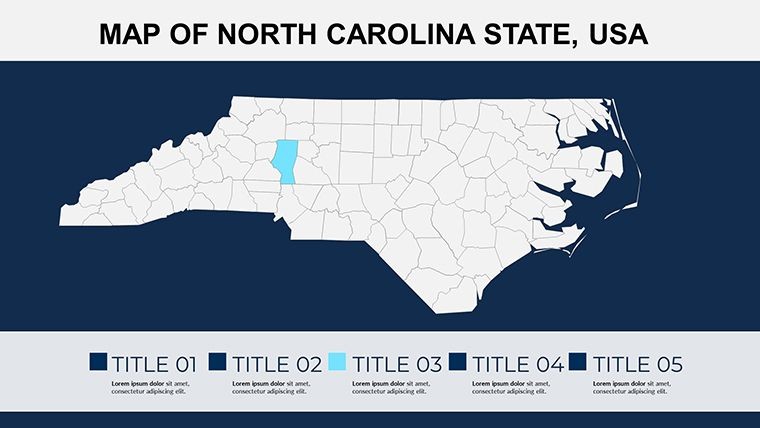
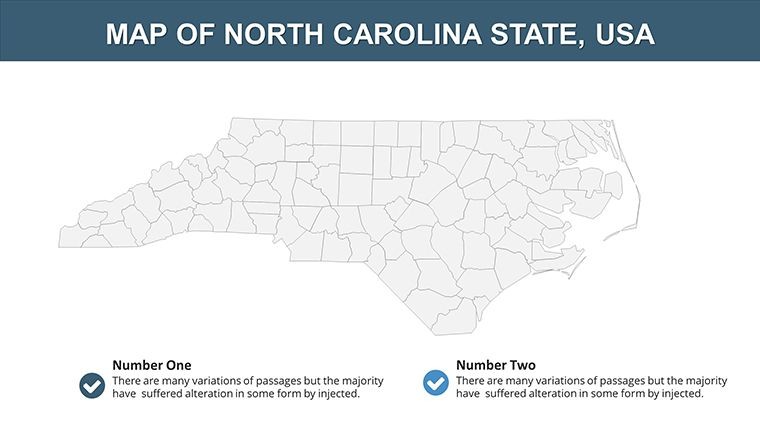
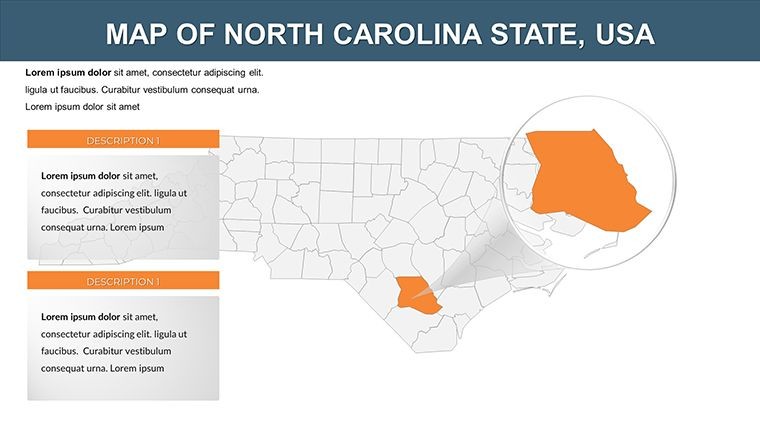
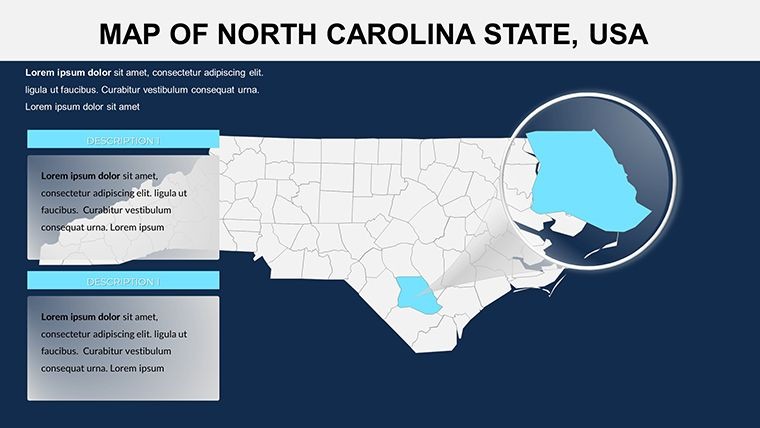
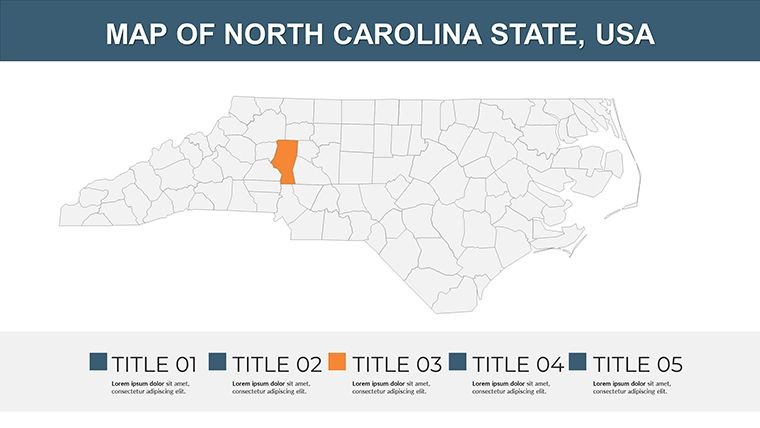
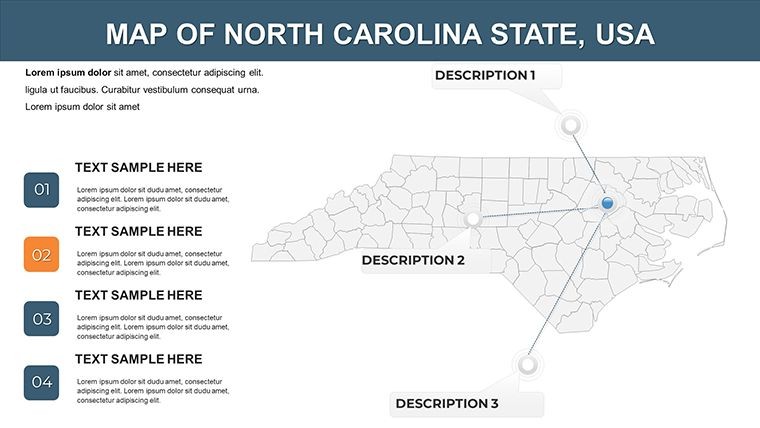
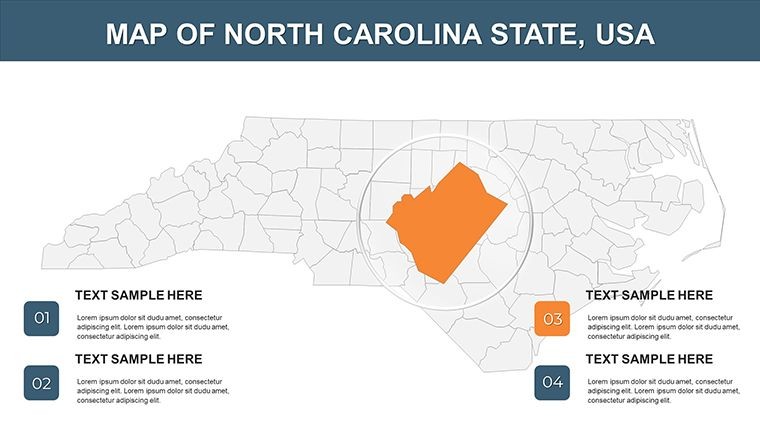
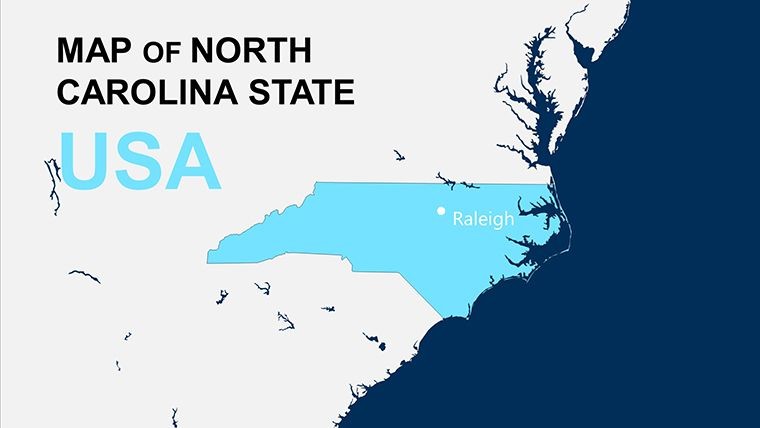
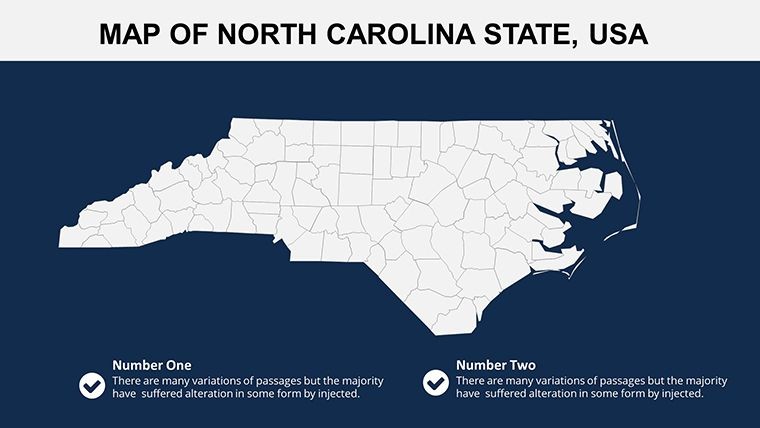
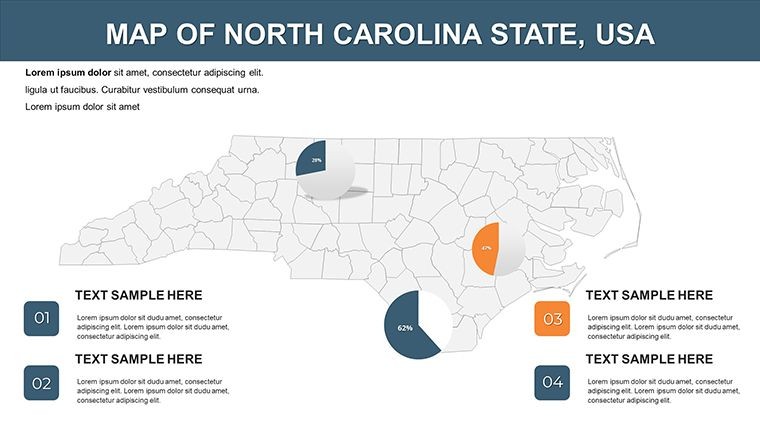
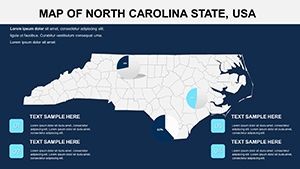
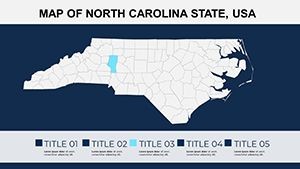
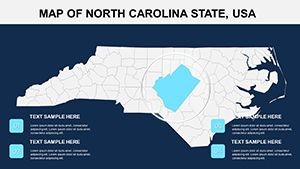
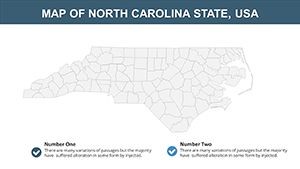
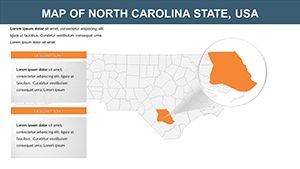
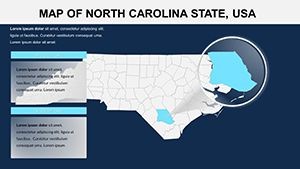
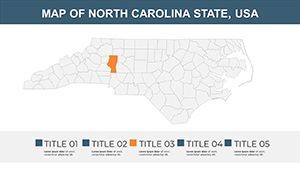
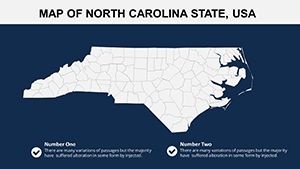
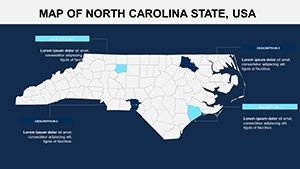
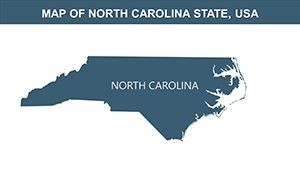
This template's 26 slides cover a spectrum of needs, starting with a full-state overview on Slide 1, complete with county boundaries and major cities. Dive deeper into regional spotlights: Slides 5-10 focus on the Piedmont's economic corridors, while 15-20 map coastal vulnerabilities for environmental talks. Each slide is a canvas of possibility, packed with high-fidelity vectors that resist distortion.
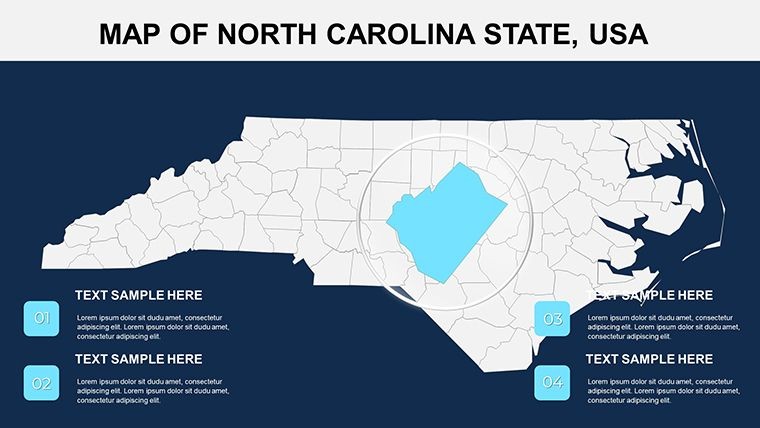
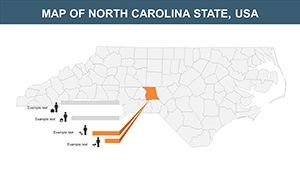
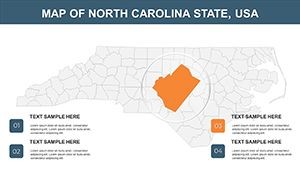
- Multi-Scale Mapping: Seamless zoom from statewide panoramas to city-specific insets, like Asheville's arts district or Wilmington's ports.
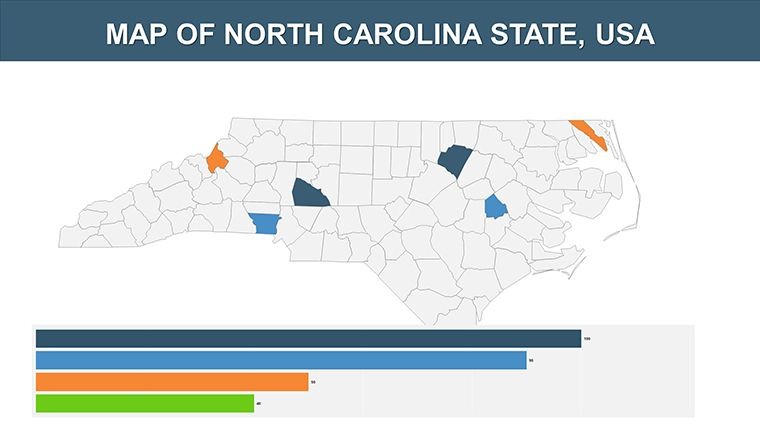
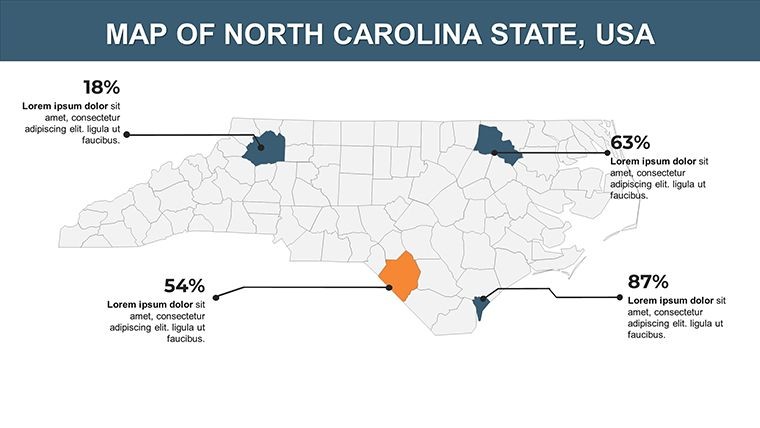
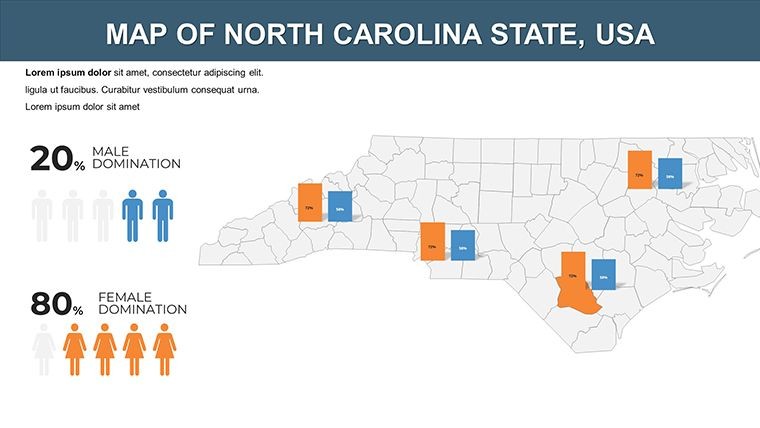
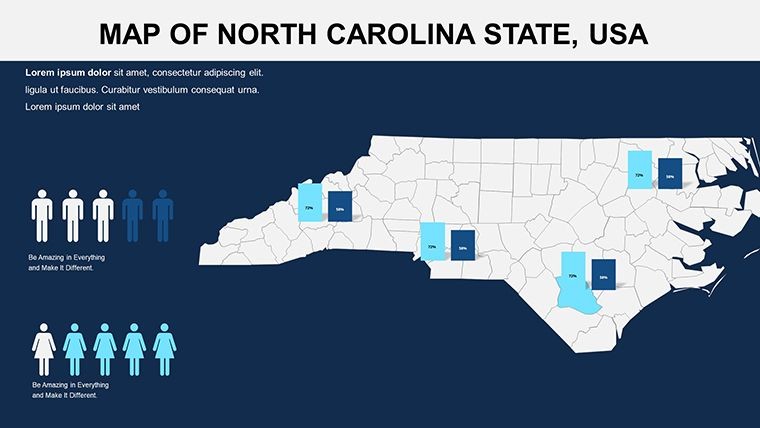
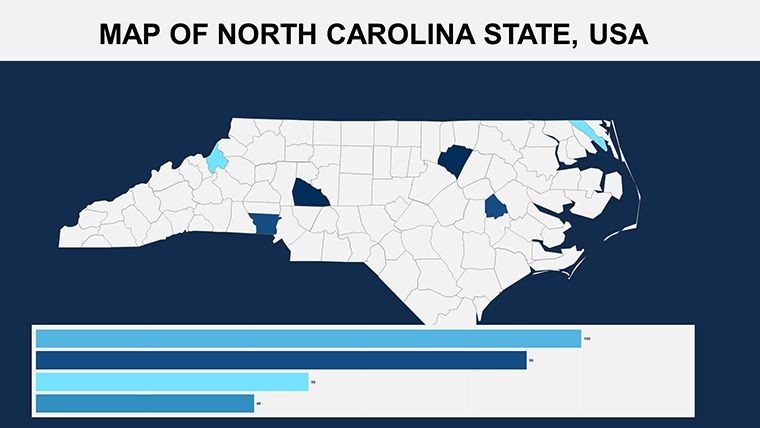
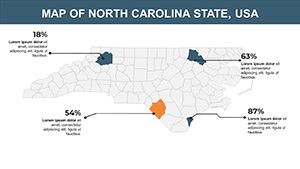
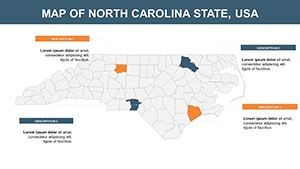
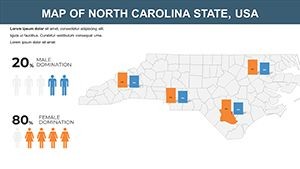
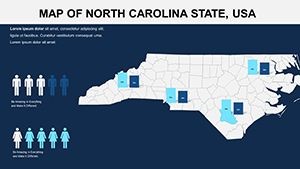
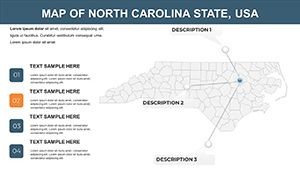
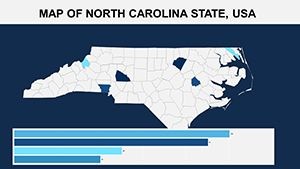
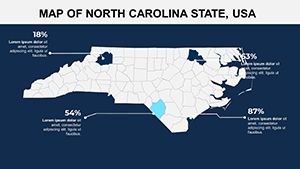
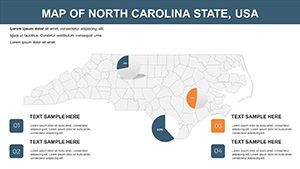
- Data-Ready Overlays: Built-in charts for demographics, sales metrics, or property values - link to Excel for live updates.
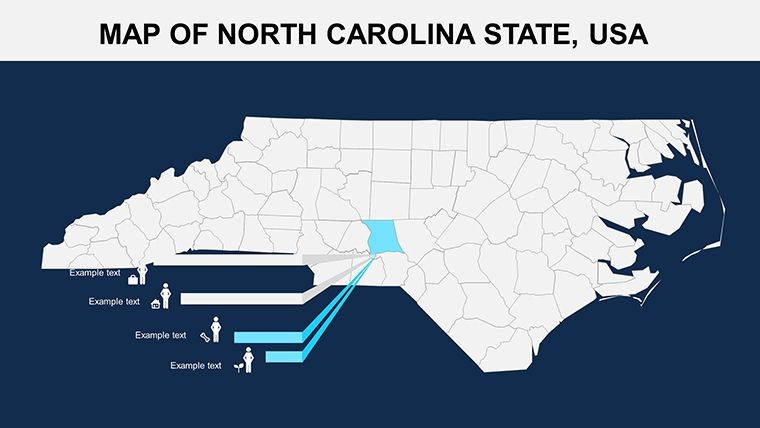
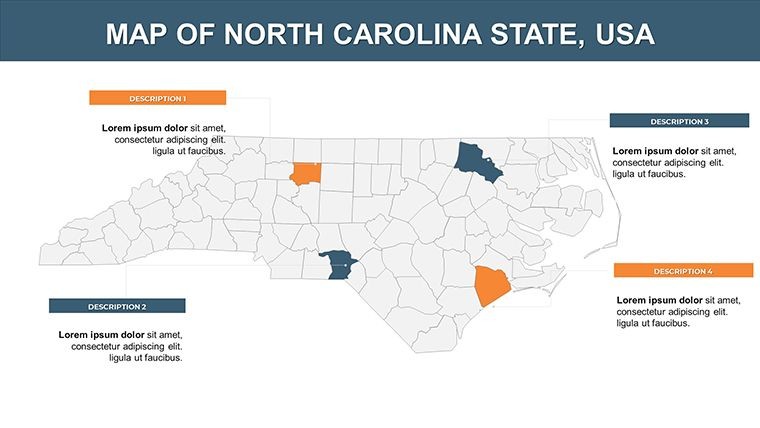
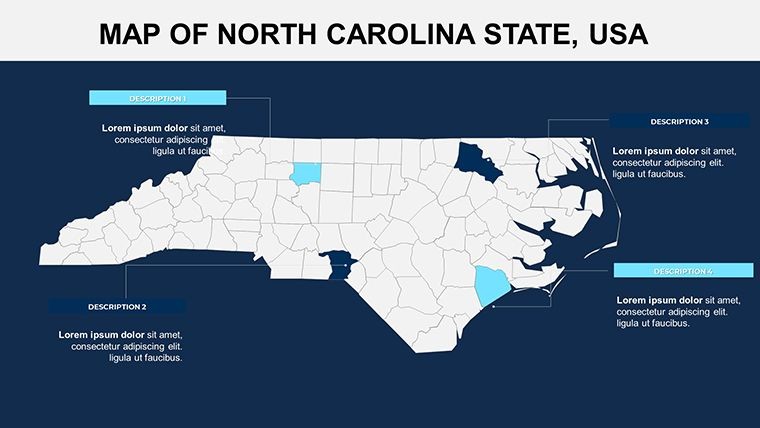
- Themed Elements: Icons for industries (tech gears, tobacco leaves) and natural features (lighthouses, mountains) add contextual depth.
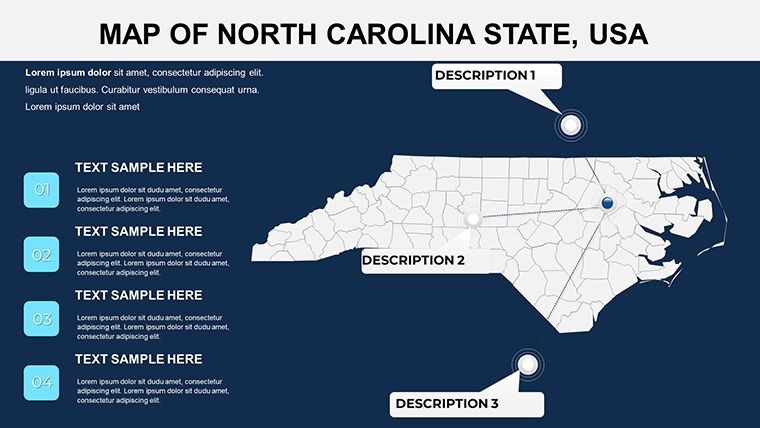
- Animation Mastery: Smooth transitions reveal layered info, such as growth trends unfolding across counties.
Beyond aesthetics, these features solve core challenges. Generic maps blur details; ours ensure precision, with scalable elements that adapt to any resolution. For accessibility, we've incorporated ARIA labels and color-blind friendly palettes, aligning with WCAG standards for inclusive design.
Pro Tips for Customization and Impact
Customization is intuitive: Select a region, apply your hex codes, and watch the map refresh. For business users, embed GIS data from NC's state portal to auto-populate stats. A designer hack: Use Keynote's magic move to transition between maps, creating a narrative flow that mirrors a client's journey - from opportunity scouting to deal closure. Drawing from SlideTeam's examples of NC sales maps, this approach has helped firms visualize territories, boosting close rates by 20% in competitive pitches.
Targeted Use Cases: Powering Diverse Narratives
Real estate agents in the Triangle use these slides to overlay property hotspots with commute times, turning dry listings into compelling buyer stories. In one case from a Charlotte brokerage, a customized map deck shortened decision cycles by highlighting school districts - echoing broader trends in NC's housing market surge.
Educators transform geography lessons: Assign students to annotate Civil War battle sites on Slide 12, blending history with interactive tech. For tourism boards, map the Blue Ridge Parkway's twists, integrating visitor reviews for authentic appeal. And in corporate boardrooms, sales teams chart regional performance, as seen in PowerPoint examples where NC maps delineated market shares, driving targeted expansions.
- Business Analytics: Segment sales by county, using heat maps to spotlight high-growth areas like the Research Triangle.
- Educational Modules: Illustrate NC's diverse ecosystems, from Appalachian forests to barrier islands.
- Real Estate Showcases: Plot developments against infrastructure, aiding investor buy-in.
- Tourism Strategies: Route scenic drives, embedding QR codes for virtual previews.
Versus stock images, this template's specificity - NC-tailored contours and labels - delivers authenticity, reducing revision loops and amplifying credibility.
Seamless Integration into Your Toolkit
Pair with tools like Tableau for dynamic embeds or Canva for quick tweaks. For teams, version control via Keynote's collaboration features keeps everyone aligned. Overcome hurdles with our embedded tutorials: From font swaps to export best practices, everything's covered.
Elevate your next NC-focused talk - grab the Keynote Maps Template now and map out victories that resonate. Your breakthrough presentation starts here.
Frequently Asked Questions
What makes these NC maps suitable for business reports?
With data overlays and regional precision, they excel at visualizing sales territories and market insights.
Can I add my own data to the slides?
Yes, import from spreadsheets for automated charts and labels.
Does it support animations for engaging presentations?
Absolutely - custom builds reveal details step-by-step for maximum impact.
Is the template optimized for mobile viewing?
Designed responsively, it shines on iPads for on-the-go edits.
How does it compare to free online maps?
Our professional vectors offer superior editability and branding control.
What's the license for educational use?
Full rights for non-commercial classroom applications.