New Hampshire Keynote Map Template - Instant Download | ImagineLayout


Type: Keynote Maps template
Category: North America
Sources Available: .key
Product ID: KM00124
Template incl.: 26 editable slides
What is a Keynote map template? A Keynote map template is a pre-built .key file containing editable geographic slides - state outlines, county boundaries, and region-specific data layers - that open directly in Apple Keynote for immediate use in business, academic, or government presentations.
26 Slides, 4 Color Variants: What You Get
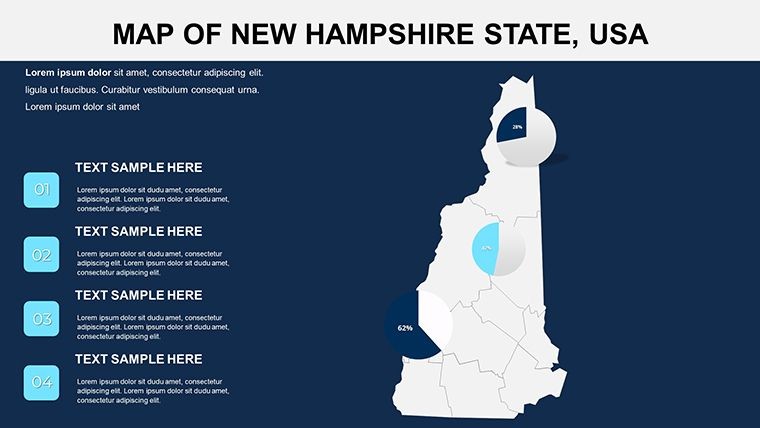
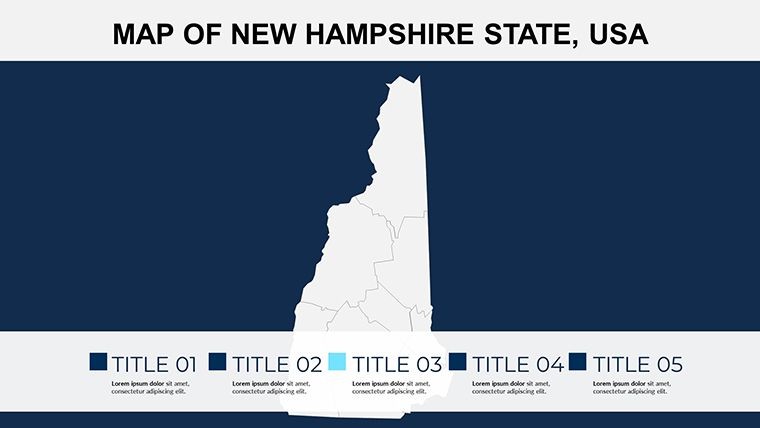
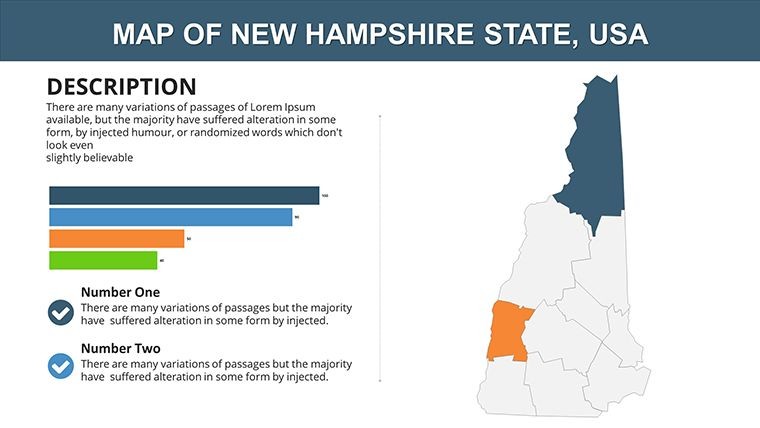
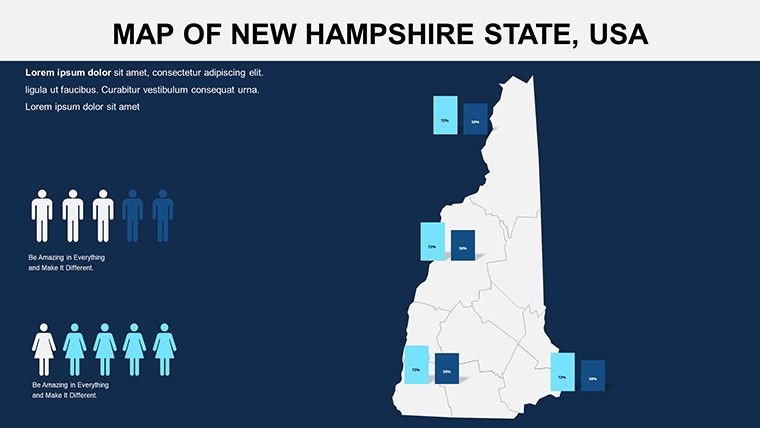
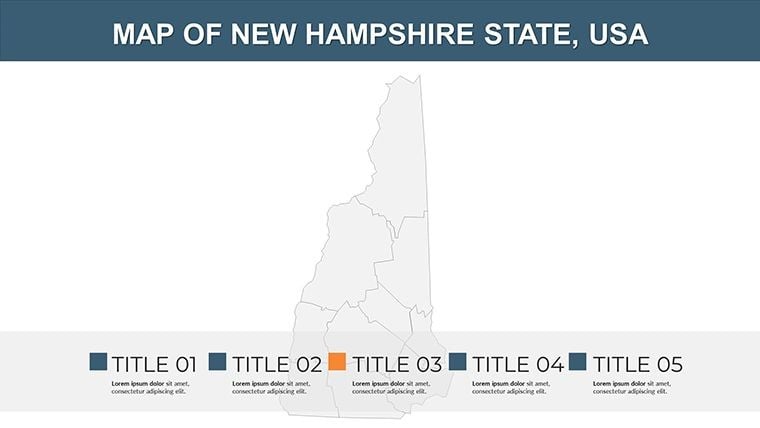
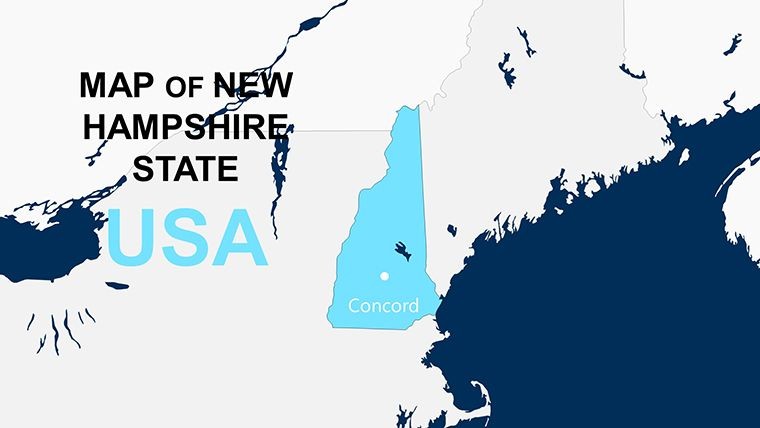
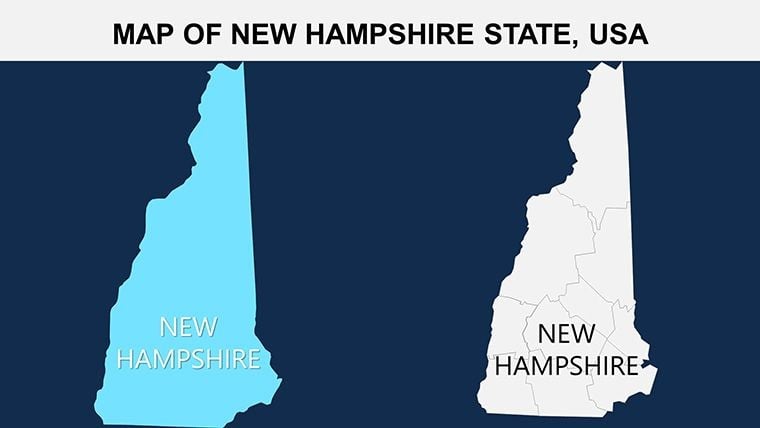
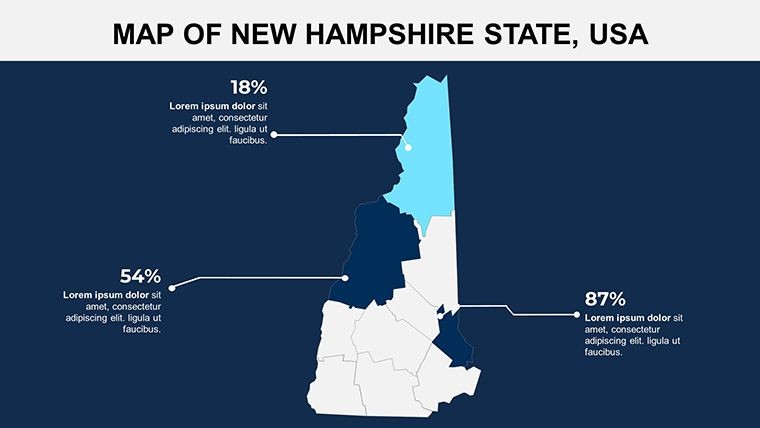
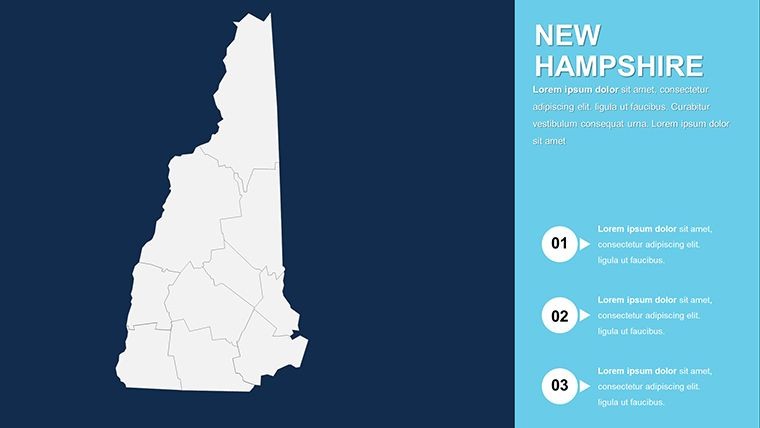
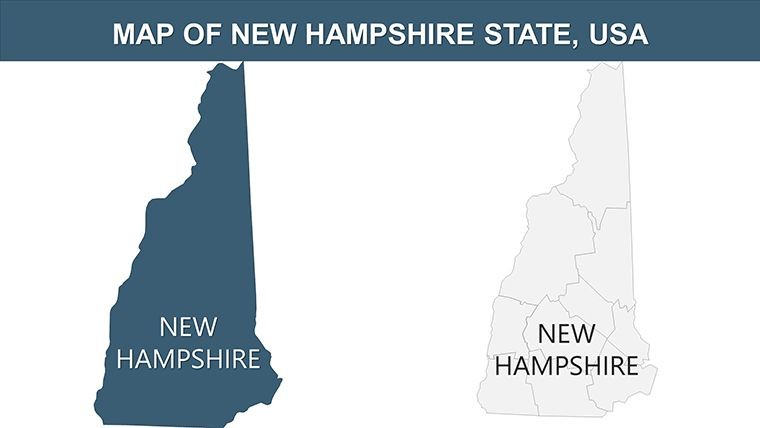
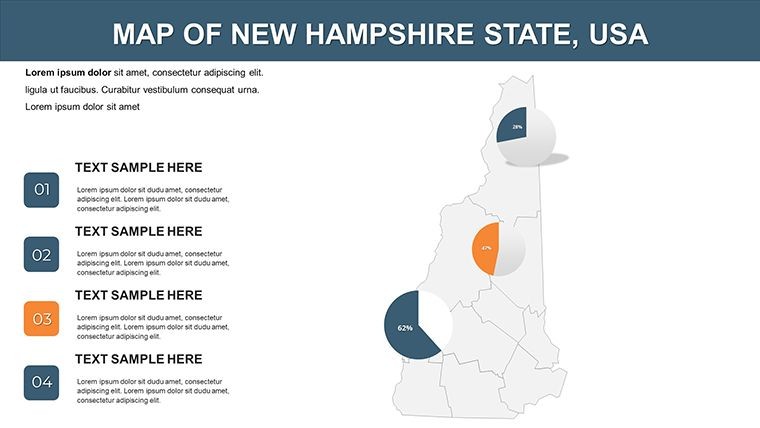
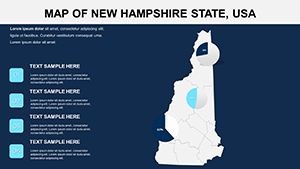
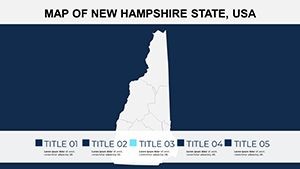
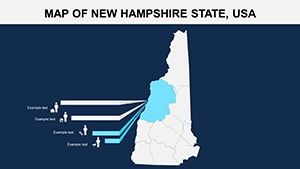
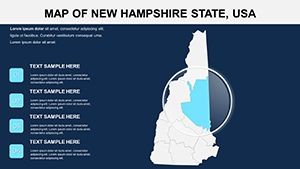
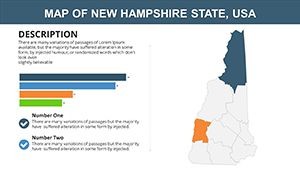
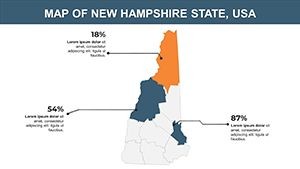
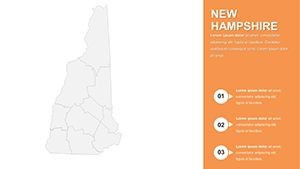
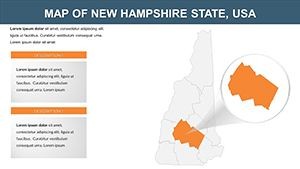
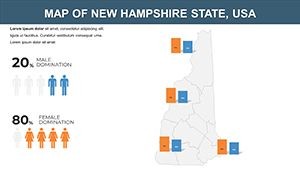
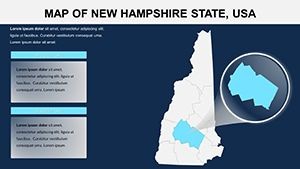
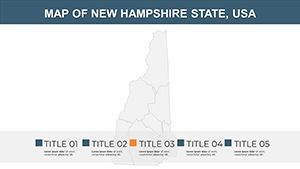
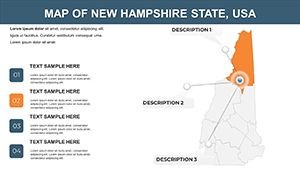
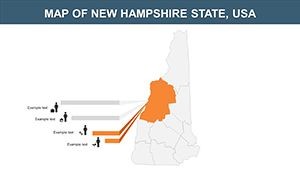
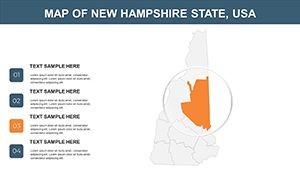
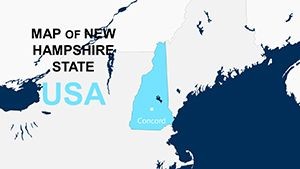
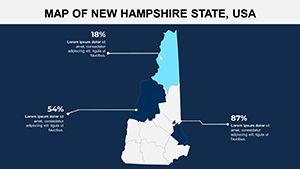
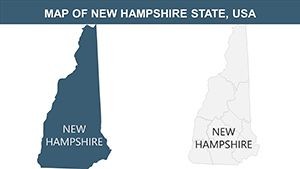
26 slides in a single .key file cover the full geographic range of New Hampshire - from the seacoast townships and Merrimack Valley counties through the Lakes Region to the White Mountains north country. The set includes full-state outline slides, county boundary maps, regional breakdowns by economic zone, and data-ready slides with pre-positioned chart placeholders sitting alongside the map shapes. Each geographic element is a separate vector object in Keynote, editable independently at any zoom level without pixelation.
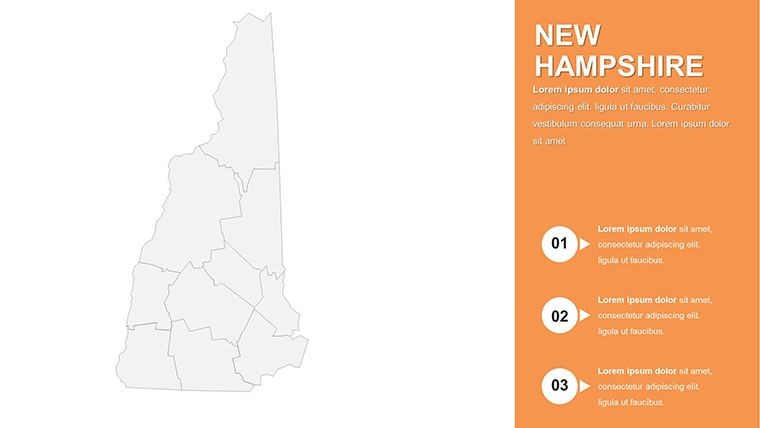
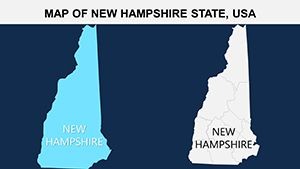
The four included color variants serve distinct presentation contexts. A neutral slate palette works for academic or government briefings where color carries no categorical meaning. A warm terrain palette suits tourism and environmental presentations. Two corporate-neutral schemes adapt quickly to brand guidelines without clashing against standard slide master colors. Switching between variants requires replacing fill colors on the master slide - a two-minute task covered in the customization workflow below.
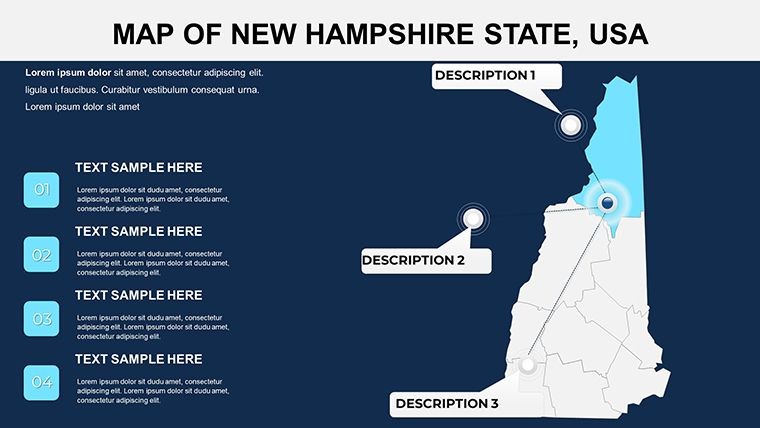
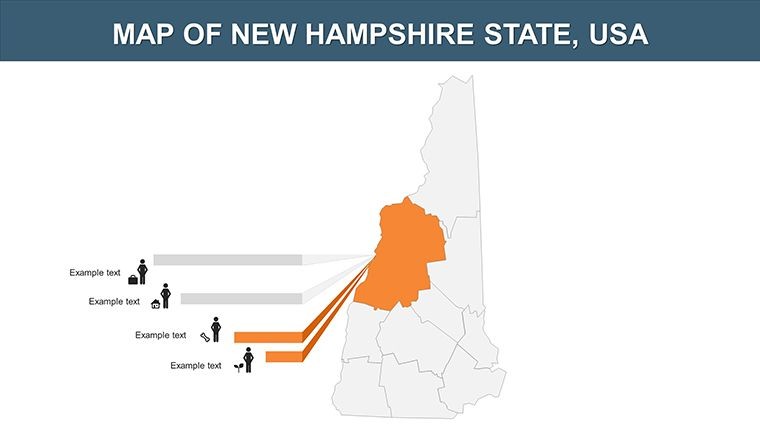
The distinction between this set and county-only map collections lies in the regional zoning slides. New Hampshire's economic and demographic story runs along elevation bands - coastal, Merrimack corridor, Lakes Region, northern highlands - not strictly along county lines. Slides that group counties into these functional regions give analysts and educators a layer of geographic organization that single-boundary sets do not include.
Editing Capabilities at a Glance
| Feature | Details |
|---|---|
| Slides included | 26 editable slides at 16:9 widescreen ratio |
| File format | .key - requires Keynote 12 or later on macOS |
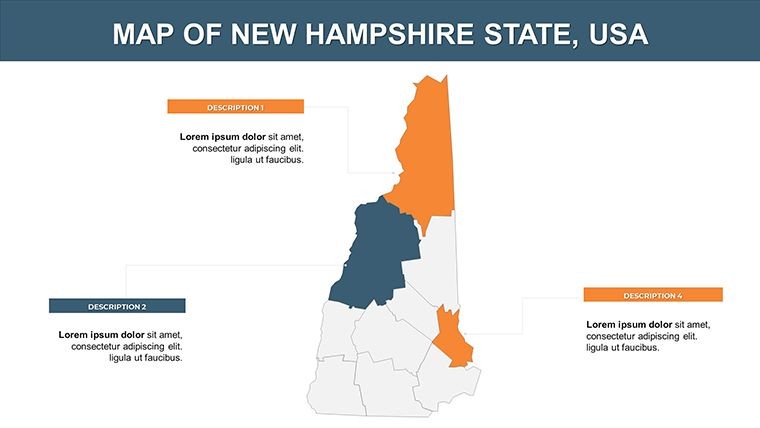
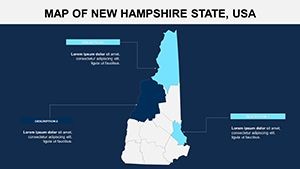
| Region shapes | County outlines and functional region zones editable independently - no ungrouping required |
| Color variants | 4 palettes (slate neutral, warm terrain, two corporate schemes) switchable via slide master |
| Text labels | County and city labels in standalone text boxes - edit without affecting adjacent map shapes |
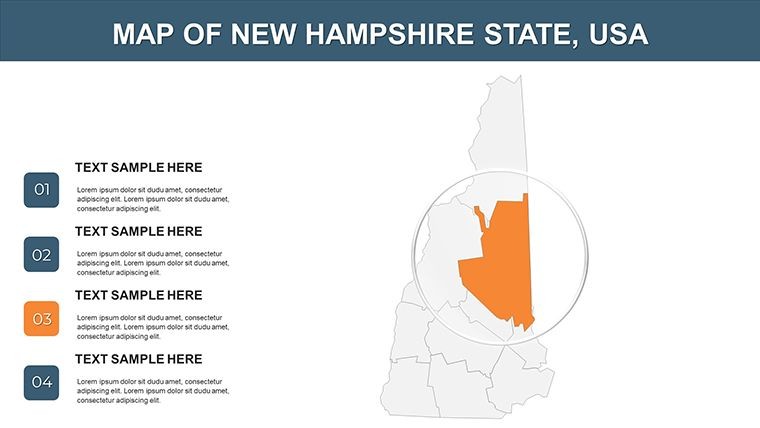
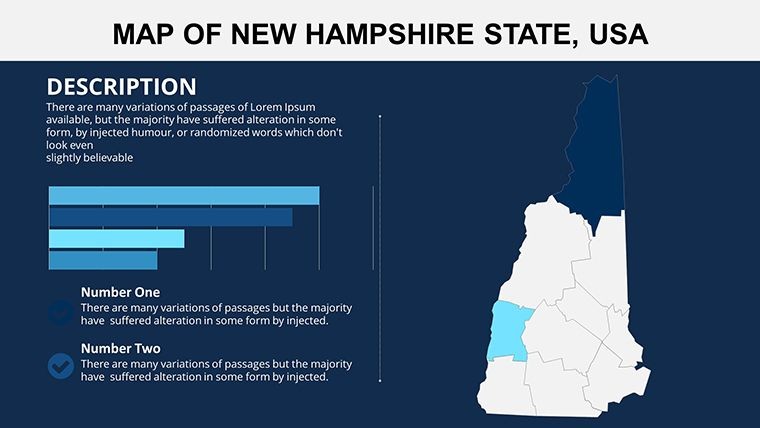
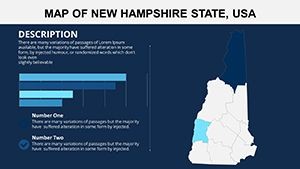
| Chart placeholders | Pre-positioned data chart objects on overlay slides; replace sample figures via Keynote data editor |
| Export options | .key for editing, PDF for static distribution, per-slide image export for web or print |
| Animation support | No preset animations; all shapes are animation-ready via Keynote's native Animate panel |
Three Situations Where This Pays Off
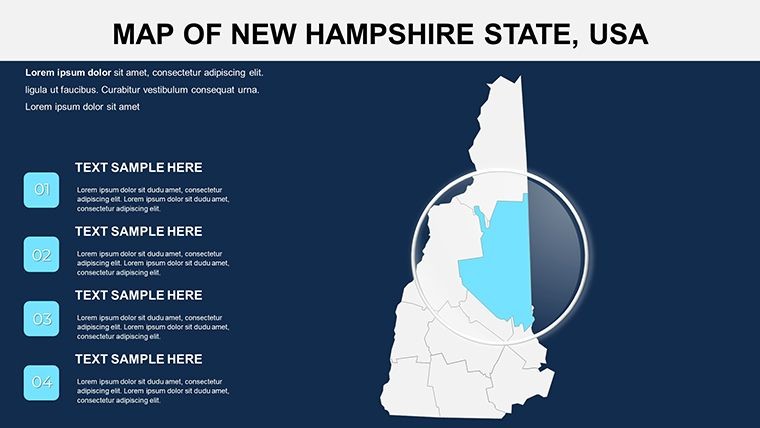
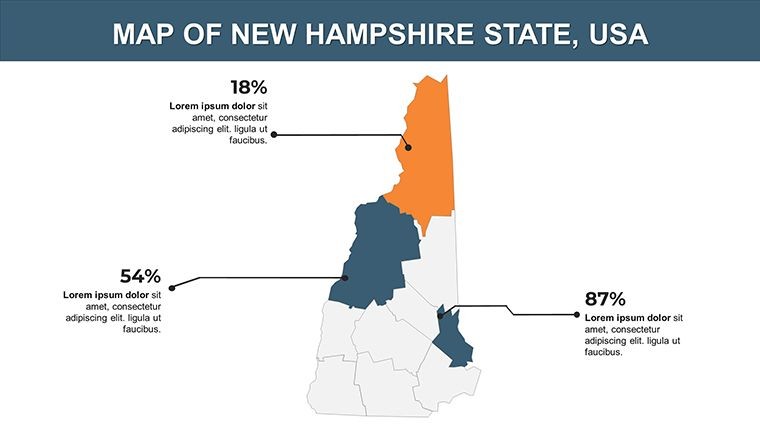
A marketing analyst at a Manchester-based regional retailer needed to present store performance by county to the operations team. The data existed in a spreadsheet; the problem was visualizing which counties were over- or under-indexing on the same map frame. Using the county boundary slides, she color-coded each of New Hampshire's 10 counties by performance tier, inserted the actual sales figures into the chart placeholder on the adjacent overlay slide, and produced a presentation-ready file in 45 minutes - down from the three hours the previous quarter's manually built version had taken. The same file template was reused for five consecutive monthly reviews by updating only the color coding and chart data.
A geography instructor at a Concord secondary school used the functional region slides to teach a unit on New Hampshire's economic diversity. The elevation-band zoning built into the regional slides let students see at a glance why the Merrimack Valley carries the majority of the state's employment base while the north country operates on a forestry and tourism economy. Adapting the slides to incorporate census data took one planning period rather than a full day of map construction.
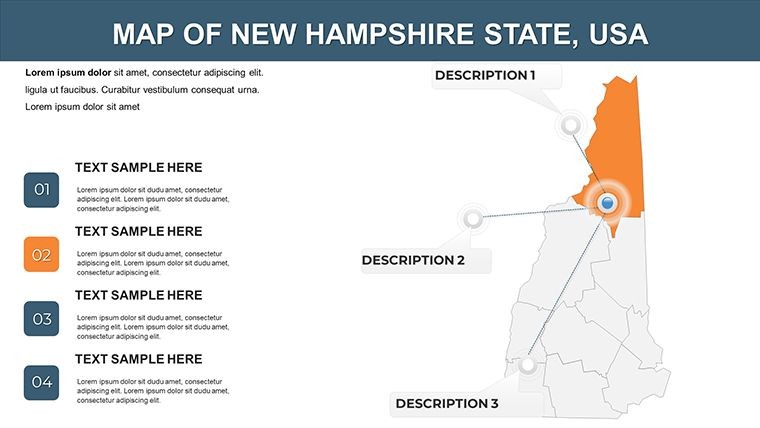
A state agency communications specialist preparing an infrastructure briefing for legislative staff needed county-level maps that would hold up on a projected screen in a hearing room. The external label placement - county names positioned outside the shape boundary with a thin leader line - kept text readable at projection distance without requiring font size changes between the screen version and the printed handout version of the same slide.
Download the .key file and start editing immediately.
From Download to Final Deck
Editing difficulty: Beginner. Keynote 12 or later on macOS is the only software required.
- Step 1 - Open the .key file in Keynote (1 minute). All 26 slides load with shapes separated into independently editable layers.
- Step 2 - Select a color variant (2 minutes). Open View › Edit Master Slides, locate the palette group for your chosen variant, and apply it. All slides update at once.
- Step 3 - Recolor specific regions (3 minutes). Click any county or zone shape, open Format › Fill, and apply your target color. Shapes do not need to be ungrouped first.
- Step 4 - Edit text labels (2 minutes). Double-click any county or city label to replace the sample text. Labels are not grouped with map shapes.
- Step 5 - Populate chart placeholders (5 minutes). Double-click the chart object on any data overlay slide to open the editor. Paste or type your figures directly.
- Step 6 - Export (1 minute). Use File › Export To › PDF for distribution or keep the .key file for further editing.
Building From Scratch vs. Starting Here
Drawing New Hampshire's county boundaries in Keynote from a blank slide requires placing 10 county polygon shapes aligned to actual geographic proportions, separating each into its own layer so individual counties can be recolored without affecting neighbors, adding labeled text boxes for each county seat, and building the functional region groupings on top of the county layer. A designer familiar with map construction estimates that work at 3-4 hours. Without map-construction experience, the geometry rarely aligns cleanly at county borders, which creates visual gaps or overlaps that become obvious during screen projection.
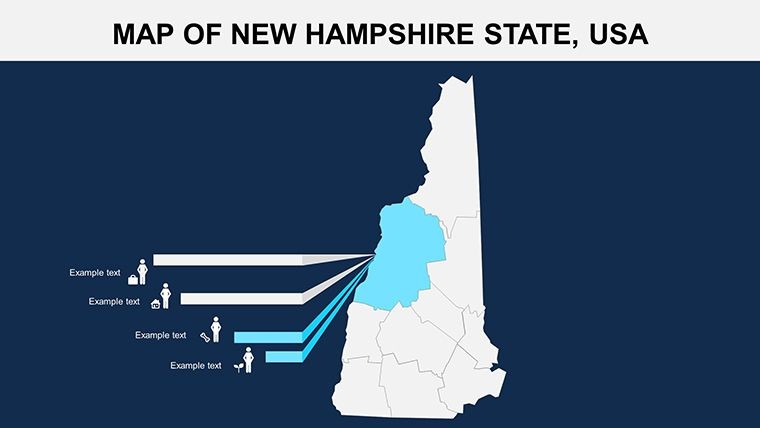
A specific structural point: the chart placeholders in the data overlay slides are pre-aligned to the map edge - the left margin of the chart frame meets the right margin of the map frame with consistent spacing. That spacing relationship matters on a projected slide because the audience reads the two elements as a connected unit: geography on the left, supporting data on the right. Rebuilding that alignment from scratch after drawing the map layers adds another 30-45 minutes and requires a designer's eye for margin consistency.
The county shape layer and the regional zone layer are kept as separate slide types rather than stacked on the same slide. That separation is intentional: stacking both layers on one slide forces the presenter to explain two levels of geographic aggregation simultaneously, which splits audience attention. Keeping them on dedicated slides lets the presenter move from regional context to county detail at a controlled pace.
Find the full collection of editable state maps at North America Keynote map templates. For presentations covering neighboring New England states, the Maine Keynote map template offers a comparable county-and-region structure for cross-state comparisons. Massachusetts-focused regional briefings pair well with the Massachusetts counties Keynote map for multi-state New England coverage.
Download the New Hampshire Keynote map and begin customizing today.
Which Keynote version is required to open this file?
Keynote 12 or later is required to open this .key file with full shape editing and color palette functionality. Keynote 12 is available as a free download from the Mac App Store and ships with macOS Monterey and later. Older Keynote versions may open the file but risk rendering issues with grouped shape layers or master slide color assignments. If your Mac runs macOS 11.5 or higher, you can update Keynote independently through the App Store at no cost before downloading the template.
How do I switch between the four color variants?
Open the .key file in Keynote, then choose View › Edit Master Slides. Each color variant is stored as a separate master slide group labeled by palette name. To activate a variant, select the master slides in that group, then apply them to the slides in your presentation via the Slide Layout menu. The switch updates all map shape fills and background colors across every affected slide in one operation. If you want to blend elements from two palettes - for example, using the corporate neutral background with a terrain-tinted map layer - you can override individual shape fills via Format › Fill on a per-slide basis after setting the base variant.
Can I use this template in client presentations and commercial work?
The standard single-purchase license permits use in presentations created for paying clients, including strategy decks, regional reports, investor briefings, and educational course materials. The license prohibits resale of the template file itself, redistribution of the .key file to third parties, and sublicensing arrangements. One purchase covers one user. Organizations where multiple team members need independent editing access to the source file should purchase individual licenses per user. Contact ImagineLayout directly for information about volume or team licensing options.
What is the refund policy for this download?
Refunds apply when the downloaded file is corrupted, does not open in Keynote 12 as described, or does not match the product page specifications. Because the file is delivered digitally and immediately upon purchase, ImagineLayout does not issue refunds for buyer's remorse or accidental purchases of the wrong state map. If you experience a technical problem - file fails to download, shapes are missing, or the format does not match the listing - contact support with your order number and a description of the specific problem. The team reviews each case individually and responds to resolve confirmed technical problems. Full policy details are on the Refund Policy page in the site footer.
Does the file include animations or are the slides static?
The file ships without preset animations. All 26 slides are static by default, which ensures clean PDF exports and compatibility across Keynote versions. Any shape, text box, or chart object in the file accepts Keynote's native build-in and build-out animations - select the element, open the Animate panel, and choose the style and trigger. This approach lets each user add motion that matches their presentation pace rather than working around animations designed for a different context. If you do not need animation at all, the static slides export to PDF with no additional steps.
Is there a free version available?
No free version exists for this product. The $12 purchase delivers all 26 slides, all four color variants, and the complete county and regional zone layer set in one .key file. There is no gated free tier with a subset of slides - the single purchase unlocks the full collection immediately. Given the 26-slide count and the multi-layer geographic structure covering county, functional region, and data overlay formats, the price reflects the complete package rather than a base set requiring an upgrade.