Nebraska Keynote Map Template - Instant Download | ImagineLayout


Type: Keynote Maps template
Category: North America
Sources Available: .key
Product ID: KM00121
Template incl.: 26 editable slides
What is a Keynote map template? A Keynote map template is a pre-built .key file containing editable geographic slides - state outlines, county boundaries, and data overlay layers - that open directly in Apple Keynote for immediate customization.
Files and Formats Included
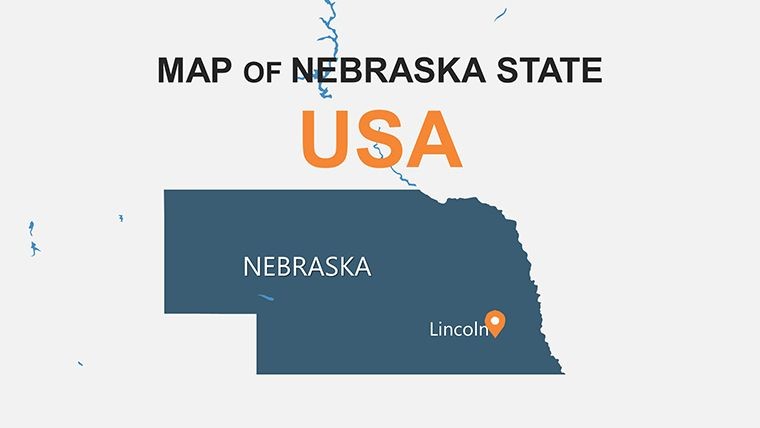
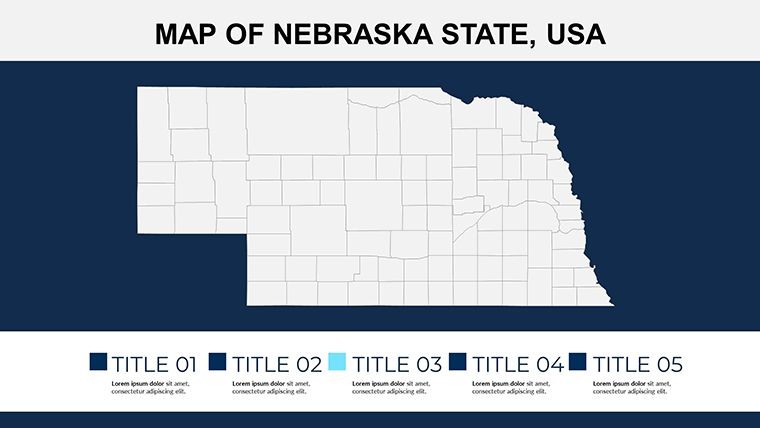
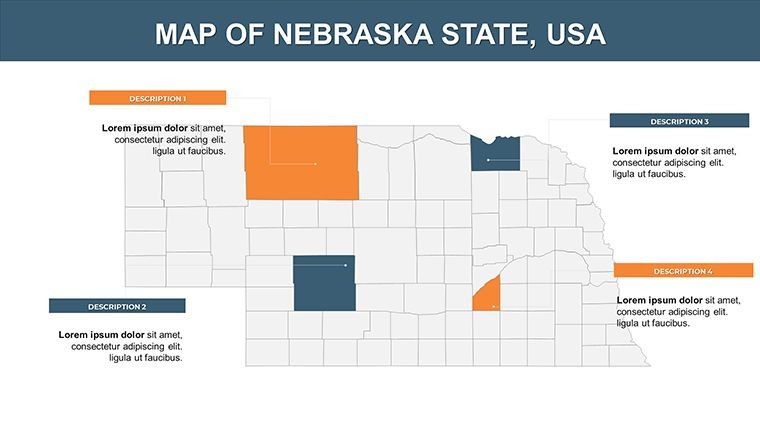
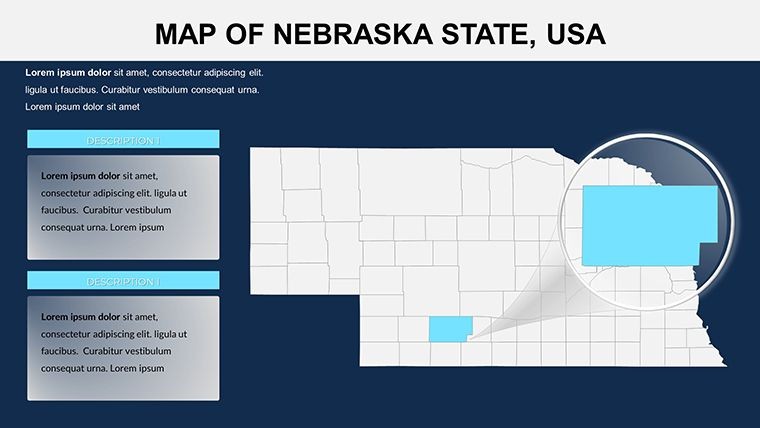
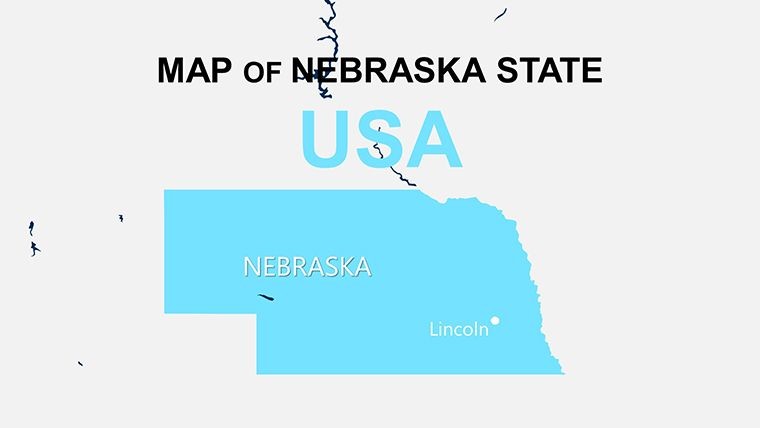
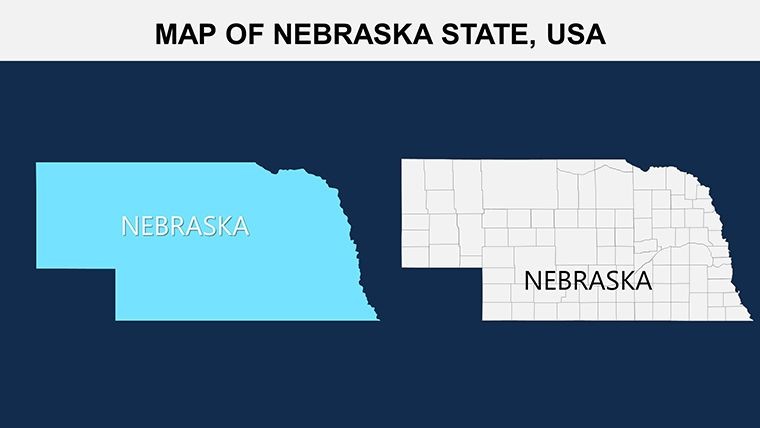
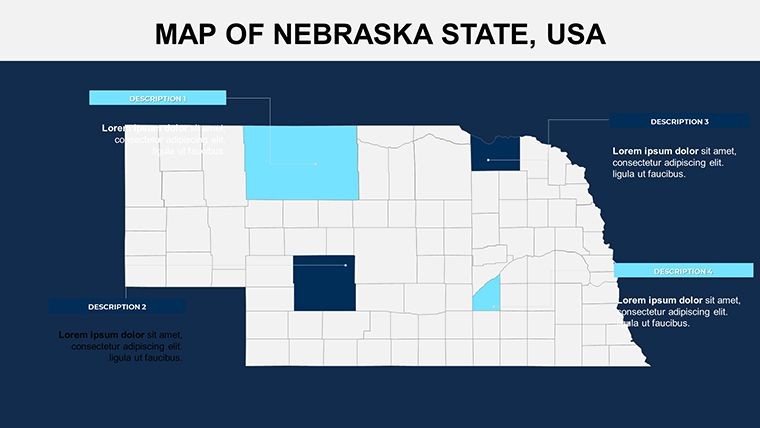
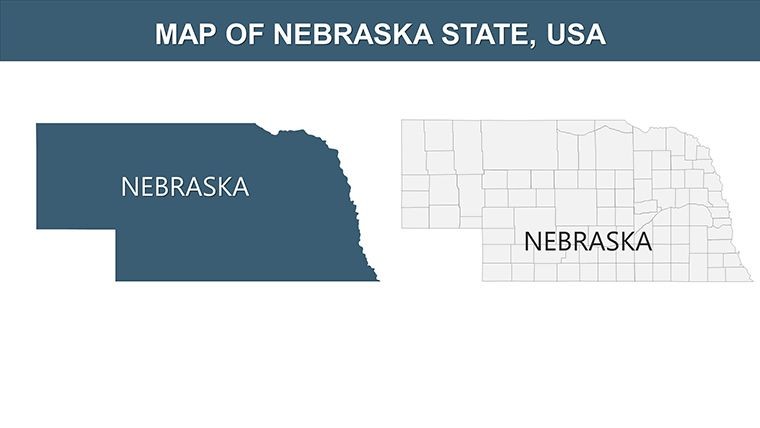
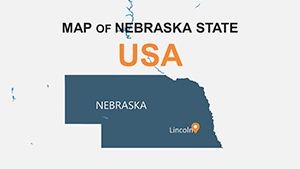
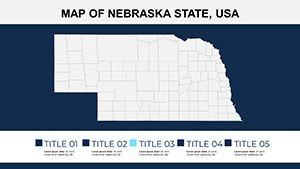
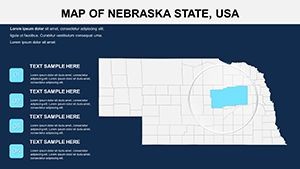
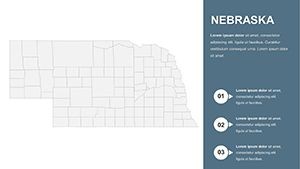
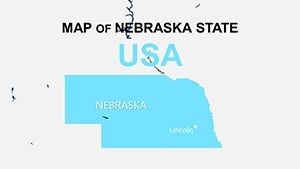
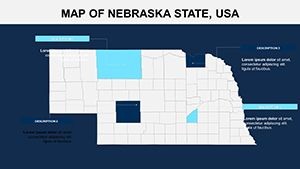
26 slides in a single .key file - that is the complete download for this Nebraska Keynote map template. Coverage spans full-state outlines, individual county boundaries, congressional district layers, major city markers for Omaha and Lincoln, and data overlay slides ready for population or agricultural statistics. Every shape is a native Keynote vector object, meaning borders resize without any loss of edge sharpness at projection scale.
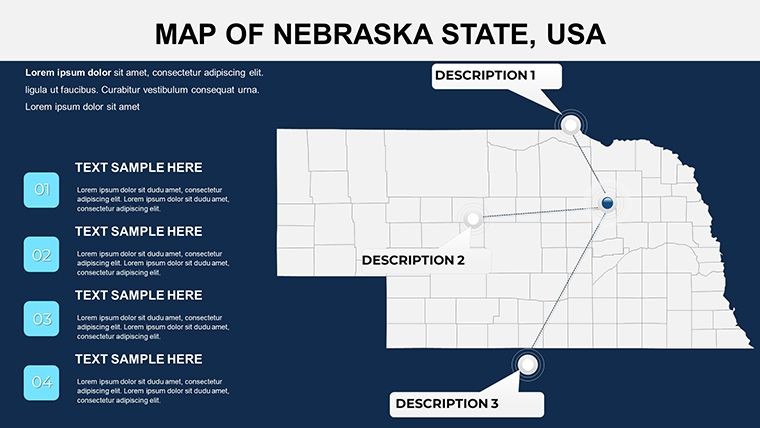
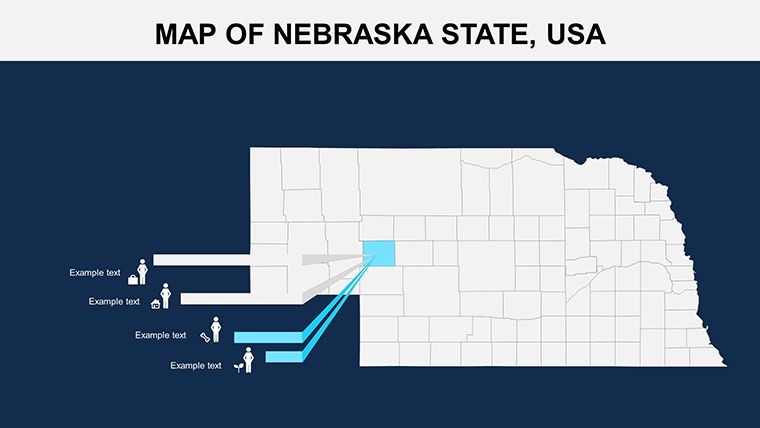
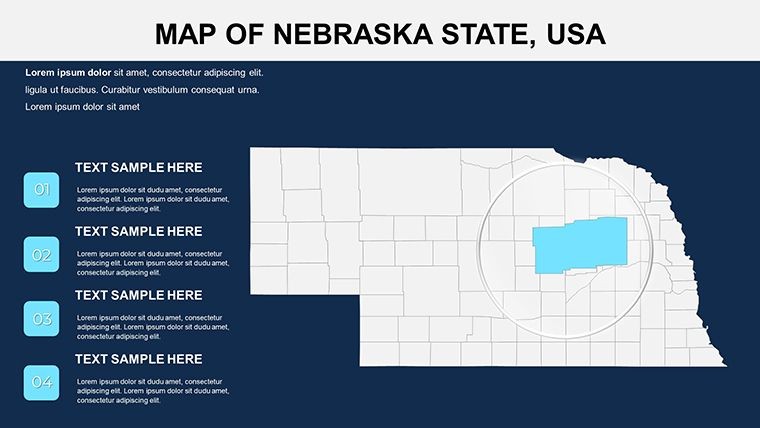
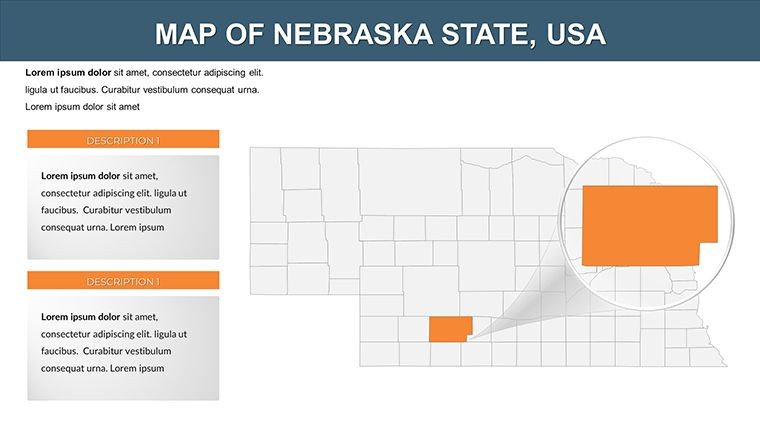
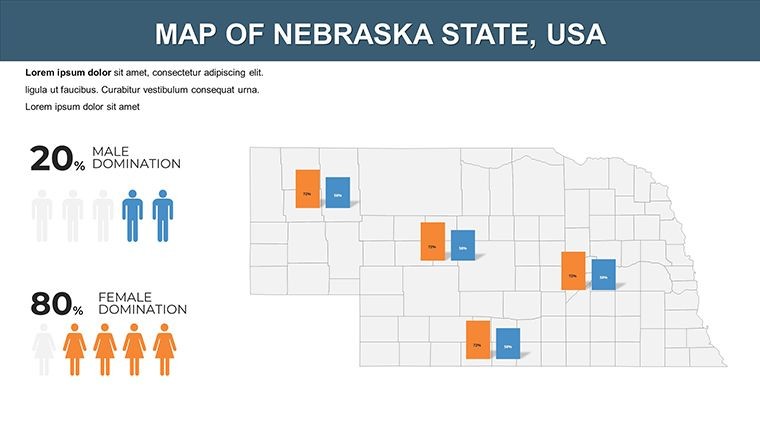
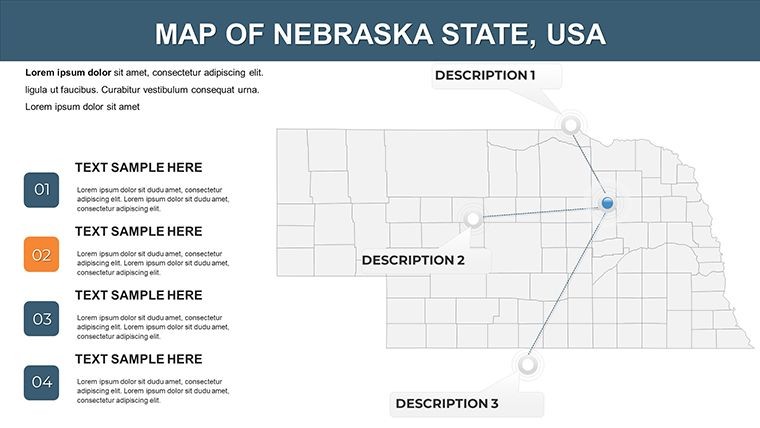
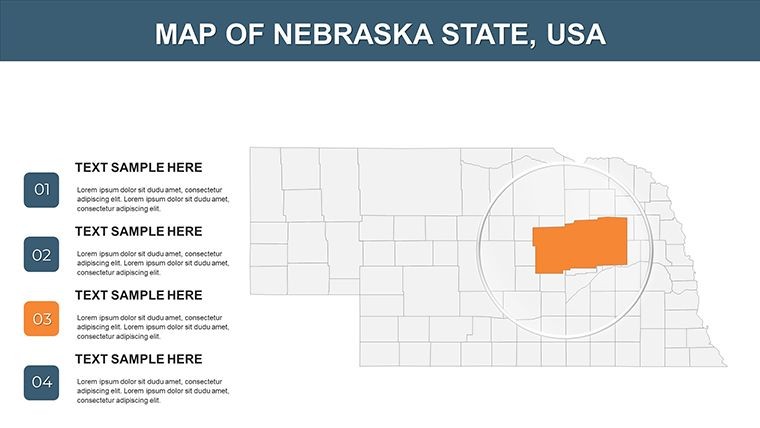
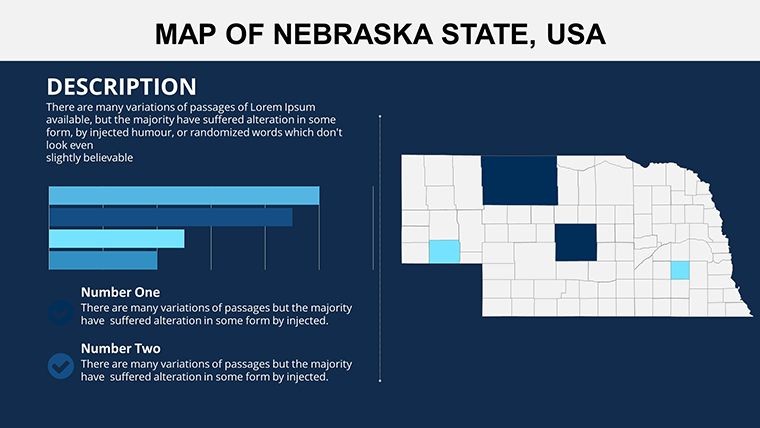
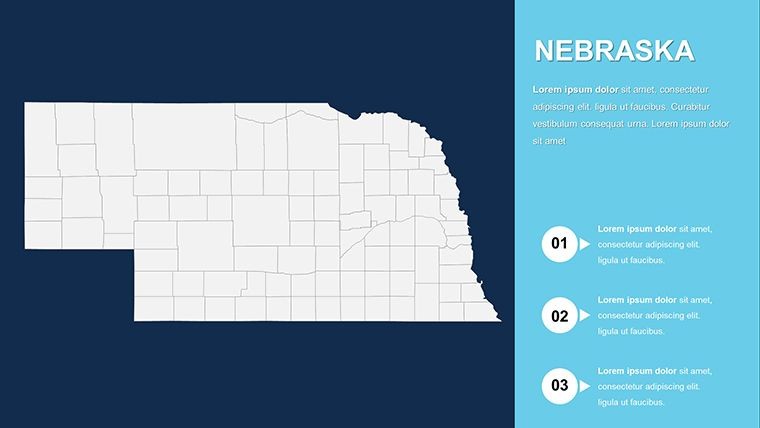
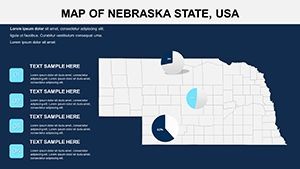
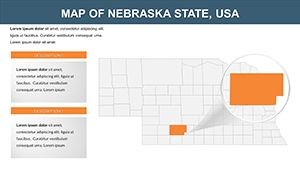
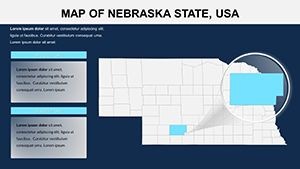
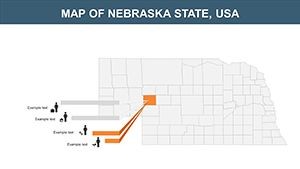
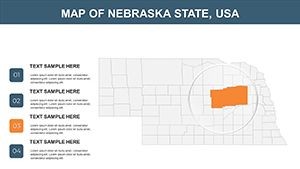
The slides work together as a layered system. Overview maps establish geographic context; county-level slides narrow the focus for regional reporting; data-ready layouts carry chart placeholders positioned alongside the map so figures and geography share the same frame. Moving from state summary to county detail to annotated data slide takes a single click per transition - no rebuilding between levels.
Among multi-slide state map collections in the North America category, this set covers a broader range of layout types than single-layer county grids. The combination of district coverage, city markers, and chart-integrated slides in one file removes the need to pull from multiple sources when building a regional business presentation or an academic briefing on Midwest demographics.
Key Specifications At a Glance
| Feature | Details |
|---|---|
| Slides included | 26 editable map slides at 16:9 widescreen ratio |
| File format | .key - opens in Keynote 12 or later on macOS |
| Editable regions | State outline, county boundaries, congressional districts - each shape adjustable independently |
| Color adjustments | Region fills recolor via Keynote Format › Fill panel; slide master palette applies global brand colors |
| Text labels | City and county labels sit in ungrouped text boxes - edit without unlocking surrounding shapes |
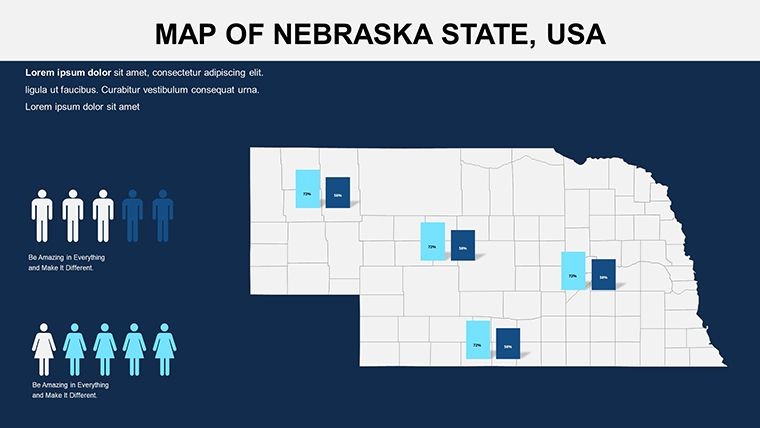
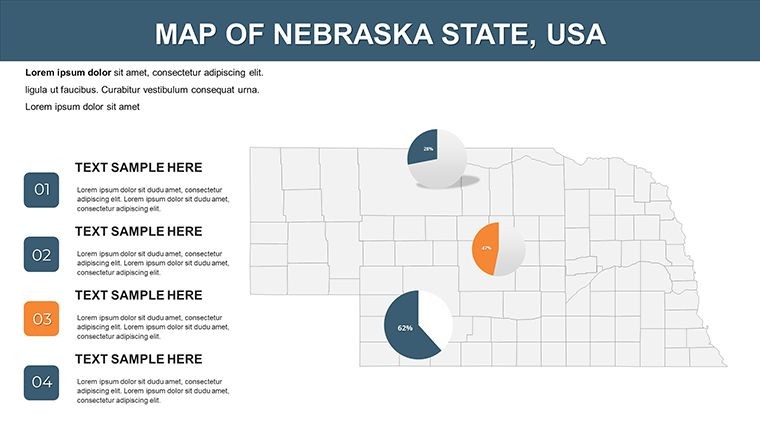
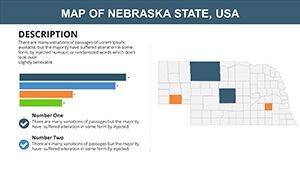
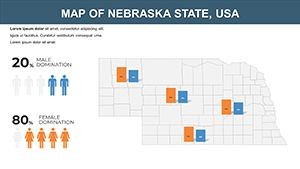
| Data overlay slides | Chart placeholders pre-positioned beside map shapes; replace sample data without repositioning elements |
| Export options | .key for editing, PDF for distribution, image export per slide for web or print use |
| Animation support | No preset animations included; Keynote's native build-in/build-out effects apply to any shape layer |
Who Reaches for This Template
A regional sales director at an Omaha-based distributor needed to brief the executive team on county-by-county revenue gaps across Nebraska. Building that map from scratch in Keynote - drawing 93 county shapes, labeling each, aligning a data column alongside - would take the better part of a working day. With the county-level slides already structured, she replaced the sample labels with actual territory names, applied the company's color palette to highlight underperforming counties, and had a presentation-ready file in under an hour. The same deck was reused for three consecutive quarterly briefings by swapping only the color coding.
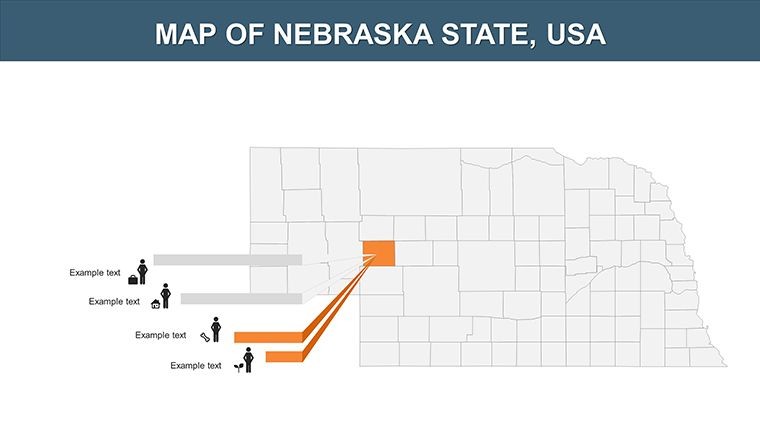
University instructors covering Great Plains geography, agricultural economics, or Midwest history reach for this map set when building lecture slides. A professor teaching land-use patterns overlaid USDA crop data onto the county grid, walked students through visual zone segmentation of Nebraska's agricultural regions, and exported the finished slides directly into the course management system. Preparation time dropped from two hours to roughly 40 minutes.
Download the .key file and start editing immediately.
Customization in 5 Steps
Editing difficulty: Beginner. No design software beyond Keynote is required.
- Step 1 - Open the .key file in Keynote 12 or later (1 minute). All 26 slides load with shapes already separated into editable layers.
- Step 2 - Select your target region shapes and apply brand colors (3 minutes). Click any county or district shape, open Format › Fill, and choose a solid or gradient color. Repeat for each zone you want to distinguish.
- Step 3 - Replace placeholder labels (3 minutes). Double-click any city or county text box to overwrite the sample text. Labels are not grouped with map shapes, so editing one does not affect adjacent elements.
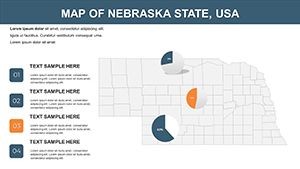
- Step 4 - Insert your data into the chart placeholder slides (5 minutes). The data overlay slides carry pre-positioned chart objects. Double-click the chart to open the data editor and paste in your figures.
- Step 5 - Export as .key or PDF (1 minute). Use File › Export To for the format your audience needs.
Why This Template, Not a Blank Slide
Drawing Nebraska's county boundaries from scratch in Keynote means placing 93 individual polygon shapes, aligning them to geographic accuracy, adding labels for each county seat, and then separating the layers so a single county can be recolored without disturbing its neighbors. That work typically runs 4-6 hours for a designer with map-construction experience. Without that experience, the result is often a rough approximation that loses accuracy at the county border level - exactly where data comparisons matter most.
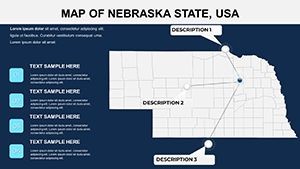
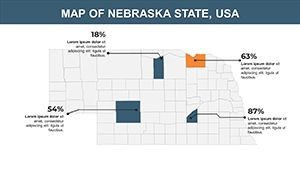
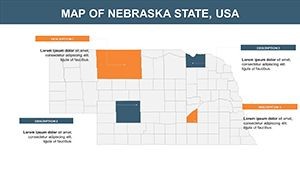
A specific design decision worth noting: labels in this set sit outside their corresponding county shapes, connected by thin leader lines rather than embedded inside the shape fill. On a laptop screen, text inside small county polygons is readable. On a conference room projector at 3 meters, the same inside-label layout compresses to illegible. The external label placement keeps county names readable during live meetings without requiring any font size adjustments between screen and projection contexts.
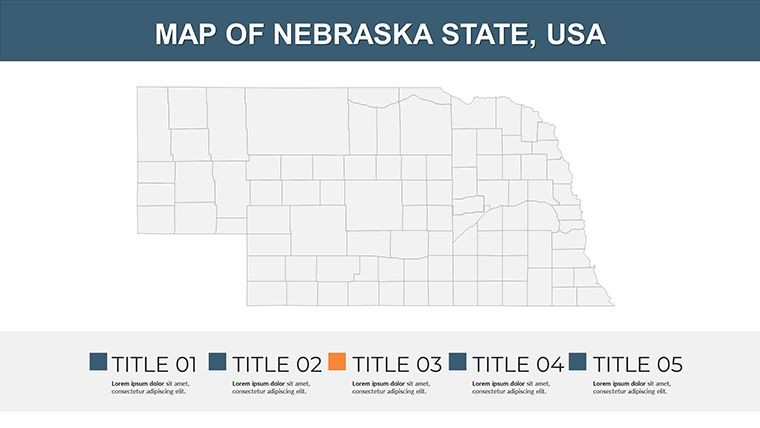
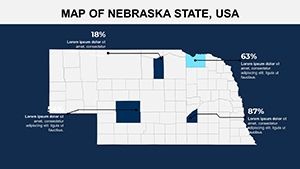
The color segmentation across district and county slides uses distinct, non-adjacent hues rather than a sequential tint scale. Sequential tints (light-to-dark of one color) work well for single-variable intensity maps. When a Nebraska presentation needs to distinguish multiple independent categories - sales territories, crop types, legislative districts - non-adjacent colors prevent the audience from reading a hierarchy that does not exist in the data.
Explore more North America Keynote map templates for adjacent state coverage, or pair this set with a Iowa state maps Keynote template when your presentation spans the broader Midwest corridor. For comparable county-grid structure in a neighboring state, the Kansas counties Keynote map offers a similar layer system for cross-border agricultural comparisons.
Download the Nebraska Keynote map and begin customizing today.
Which Keynote version do I need to open this file?
Keynote 12 or later is required to open this .key file with full editing capability. Keynote 12 ships with macOS Monterey and later; it is also available as a free download from the Mac App Store for any Mac running macOS 11.5 or higher. Older versions of Keynote may open the file but cannot guarantee that all shape layers and text formatting render correctly. If you are on an older macOS version, updating Keynote independently from the App Store is the recommended path before downloading.
How do I change the color scheme to match my brand?
Open the .key file in Keynote, then go to View › Edit Master Slides to access the slide master palette. Changing fill colors on the master level updates all slides that inherit that style. For individual region shapes - specific counties or districts - click the shape, open the Format panel on the right, select Fill, and choose your color from the picker or enter a hex code directly. This two-level approach lets you set a global brand color via the master and then apply exception colors to specific geographic zones without affecting the rest of the deck.
Can I use this template for paid client work?
A standard single-purchase license covers use in presentations prepared for clients, including internal corporate decks, investor briefings, and educational materials. The license does not permit resale of the template itself, redistribution of the raw .key file, or sublicensing to third parties. Purchasing one copy covers one end-user; if multiple team members at a firm need independent editing access, each user requires their own purchase. For questions about multi-seat or extended licensing arrangements, the ImagineLayout contact page handles those requests directly.
What is the refund policy?
ImagineLayout's refund policy covers situations where the downloaded file is corrupted, fails to open in the stated software, or does not match the product description shown on the page. Because digital files are delivered immediately upon purchase, refunds are not issued simply because the buyer changed their mind or selected the wrong product. If you encounter a technical issue with your download, contact ImagineLayout support with your order number and a description of the problem. The support team reviews each case individually. Full details are available on the Refund Policy page linked in the site footer.
Does this file include animations?
No preset animations are included in the download. Every shape and text layer is structured so that Keynote's native build-in and build-out effects can be applied to any element without disrupting the layer relationships. To add a reveal animation to a county shape, select the shape, open the Animate panel, choose a build-in style such as Wipe or Appear, and set the trigger to On Click. The same process applies to the chart placeholder slides. Keeping the file animation-free by default ensures compatibility across Keynote versions and prevents unwanted motion during static slide exports to PDF.
Is there a free version of this template?
No free tier is available for this product. The $15 purchase covers all 26 slides, all region layers, and the full county-boundary set in a single .key file. There is no split between a limited free download and a paid upgrade - the purchase provides immediate access to the complete collection. The price point reflects the full slide count and the multi-layer geographic structure, which includes county, district, and city-marker layers not typically found in single-layout map files at this price range.