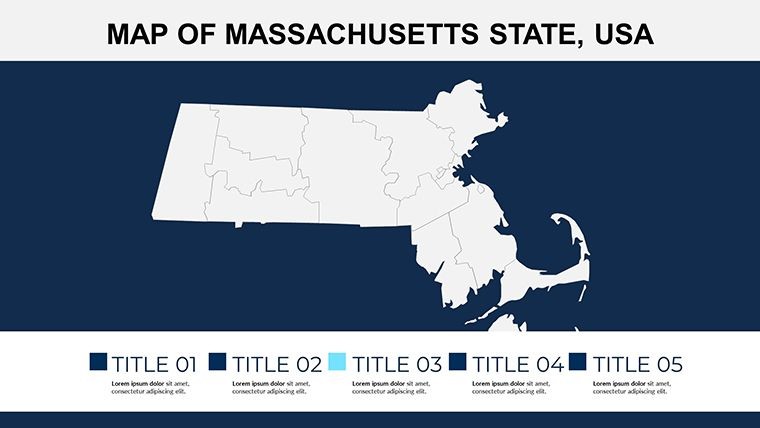
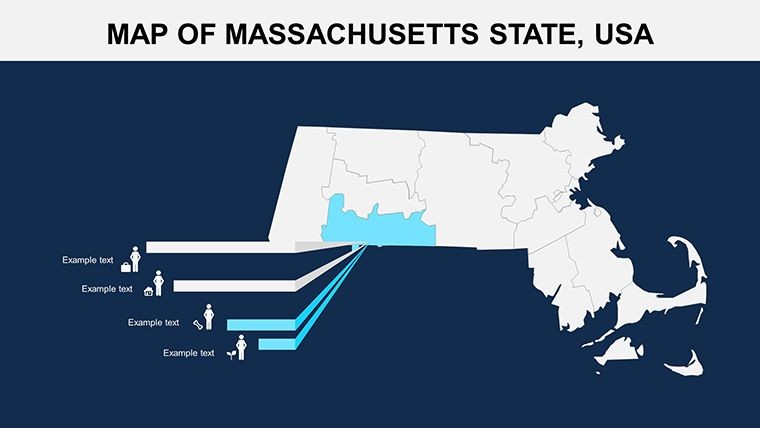
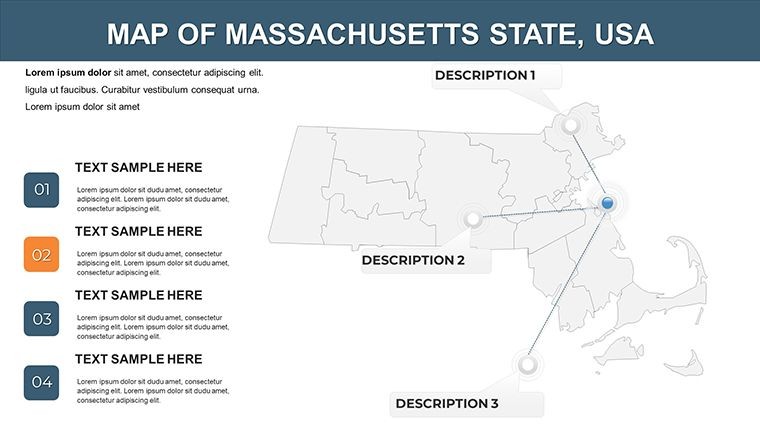
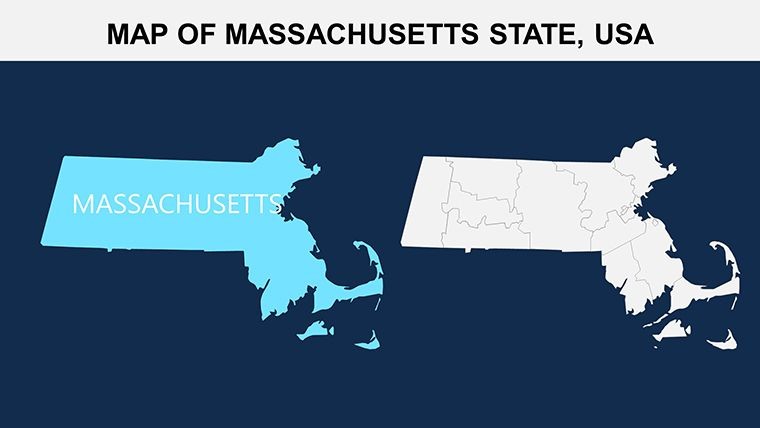
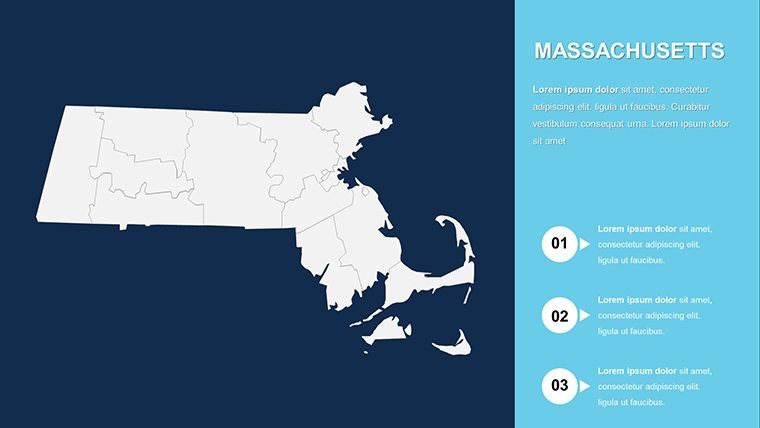
Keynote Maps of Massachusetts Counties: Precision for Professional Impact


Type: Keynote Maps template
Category: North America
Sources Available: .key
Product ID: KM00114
Template incl.: 26 editable slides
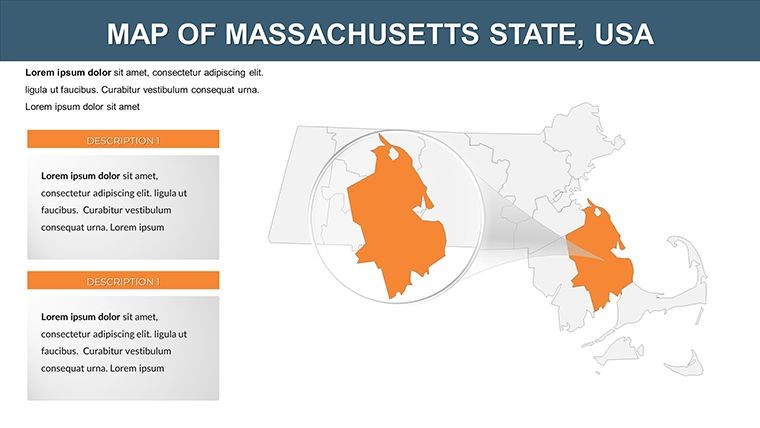
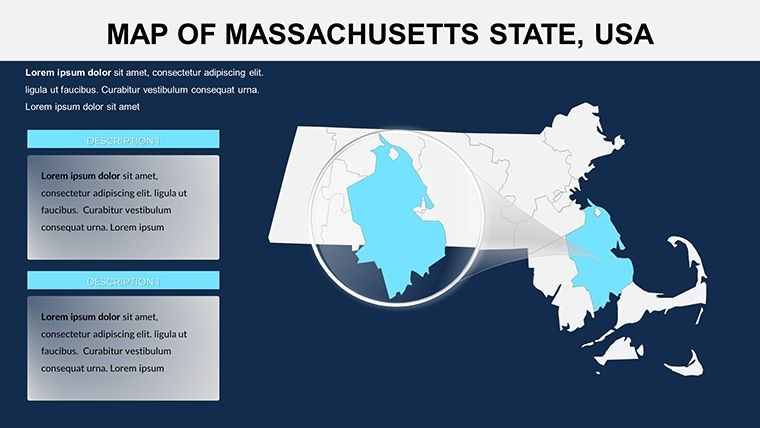
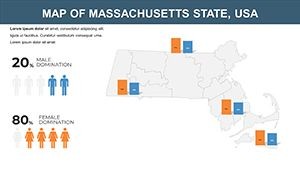
Envision unlocking the storied landscapes of Massachusetts, from Boston's urban pulse to the Berkshires' serene hills, all within a single presentation tool. Our Keynote maps template for Massachusetts counties delivers exactly that, with 26 editable slides designed to empower architects, historians, and analysts alike. As part of New England's crown jewel, this template captures the state's essence, allowing you to overlay data on its 14 counties with ease. It's more than maps - it's a versatile asset that tackles the challenge of visualizing regional dynamics, offering custom animations and vector elements to make your points stick. Tailored for Keynote users, it streamlines creation, fostering presentations that blend expertise with visual allure, ultimately driving better engagement and understanding.
Key Features That Set This Template Apart
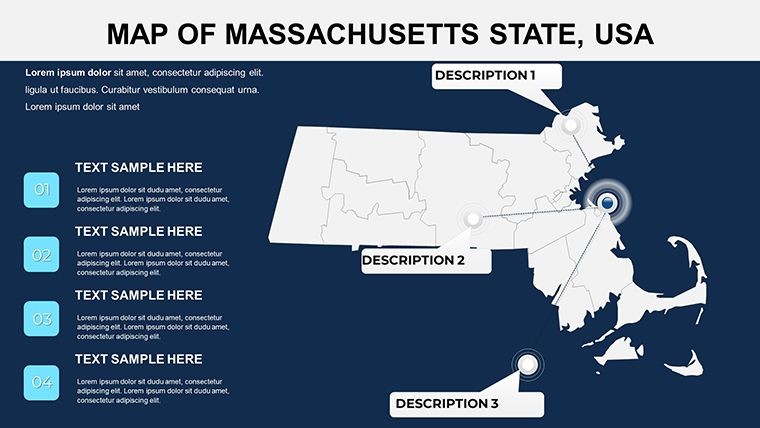
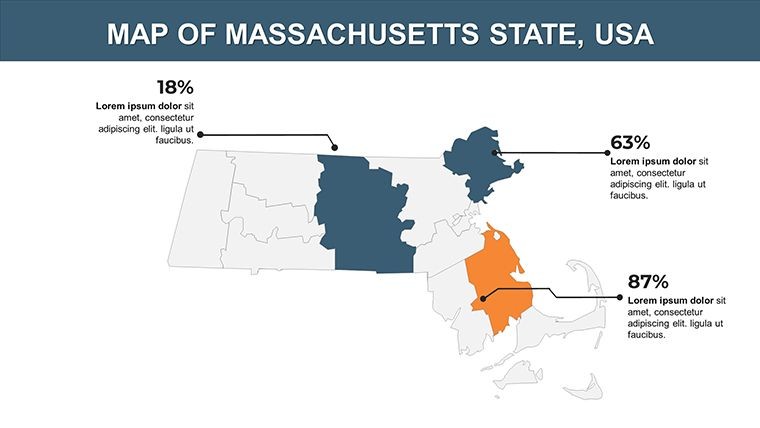
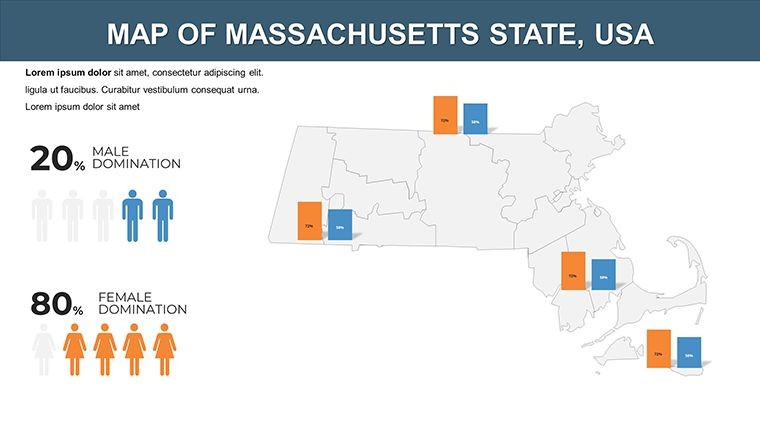
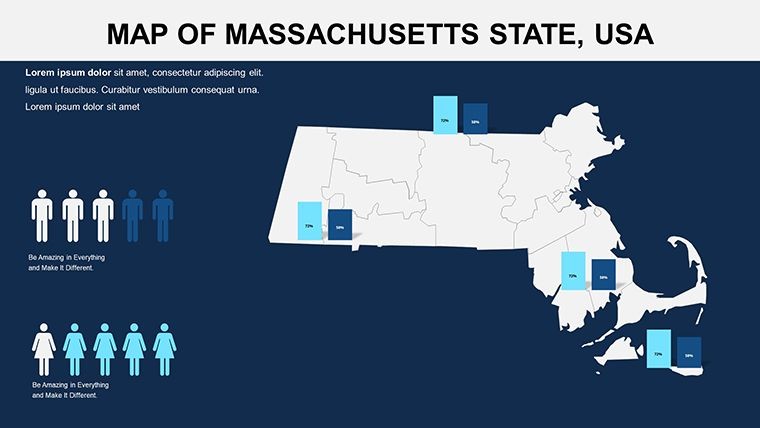
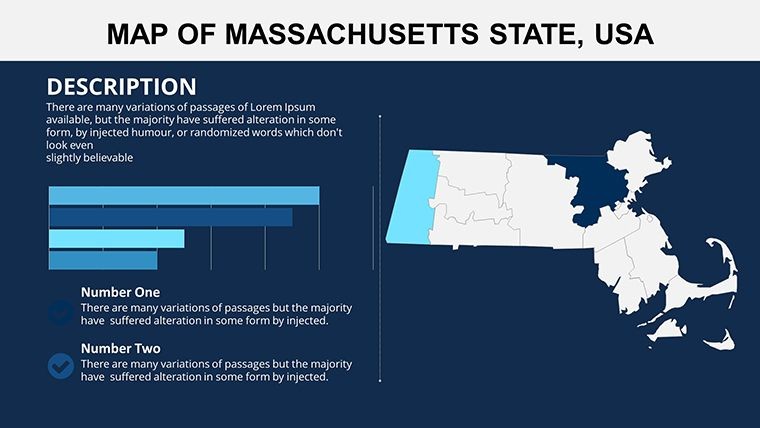
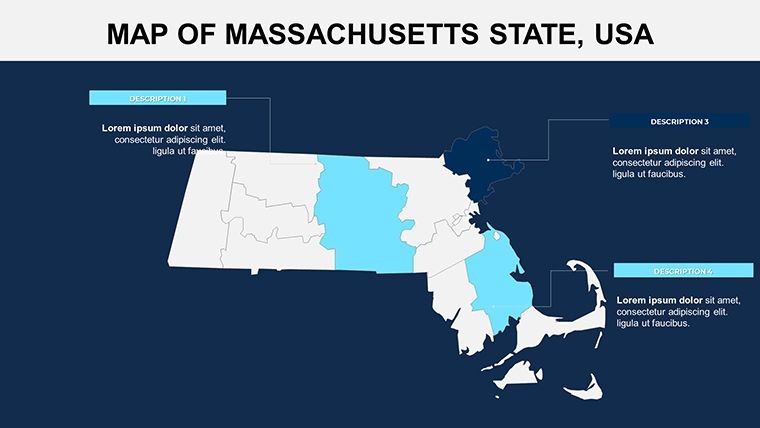
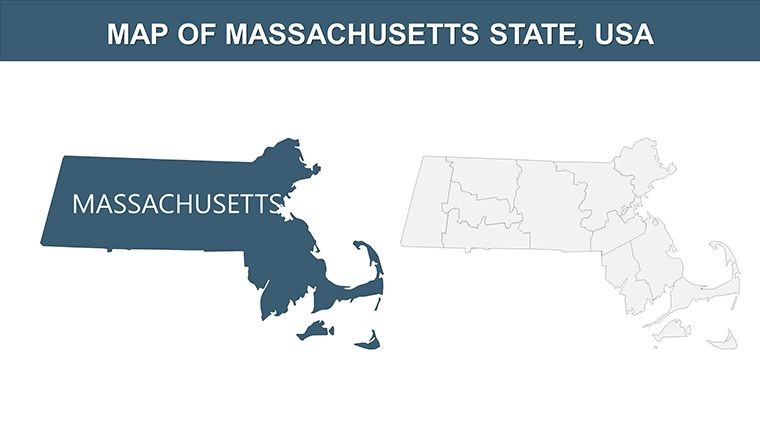
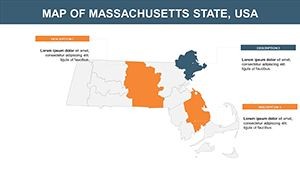
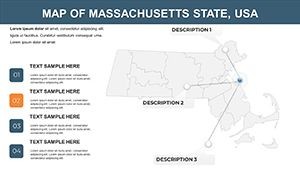
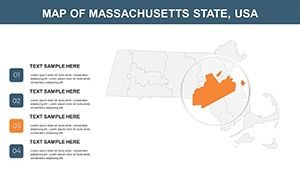
This template excels with its vector-based county maps, ensuring crisp details at any scale. Editable features encompass color adjustments for thematic emphasis - perhaps blues for coastal Essex County or greens for inland Worcester - alongside text placeholders for annotations. Unique inclusions like vector icons (e.g., lighthouse for Cape Cod themes) and PNG files add layers of customization, far surpassing standard Keynote offerings. Animation capabilities let you reveal counties progressively, ideal for narrative builds, while the structure supports seamless integration of data visuals, promoting a professional polish that's trustworthy and authoritative.
In-Depth Slide Overview: Structured for Success
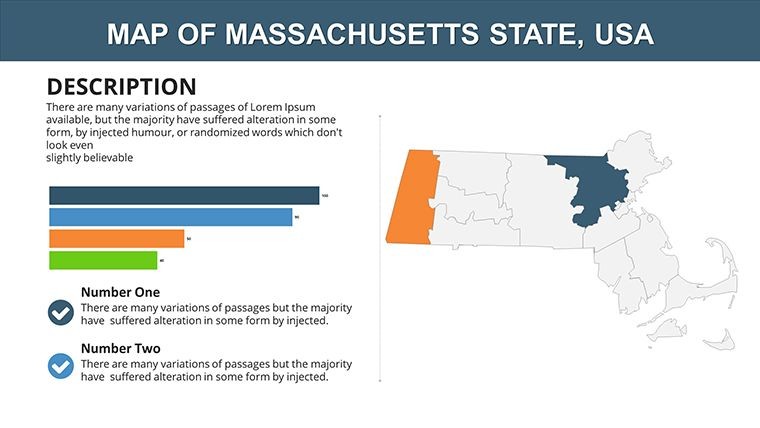
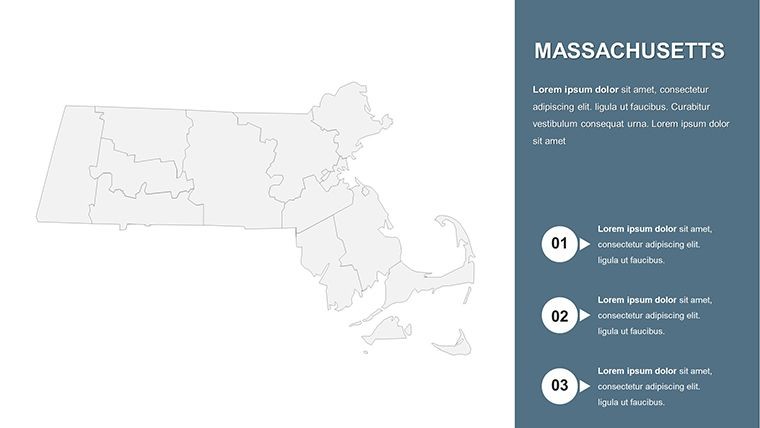
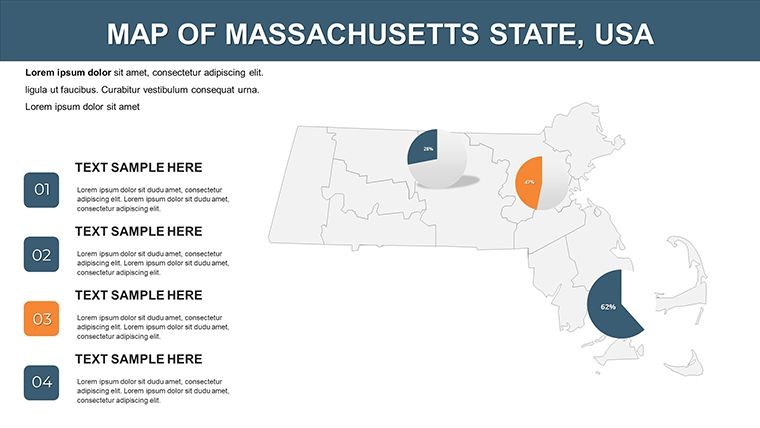
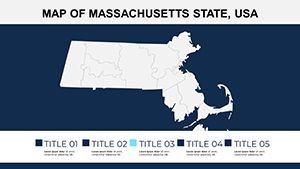
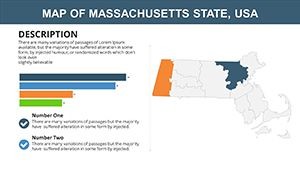
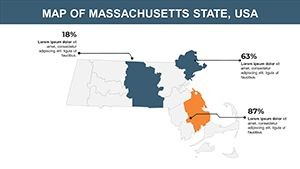
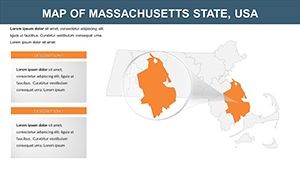
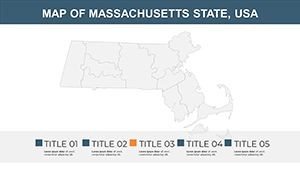
The 26 slides form a logical progression: Slide 1 presents a holistic state map with county outlines. Slides 2-9 break down eastern counties like Suffolk and Middlesex, with editable zooms for urban studies. Mid-template, Slides 10-17 incorporate thematic layers - transportation in Slide 12 showing MBTA routes, or economic indicators in Slide 15 with bar charts. Concluding slides 18-26 focus on comparative tools, like side-by-side county GDP visuals or timeline animations for historical shifts. Each slide's vector nature allows for effortless tweaks, ensuring adaptability to specific contexts like AIA-compliant architectural reviews.
Targeted Applications: Realizing Massachusetts' Potential
Architects might use it to pitch sustainable developments in Barnstable County, animating growth projections to align with AIA standards for eco-friendly design. Historians could map Revolutionary War sites across counties, enhancing lectures with interactive elements that boost retention, as evidenced by educational research from the Smithsonian. For economic analysts, it's a boon for reports on tech hubs in Middlesex, overlaying innovation metrics - similar to strategies in McKinsey regional studies. This template's strength lies in its ability to transform data into stories, as seen in real cases where nonprofits mapped health disparities, securing policy changes through compelling visuals.
Customization Workflow: From Concept to Completion
- Import the .key file into Keynote and select your starting slide.
- Edit vector paths to highlight counties; apply shadows for depth.
- Add icons from the included library - e.g., apple for orchard-rich areas.
- Animate transitions: Build county reveals for dramatic effect.
- Finalize with exports, optimized for sharing or printing.
This process facilitates quick iterations, like adapting for a town hall on zoning in Norfolk County, ensuring relevance and impact.
Advantages Over Generic Alternatives
Beyond basic maps, this offers pre-configured county accuracy and icon sets, minimizing setup time. It naturally incorporates LSI like "New England county demographics" or "Bay State planning tools," enhancing discoverability. Users praise its reliability, with one planner noting it streamlined AIA presentations. Grounded in design principles from authorities like the Urban Land Institute, it prioritizes clarity and engagement, avoiding overload.
Consider a university case: Faculty used similar maps for climate impact studies on coastal counties, leading to published insights - highlighting the template's role in credible work.
Pro Design Tips for Optimal Use
- Utilize Keynote's alignment tools for precise icon placement.
- Layer PNGs for textured backgrounds, evoking Massachusetts' foliage.
- Avoid over-animation to maintain professionalism.
- Incorporate accessibility features like alt text for maps.
- Pair with data sources like Census.gov for authenticity.
Drawn from expert practices, these ensure your presentations stand out ethically and effectively.
In essence, the Keynote maps of Massachusetts counties template is your ally in crafting influential visuals. From academic halls to corporate boards, it elevates your content. Seize the opportunity - customize your Massachusetts masterpiece today.
Frequently Asked Questions
- How flexible are the animation options?
- You can add custom effects to any element, like fading in counties, for dynamic storytelling.
- What extras come with the template?
- Includes vector icons and PNG files for enhanced customization beyond basic maps.
- Is it suitable for architectural use?
- Yes, aligns with AIA standards for regional planning and visualizations.
- Can I scale the maps without quality loss?
- Absolutely, as they're vector-based for infinite scalability.
- What's the compatibility?
- Designed for Keynote on Mac, with .key files for easy access.