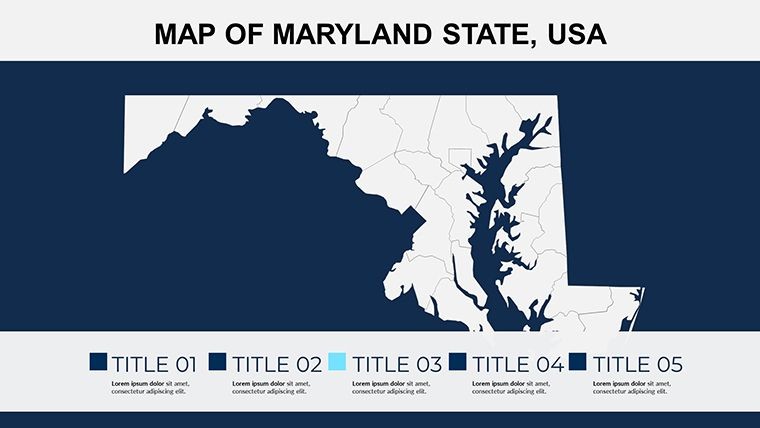
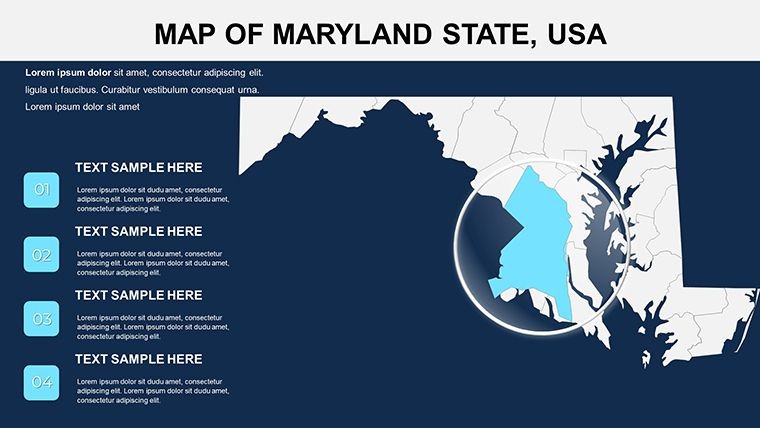
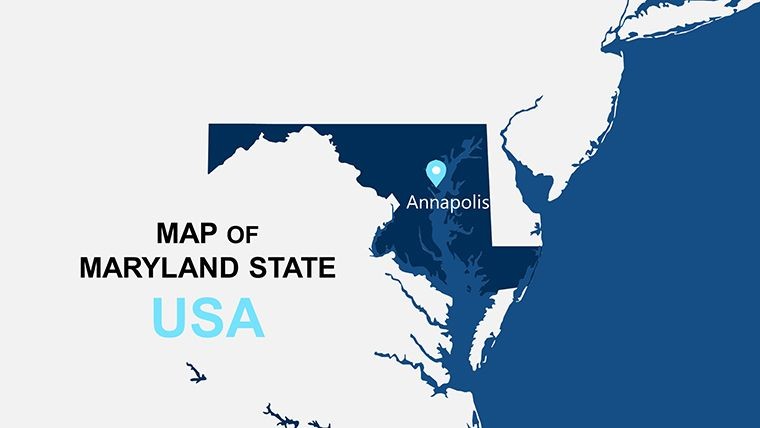
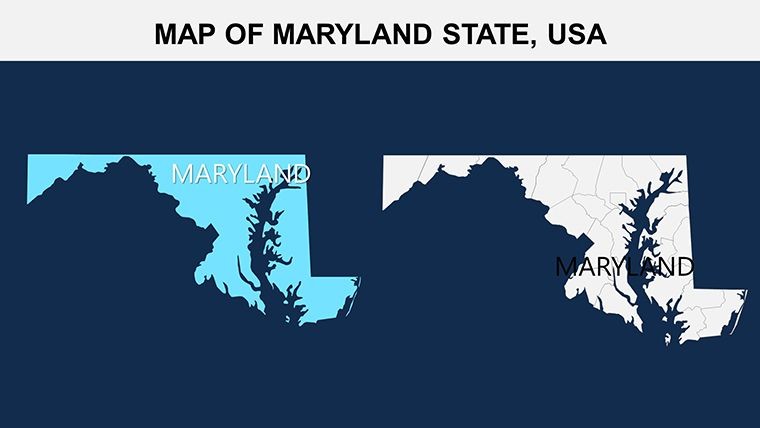
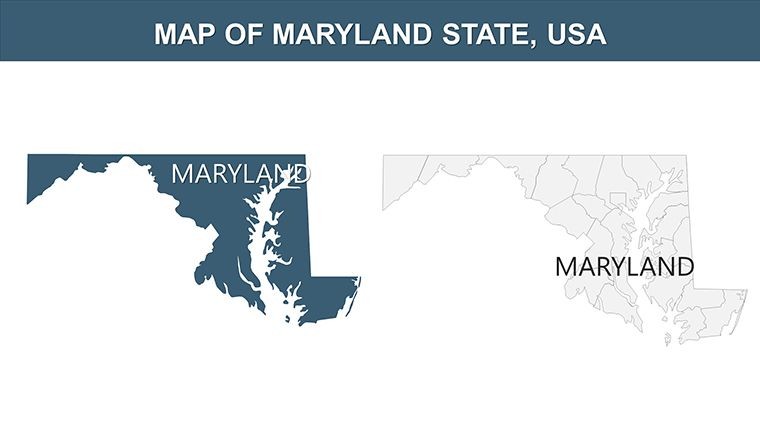
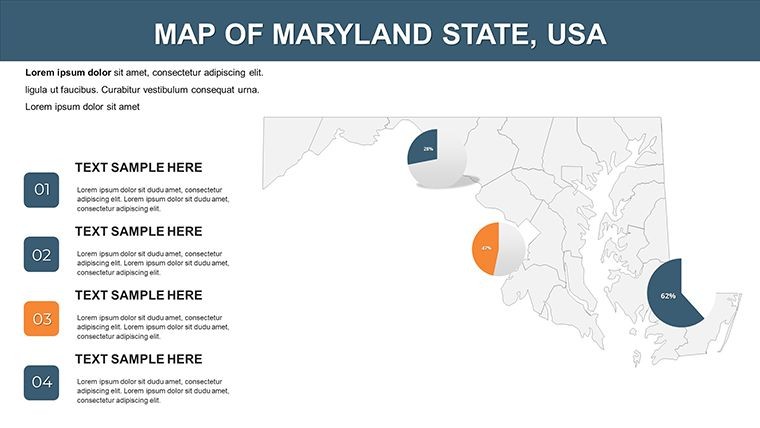
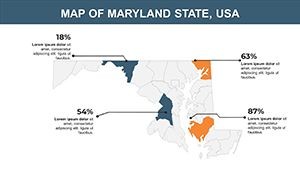
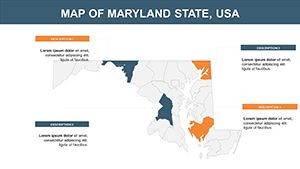
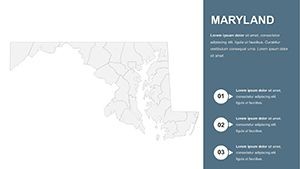
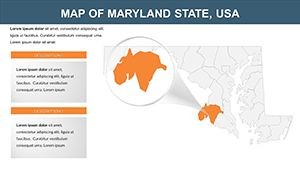
Chart Chesapeake Narratives: Professional Maryland Keynote Map Template


Type: Keynote Maps template
Category: North America
Sources Available: .key
Product ID: KM00113
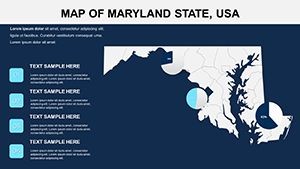
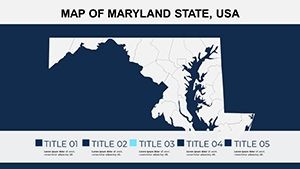
Template incl.: 26 editable slides
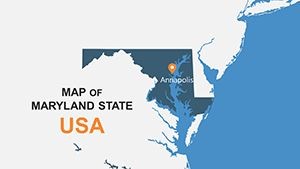
From the sandy beaches of Ocean City to the historic streets of Annapolis, Maryland's blend of coastal allure and Appalachian terrain demands sophisticated visual tools for effective storytelling. Our Professional Maryland Keynote Map Template delivers exactly that, with 26 meticulously crafted, editable slides tailored for Keynote users in architecture, environmental planning, and tourism development. This template empowers you to navigate the complexities of the Chesapeake Bay watershed, aligning with EPA standards for environmental mapping and AIA principles for architectural visualization.
Frustrated by clunky map imports that disrupt your flow? This solution offers vector symbols for seamless stretching and modification, allowing you to overlay development proposals on the Eastern Shore or highlight barrier islands in resilience studies. Aimed at professionals tackling resort expansions or urban infill projects, it features clean animations that unveil layers - like physiographic regions - from fall lines to the Blue Ridge, making your pitches more engaging and persuasive. Integrate it into your workflow to cut design time by half, focusing instead on innovative ideas that resonate with clients and regulators.
Core Features Driving Maryland Map Excellence
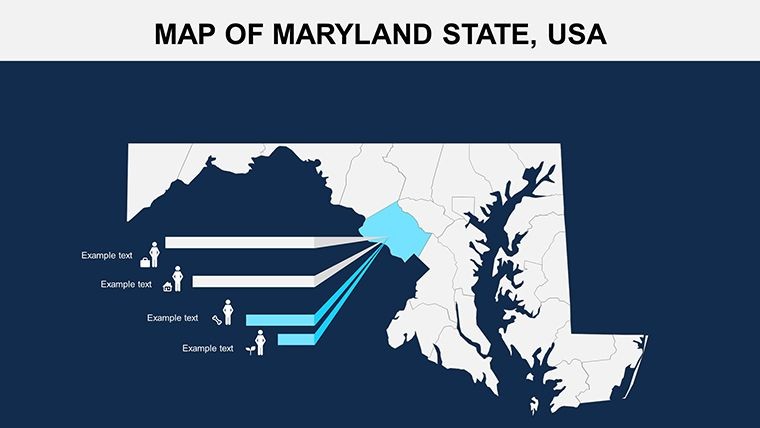
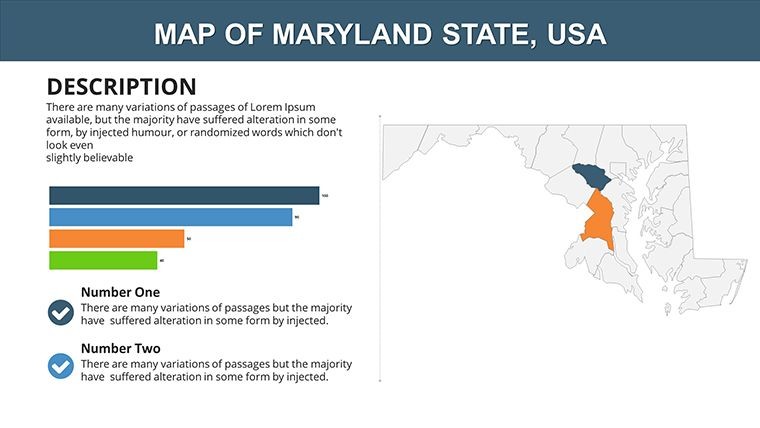
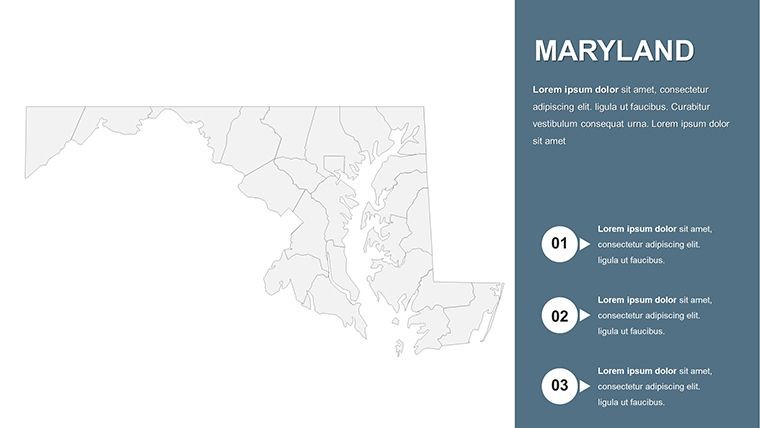
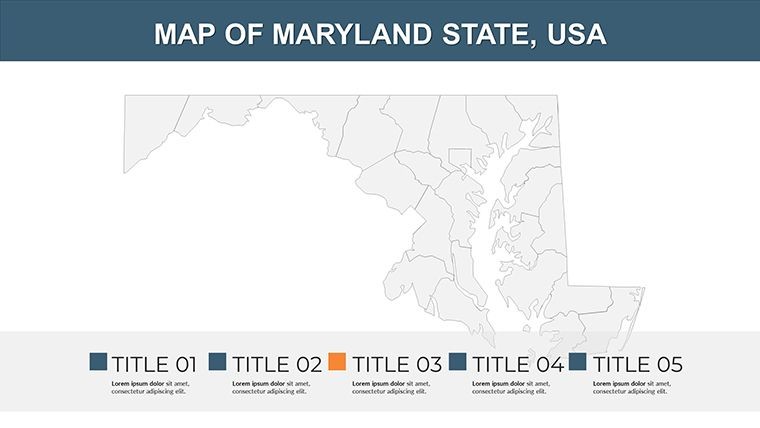
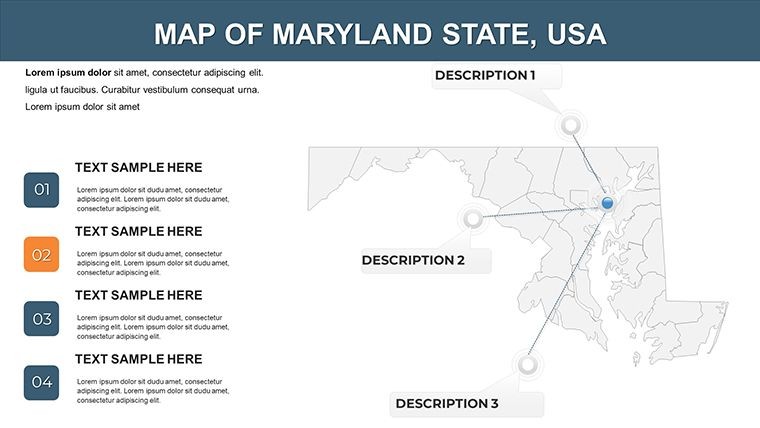
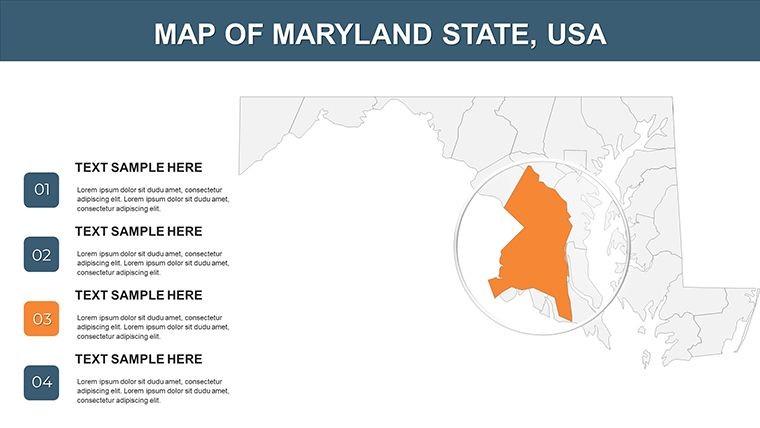
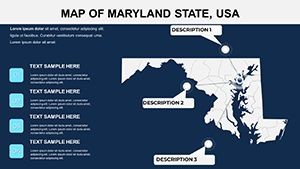
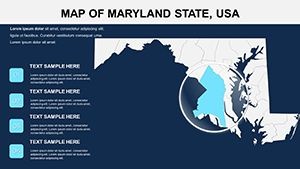
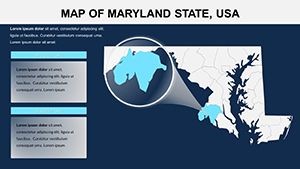
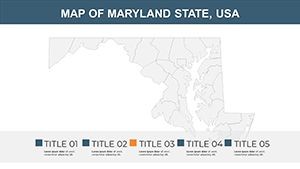
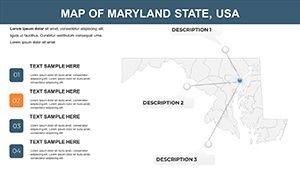
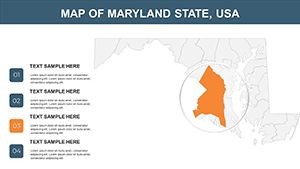
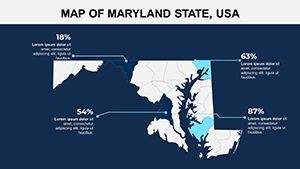
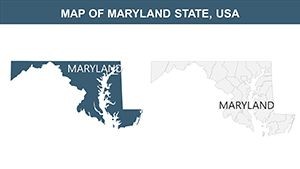
Built for depth and adaptability, this template's features cater to the nuances of Maryland's geography. The primary editable map lets you tweak counties, add symbols for landmarks like the Smithsonian Environmental Research Center, and customize grids for precise topographic representations - vital for hillside architecture assessments.
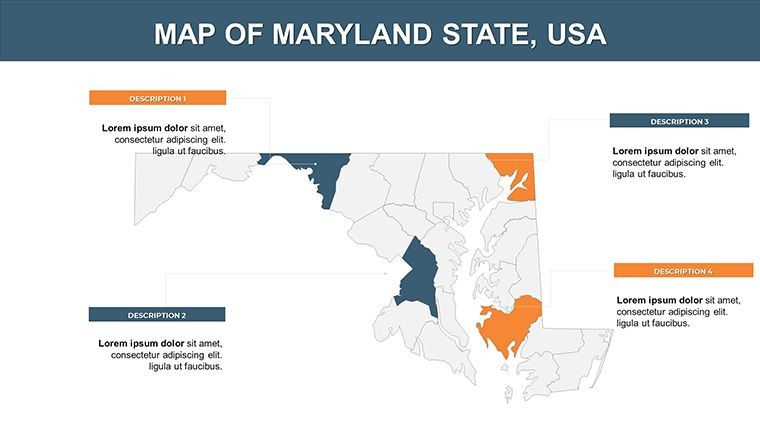
- Vector-Driven Editability: Modify shapes, colors, and fonts without quality degradation; double-click for instant color swaps via the tab, perfect for branding coastal themes.
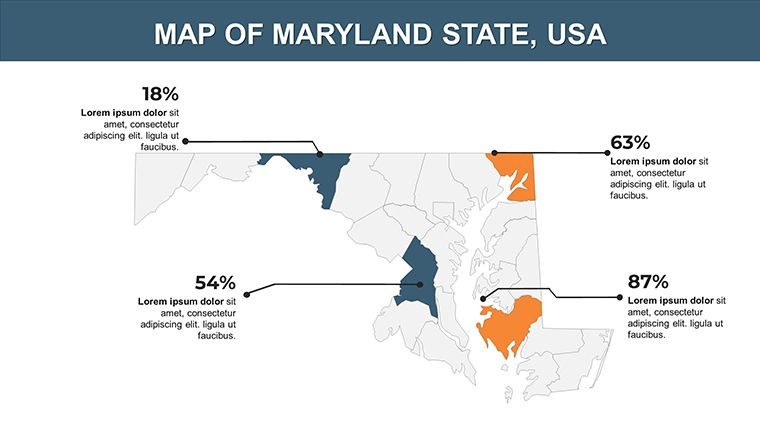
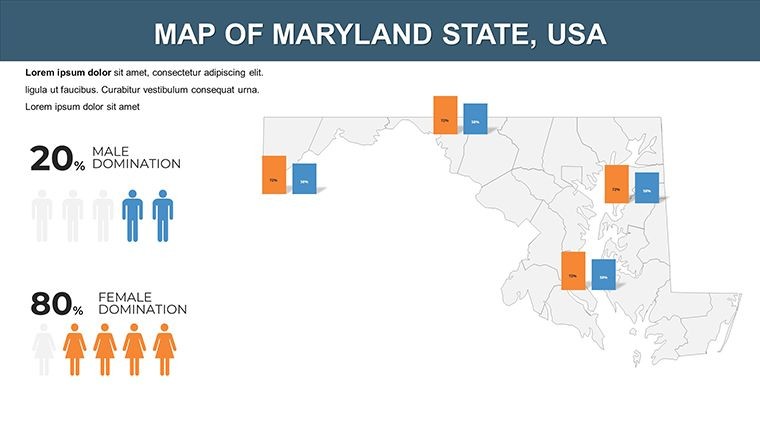
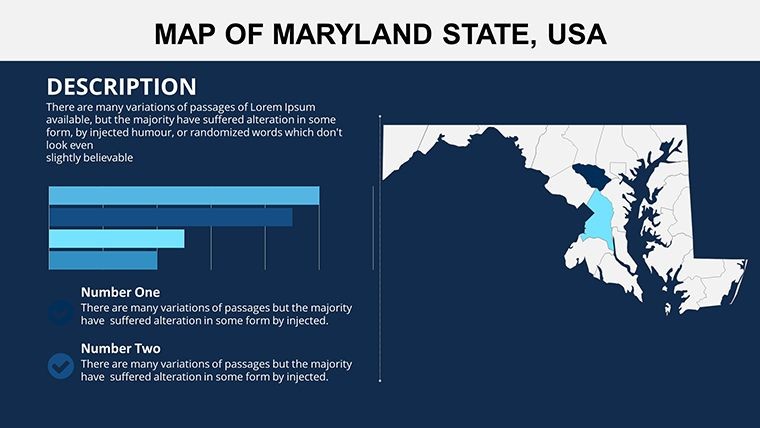
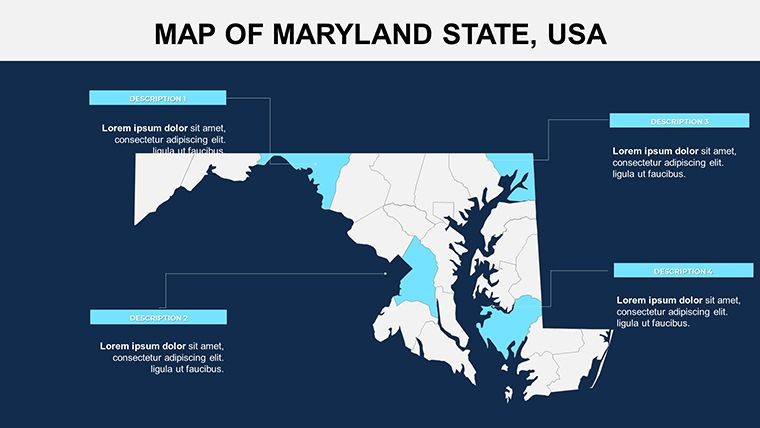
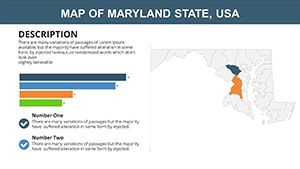
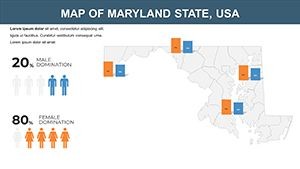
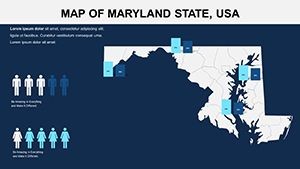
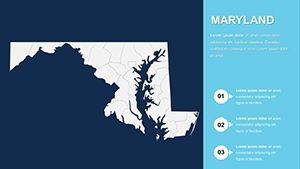
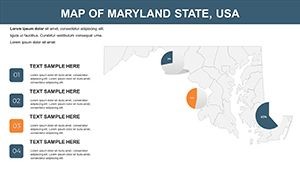
- Slide Diversity: 26 multipurpose layouts including section breaks, innovative timelines for state history, and creative infographics for demographic trends.
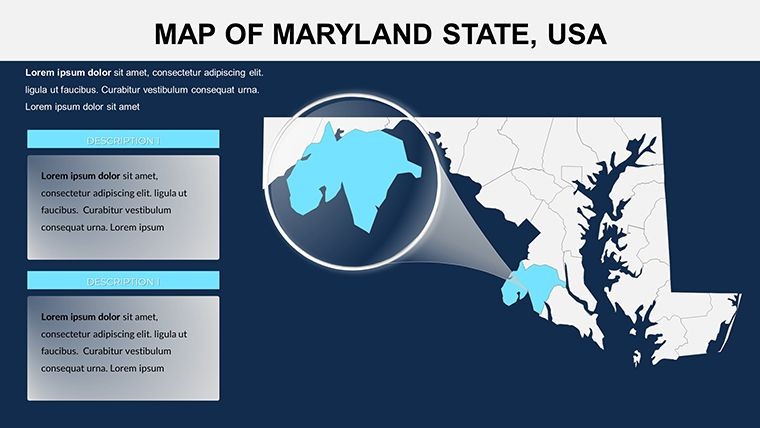
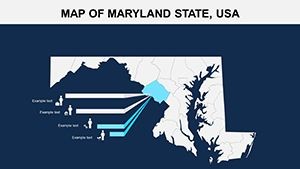
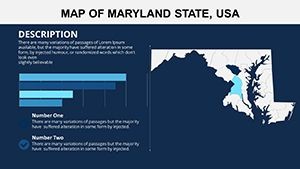
- Animation Enhancements: Custom effects per object, such as sequential reveals of the Piedmont plateau, to guide viewer focus in complex proposals.
- Modern Toolkit: Free fonts, wide-screen compatibility, and a quick guide for effortless setup, ensuring professional output every time.
Standing apart from basic templates, its Keynote optimization supports advanced transitions, outperforming exported formats in speed and fidelity.
Targeted Applications: Architecture Meets Geography
Maryland's dual physiographic zones inspire applications across sectors. Architects use it for Chesapeake Bay restoration pitches, layering water quality data on maps to showcase eco-resorts, akin to projects honored by the Chesapeake Bay Program for innovative design. In urban planning, visualize the fall line's impact on Baltimore's infrastructure, using case studies from the Maryland Historical Society to contextualize growth.
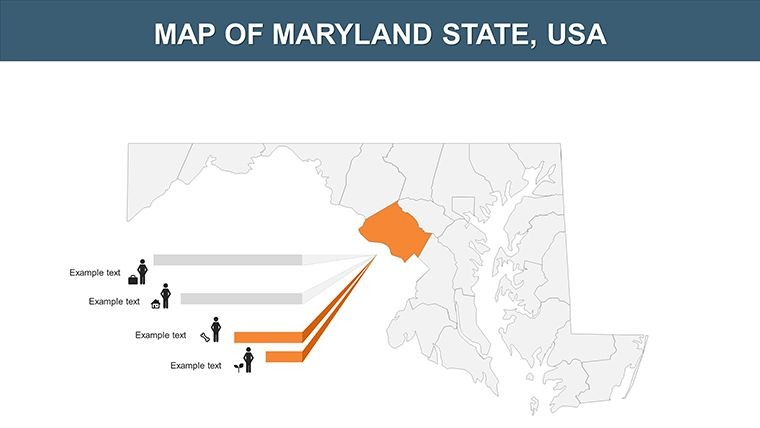
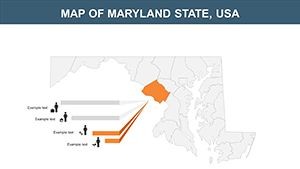
Implement step-by-step: Load the base slide (#3) with USGS topo data, color regions to denote land use - green for parks, blue for bays. On diagram slides (#12), embed flowcharts for transportation networks across the Allegheny Mountains. For tourism, Slide #22's icon set illustrates resort hotspots, incorporating terms like "estuarine modeling" and "elevation profiling" fluidly.
- Resort Development: Map Ocean City's barriers with risk assessments, adding icons for family amenities.
- Environmental Advocacy: Animate conservation zones from the Atlantic Lowlands to the Ridge and Valley, supporting policy decks.
- Heritage Preservation: Timeline slides trace architectural evolution, from colonial sites to modern builds.
Educators at Johns Hopkins apply it for geography courses, enhancing lectures on the largest U.S. estuary with interactive visuals.
Pro Customization Strategies
Unlock full potential by adjusting every aspect: Set master colors to mimic Maryland's fall foliage, add tick marks for axis precision in elevation charts, or annotate for specific escarpments. Workflow hack: Pair with ArcGIS exports for data richness, then animate in Keynote for dynamic reveals - ideal for simulating bay tides in flood modeling.
Design pros recommend opacity layers for multi-depth views, elevating simple maps to immersive experiences. The documentation ensures quick onboarding, transforming novices into confident creators.
Secure Wins in Your Next Presentation
This Maryland template arms you with authoritative visuals that command attention, much like standout entries in AIA Chesapeake Chapter competitions. It's more than editable - it's empowering.
Download today and navigate to presentation success.
Frequently Asked Questions
How do I customize colors in the Maryland Keynote map?
Double-click the shape and select from the color tab for immediate, vector-safe changes.
Is the template suitable for environmental reports?
Yes, with editable layers for data like Chesapeake Bay metrics, compliant with EPA visuals.
What Keynote version is required?
Optimized for 2020+, with guides for earlier versions.
Can it handle detailed topographic data?
Absolutely - grids and tick marks support precise overlays.
Are fonts customizable?
Included free fonts can be swapped for your preferred styles easily.
Does it include animation tutorials?
The quick guide covers basic to advanced animations.