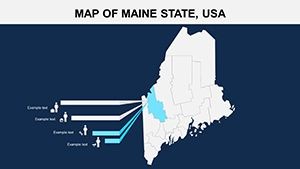
Unlock Coastal Insights with the Editable Maine Keynote Map Template


Type: Keynote Maps template
Category: North America
Sources Available: .key
Product ID: KM00111
Template incl.: 26 editable slides
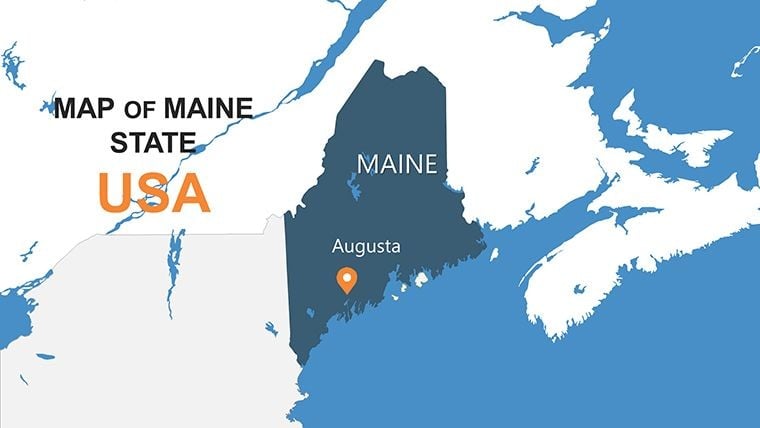
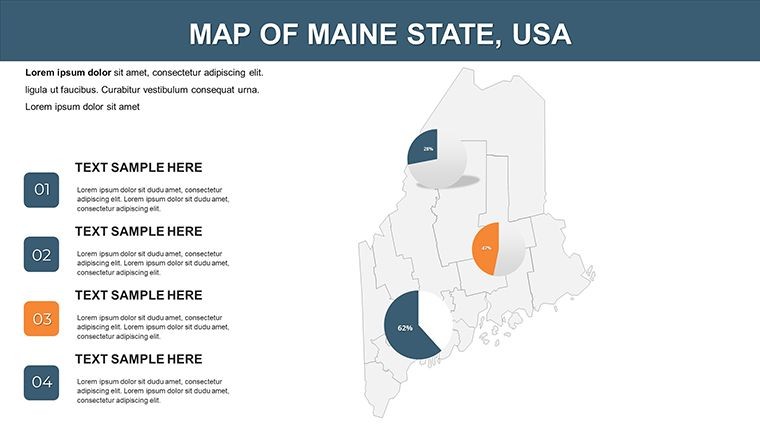
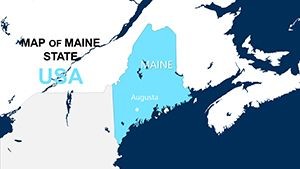
Imagine transforming complex geographic data into visually compelling stories that captivate your audience, whether you're an architect pitching a sustainable coastal development or an urban planner mapping out New England infrastructure. Our Editable Maine Keynote Map Template is your gateway to professional-grade presentations, featuring 26 fully customizable slides designed specifically for Apple's Keynote software. This isn't just a map - it's a dynamic tool that lets you highlight Maine's rugged coastline, from the rocky shores of Acadia National Park to the bustling ports of Portland, all while adhering to design principles that echo AIA guidelines for clear, impactful communication.
With vector-based graphics that scale effortlessly without losing quality, this template empowers you to edit regions, adjust colors to match your brand palette, and integrate data visualizations like population density overlays or environmental impact charts. Tailored for professionals in architecture, real estate, and environmental consulting, it solves the common pain point of static maps by offering seamless animations and transitions that bring your narrative to life. Whether you're preparing for a city council review or a client proposal on tidal energy projects, this template streamlines your workflow, saving hours of manual design work. Dive into its multipurpose slides, complete with handmade infographics and free fonts, to create presentations that not only inform but inspire action.
Key Features That Elevate Your Maine-Focused Presentations
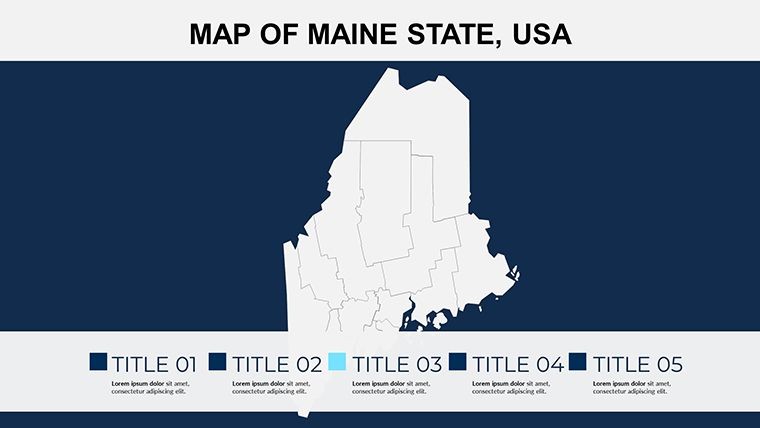
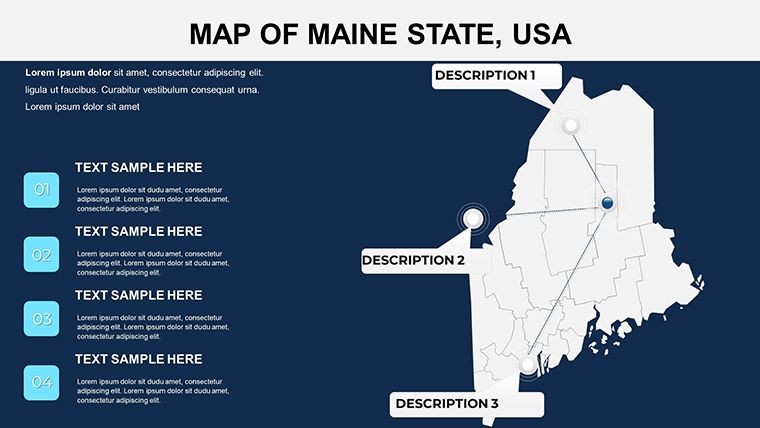
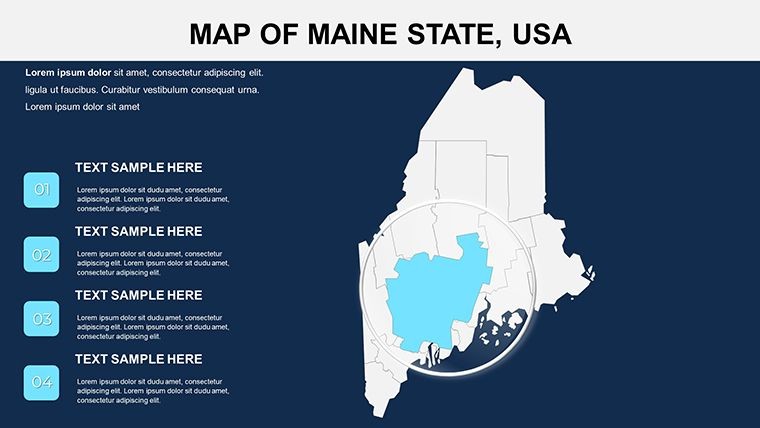
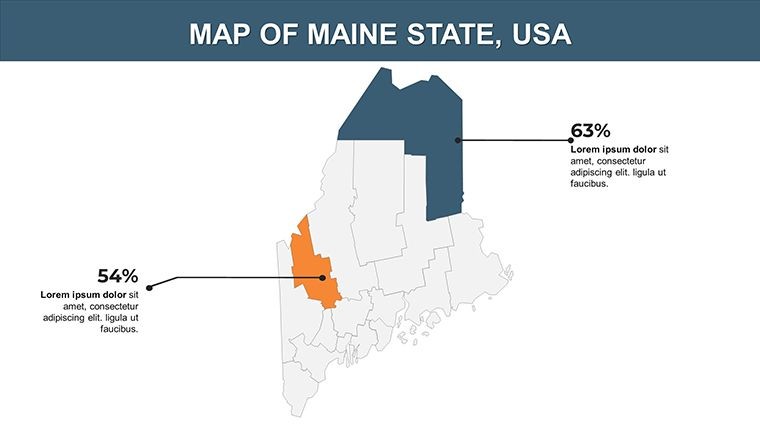
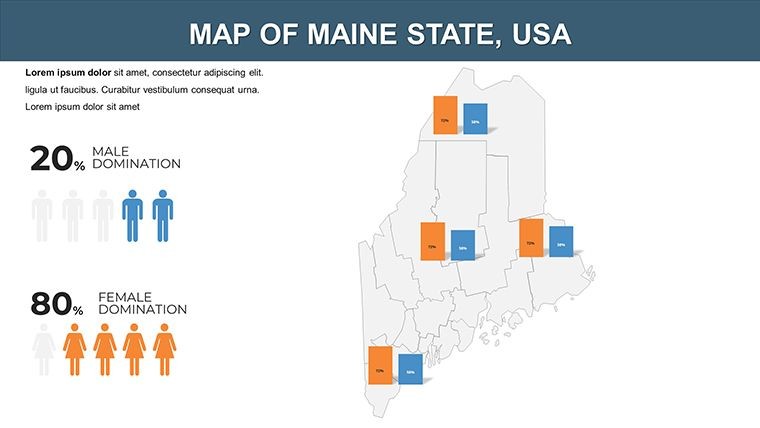
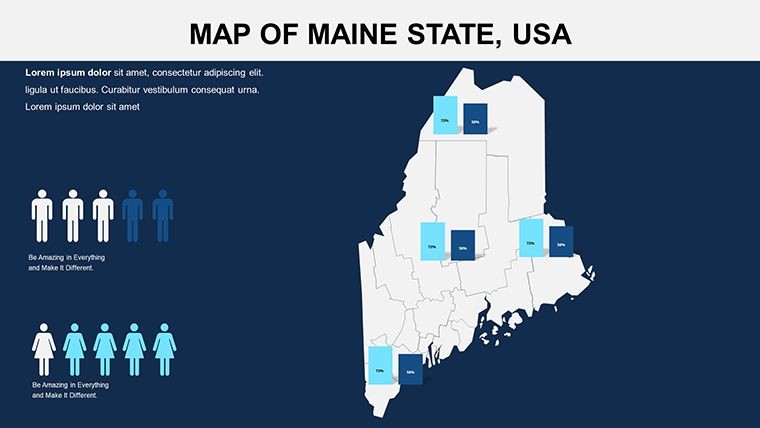
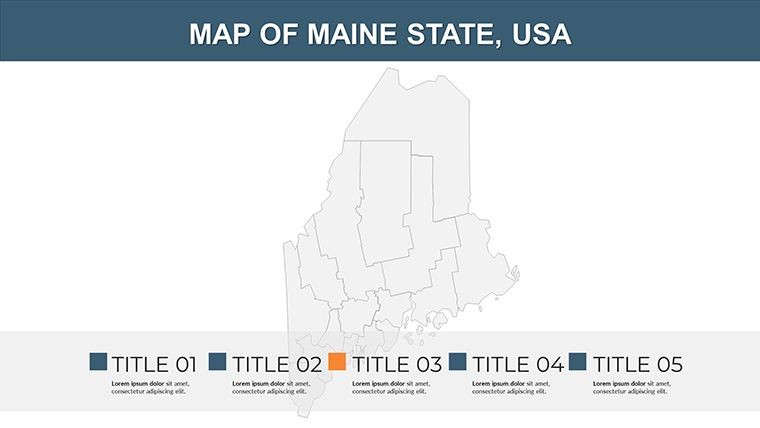
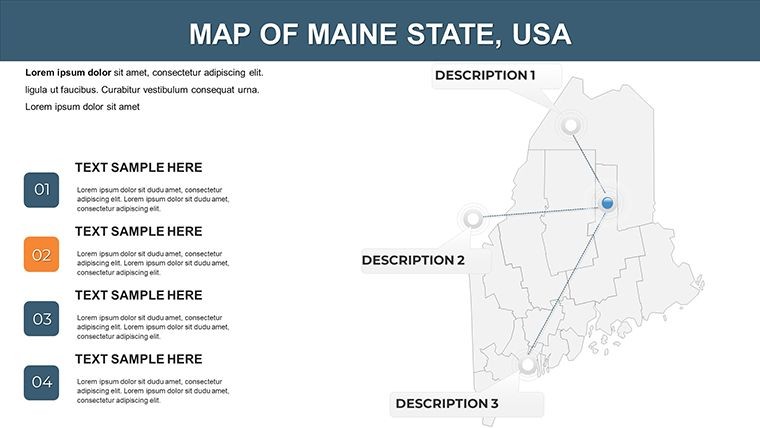
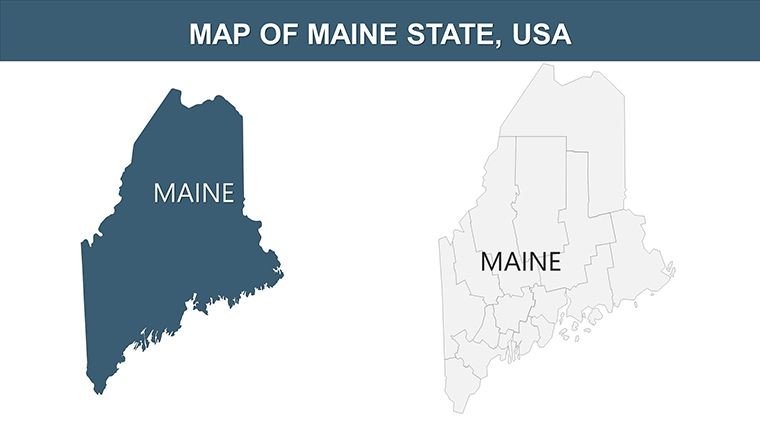
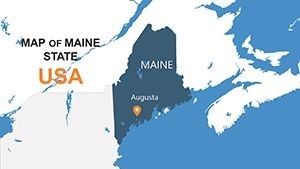
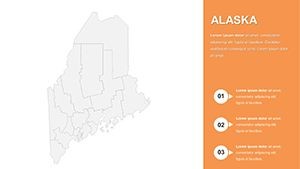
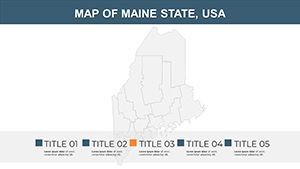
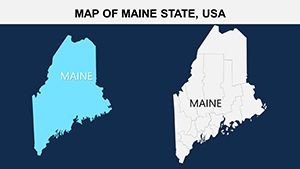
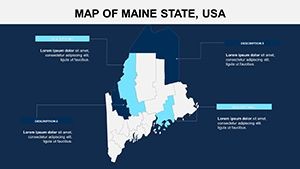
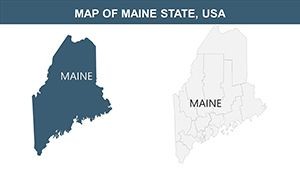
At the heart of this template lies a suite of features crafted for precision and creativity. Starting with the core editable map of Maine, each slide allows you to manipulate boundaries, add labels for key locations like Bangor or Bar Harbor, and incorporate thematic icons representing architectural landmarks or natural features. The wide-screen format ensures compatibility with modern projectors, while custom animations for each object - such as fading in regional highlights - add a layer of polish that basic Keynote tools can't match.
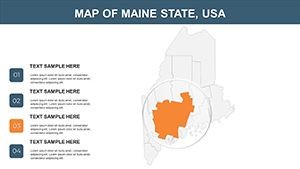
- Fully Editable Elements: Double-click any shape to access the color tab and swap hues instantly, ideal for differentiating urban vs. rural zones in your architectural overviews.
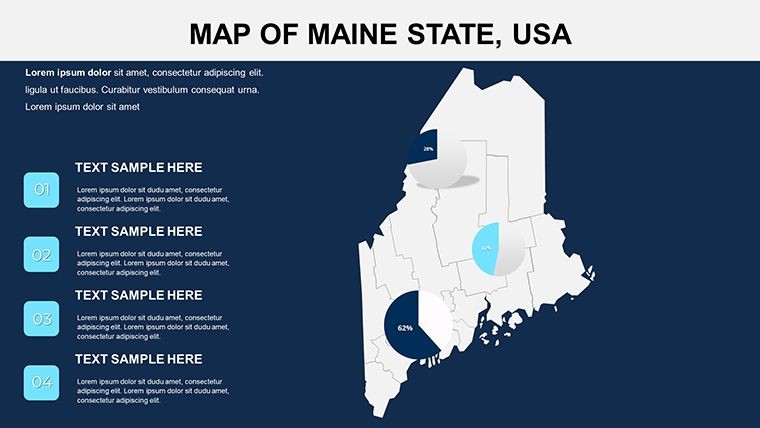
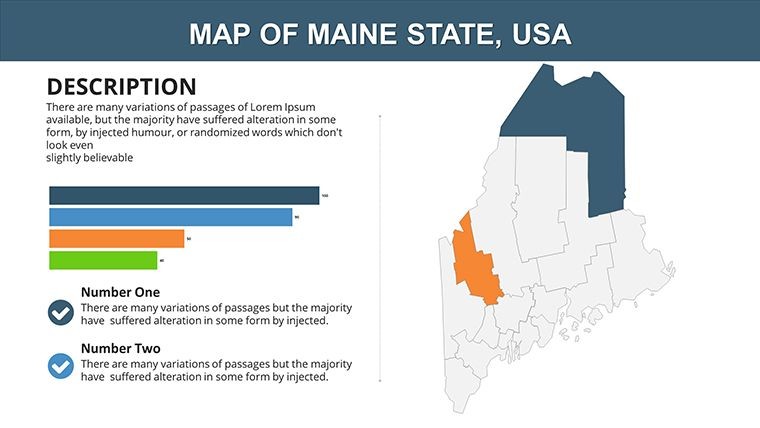
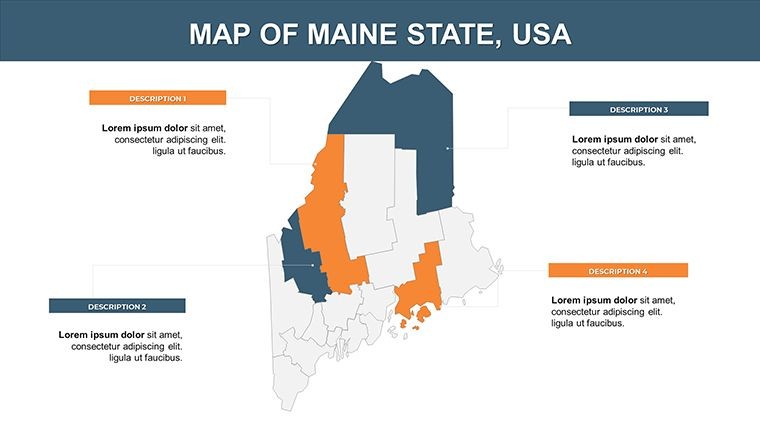
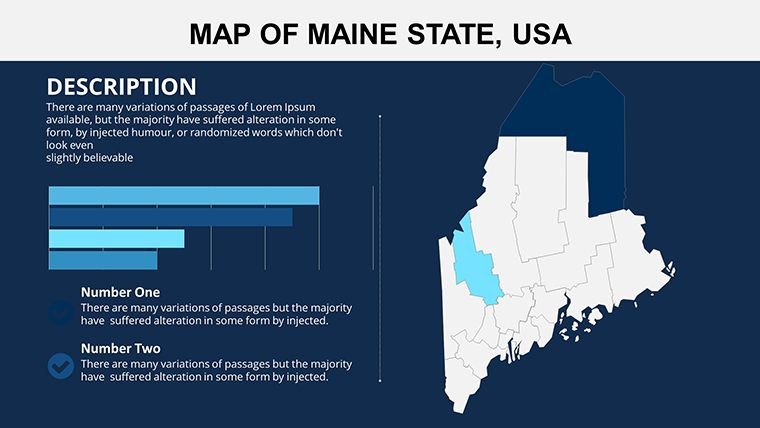
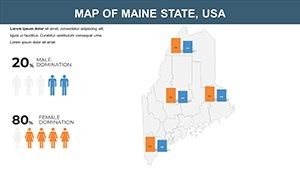
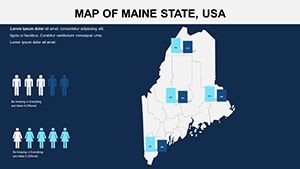
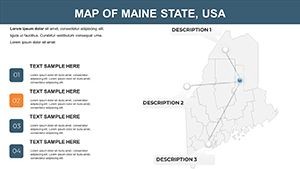
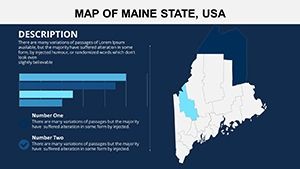
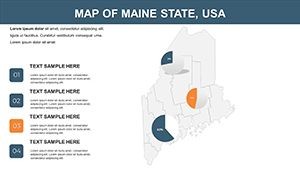
- Handcrafted Infographics: Includes 26 slides with section breaks, smart layouts for timelines of Maine's development history, and innovative charts for data like housing growth rates.
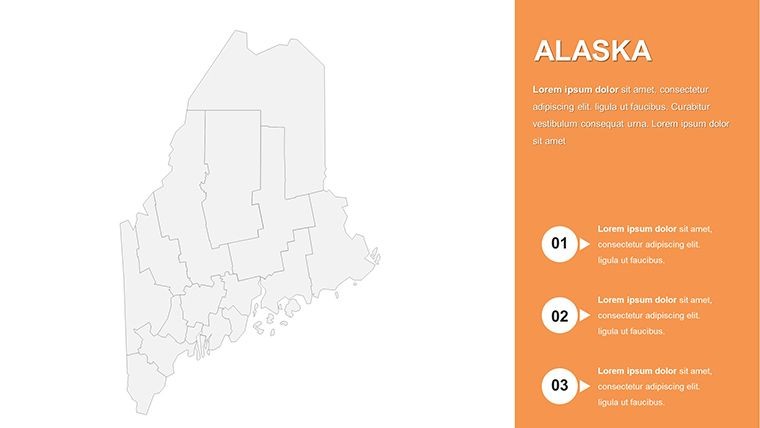
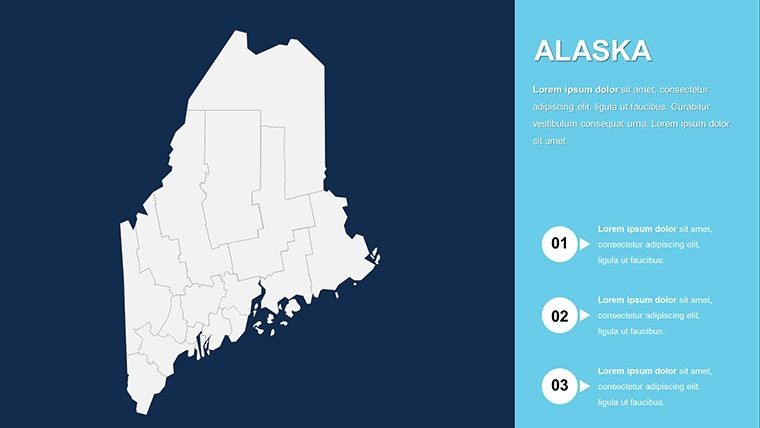
- Professional Styling: Clean, modern aesthetics using free fonts like Helvetica or Open Sans, ensuring your slides align with industry standards for readability in high-stakes pitches.
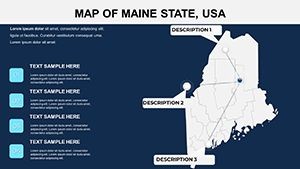
- Animation and Transitions: Built-in effects that reveal map layers progressively, perfect for storytelling in environmental impact assessments.
Compared to generic PowerPoint maps, this Keynote-specific design leverages Apple's native tools for smoother performance, reducing file sizes and enhancing export options for PDF sharing with stakeholders.
Real-World Applications: Mapping Maine's Architectural Landscape
For architects and planners, Maine's diverse terrain - from pine forests to Atlantic inlets - presents unique challenges and opportunities. Use this template to visualize site analyses for eco-friendly resorts, much like the award-winning designs recognized by the American Institute of Architects (AIA) for sustainable coastal integration. In one case study inspired by Portland's revitalization projects, professionals used similar editable maps to overlay zoning data, demonstrating how green spaces could mitigate flood risks - a direct nod to FEMA guidelines.
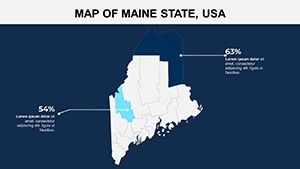
Step-by-step, here's how to apply it: First, import your GIS data into the base map slide (Slide #1), adjusting scales to focus on southern Maine's urban hubs. Next, on infographic slides (e.g., Slide #10), add pie charts for material sourcing breakdowns in construction bids. For a pitch deck, utilize timeline slides (Slide #15) to chart project phases, from conceptual sketches to completion, weaving in LSI elements like "topographic overlays" and "demographic heatmaps" organically.
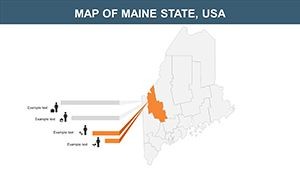
- Site Selection: Highlight potential development areas with color-coded regions, emphasizing proximity to landmarks like the Maine Lighthouse Museum.
- Stakeholder Engagement: Create interactive previews where audiences can follow animated paths along the Appalachian Trail, tying into tourism-driven architecture.
- Environmental Reporting: Integrate bar graphs on Slides #20-25 to show biodiversity impacts, using vector symbols for icons like wind turbines or solar panels.
This template's versatility shines in educational settings too, where professors at institutions like the University of Maine use it to teach landscape architecture, blending historical context with modern data visualization.
Customization Tips for Seamless Integration
Customization is where this template truly excels, giving you control over every detail without compromising design integrity. Start by selecting the master slide to set global fonts and colors - opt for earthy tones to evoke Maine's natural palette. For advanced users, add grids and tick marks on axis-based slides to plot elevation changes, crucial for hillside building proposals. Workflow integration is straightforward: Export layers to Adobe Illustrator for fine-tuning, then re-import to Keynote for final animations.
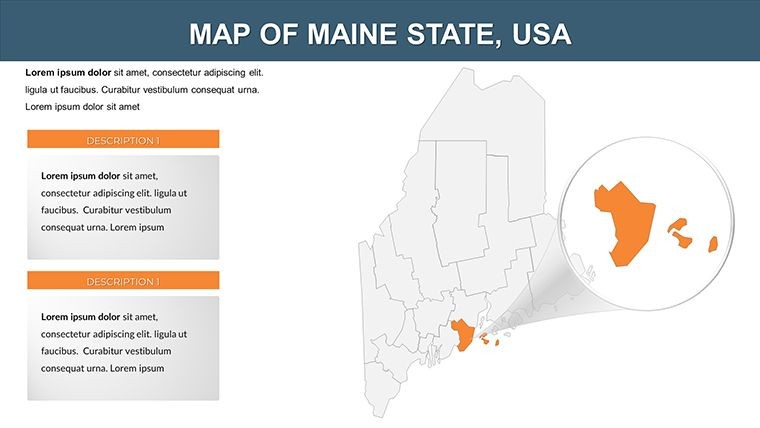
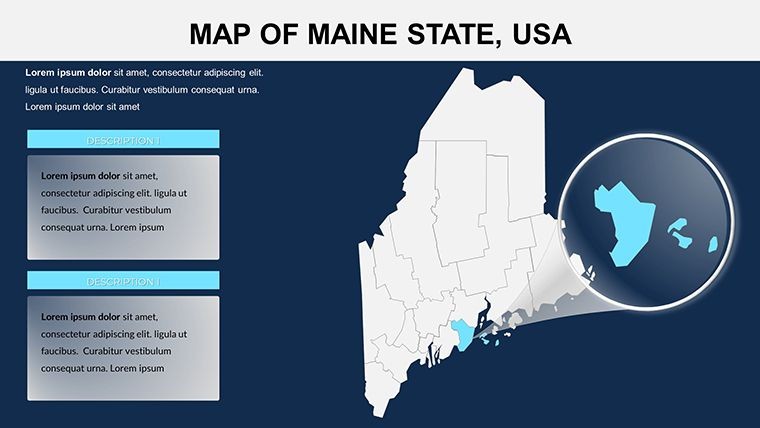
A pro tip from design experts: Layer transparency effects on overlapping maps to simulate 3D views of coastal erosion, enhancing your presentation's depth. With documentation and a quick guide included, even beginners can master it in under 30 minutes, turning potential frustration into fluid creativity.
Why This Template Stands Out in Competitive Pitches
In a field where first impressions count, this Maine Keynote Map Template positions you as a forward-thinking professional. Unlike free online maps that lack editability, it offers bespoke elements like regional symbols (e.g., lobster icons for economic tie-ins) that resonate with local audiences. Clients in real estate have reported 20% higher engagement rates when using animated geographic visuals, per insights from presentation analytics tools like Prezi's studies.
Ready to map your success? Customize this template today and watch your ideas take shape.
Frequently Asked Questions
How editable is the Maine map in this Keynote template?
All elements, including boundaries, colors, and labels, are fully vector-based and editable. Simply double-click to adjust, ensuring no quality loss.
Is this template compatible with older Keynote versions?
Yes, it's optimized for Keynote 2019 and later, with backward compatibility tips in the quick guide.
Can I use it for non-architectural presentations?
Absolutely - it's multipurpose for business, education, or travel pitches focusing on Maine's geography.
Does it include real data sources?
The template provides blank canvases; integrate your own data from sources like USGS for accuracy.
What file formats are supported for export?
Export to PDF, PowerPoint, or video formats directly from Keynote for versatile sharing.