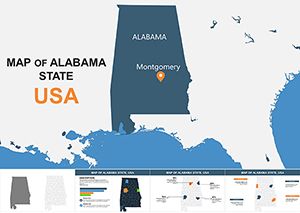
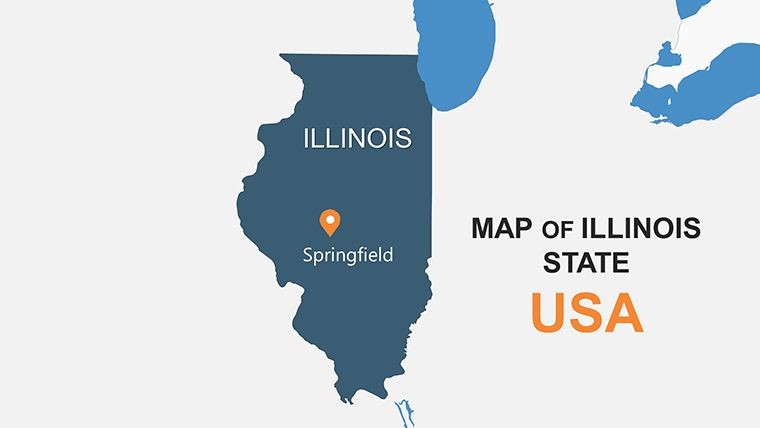
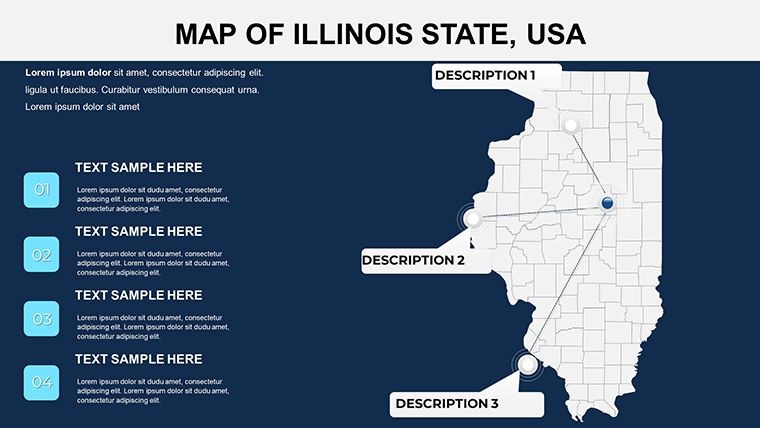
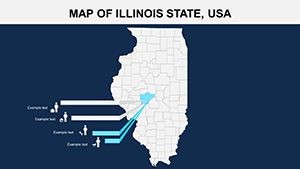
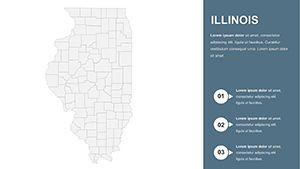
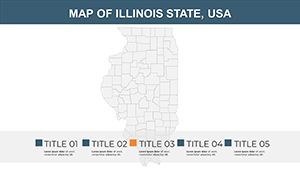
Illinois Map Keynote Template - Fully Editable


Type: Keynote Maps template
Category: North America
Sources Available: .key
Product ID: KM00105
Template incl.: 26 editable slides
What is a Keynote map template? A Keynote map template is a .key file containing pre-built, vector-based geographic slides that open in Apple Keynote and allow counties, cities, and region labels to be edited, recolored, and annotated without any external design software.
Package Contents
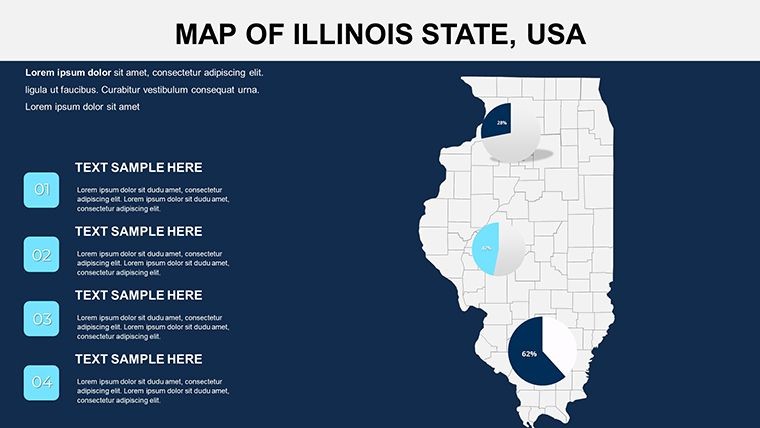
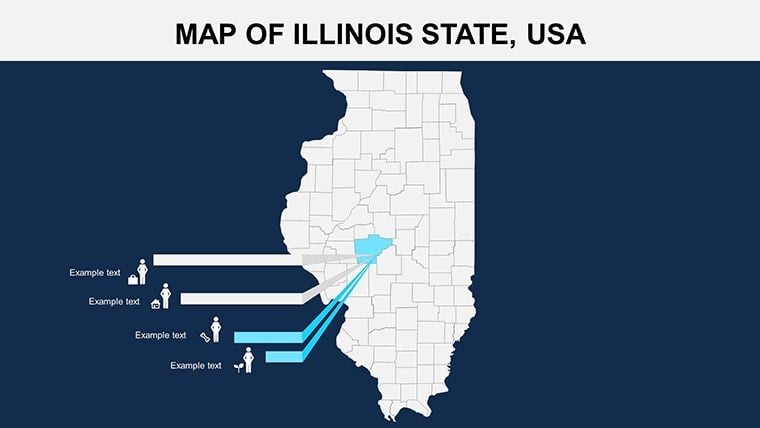
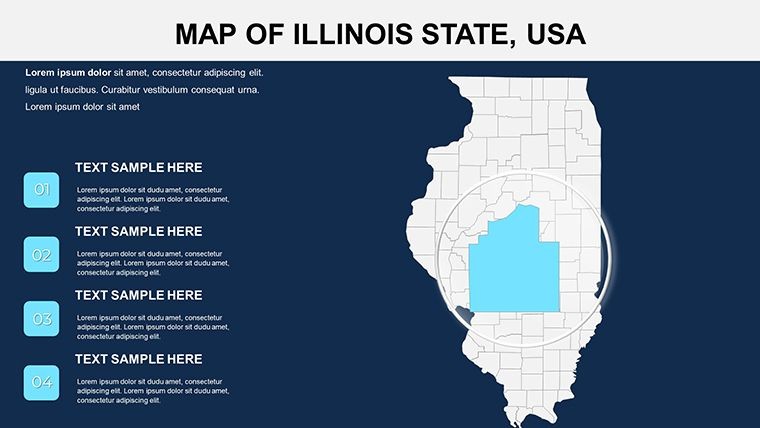
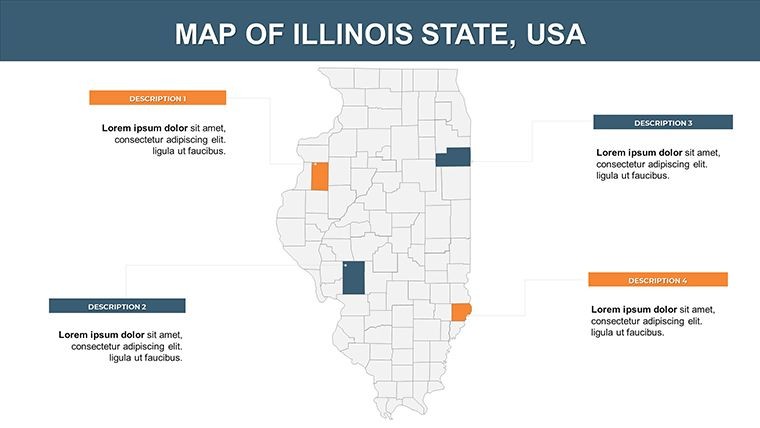
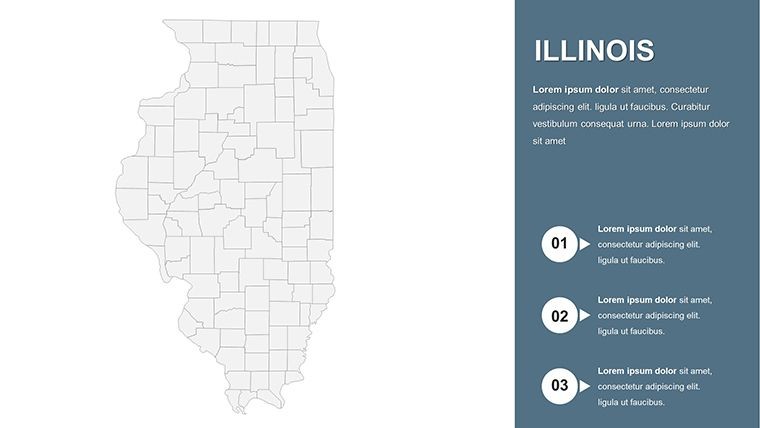
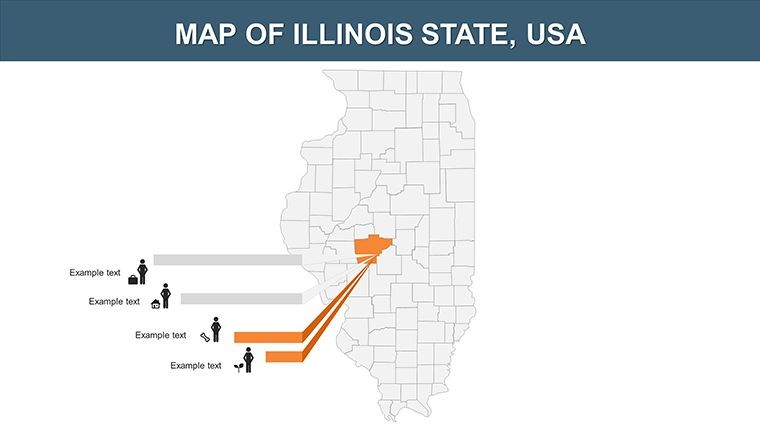
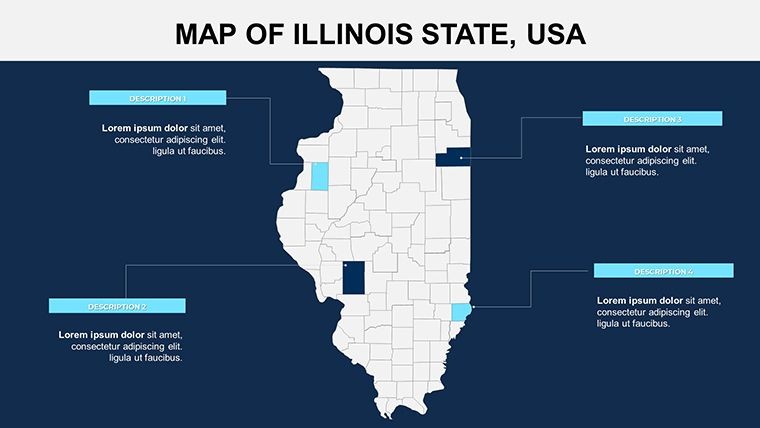
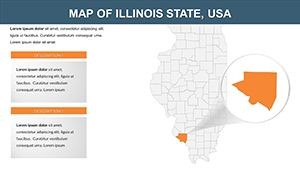
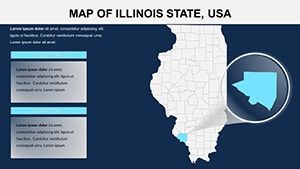
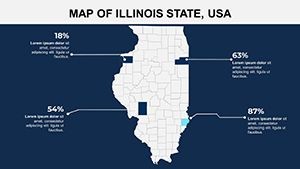
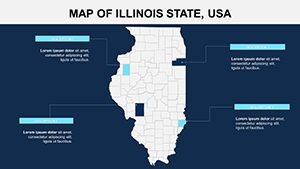
26 editable slides ship in a single .key file, structured to cover Illinois from a full-state outline down through county-level boundaries, urban-focus insets for Chicago and its surrounding metropolitan counties, and thematic slides suitable for overlaying data on specific regions. Illinois has 102 counties - each major regional grouping appears as an independently selectable vector cluster, with Chicago's Cook County and its bordering counties receiving dedicated high-detail slides.
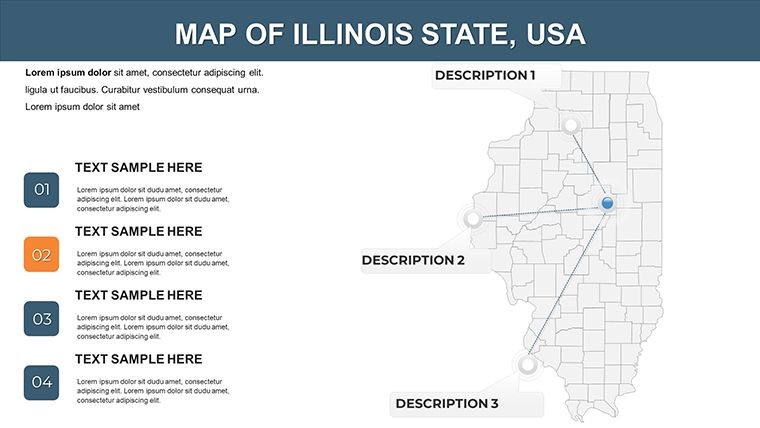
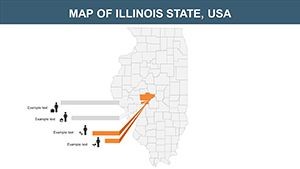
The slides function as a presentation system rather than a collection of static images. A logistics analyst can open with the full-state overview, cut to a multi-county regional slide for the Illinois River Valley, and close on a Chicago metropolitan inset - all from a single file, with no slide imports from external sources. Each vector shape is grouped by county, so adding a fill color to Will County does not disturb adjacent Kane or DuPage.
Multi-state US map sets typically allocate one or two slides to Illinois, placing Chicago in a thumbnail that cannot support labeled data overlays. The 26-slide structure of this file means a presenter can argue at county resolution - which matters for territory management, logistics routing, healthcare planning, or electoral analysis where the difference between Cook, Lake, and McHenry counties is the entire argument.
Technical Specs
| Feature | Details |
|---|---|
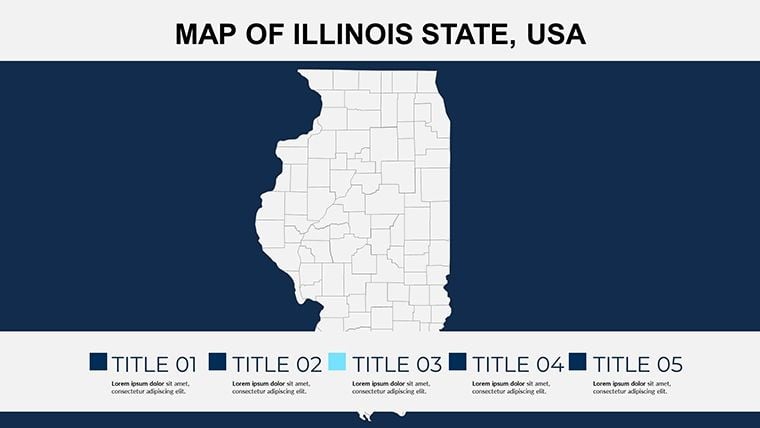
| Editable county regions | All Illinois counties are separate vector groups - click to select and recolor independently without ungrouping |
| City and county labels | Editable text boxes throughout; double-click to update names, data values, or annotations |
| File format | .key - opens in Keynote 12 or later on macOS; compatible with iPadOS Keynote (2021 onward) |
| Aspect ratio | 16:9 widescreen, standard for projection and widescreen display |
| Color scheme adjustments | Edit Master Slide applies brand palette globally; per-shape fills in Format sidebar for individual county overrides |
| Export options | .key for editing, PDF for print and distribution, PNG/JPEG for embedding in reports |
| Animation support | No animations pre-applied; all Keynote built-in transitions are compatible with every vector shape |
| Editing difficulty | Beginner - Keynote is the only software required |
Typical Use Cases by Role
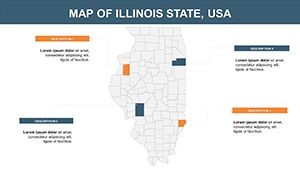
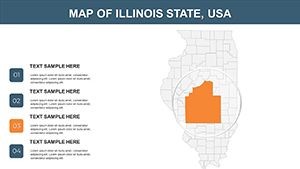
A regional sales director at a Chicago-based distribution company needed to present territory assignments across northern Illinois counties to a quarterly strategy meeting. Using the county-level slides, she color-coded each sales rep's coverage zone, added district revenue labels directly onto the county shapes, and produced a deck section in under an hour. The same file was reused across four consecutive quarterly briefings by updating label data only, with no structural changes to the slides.
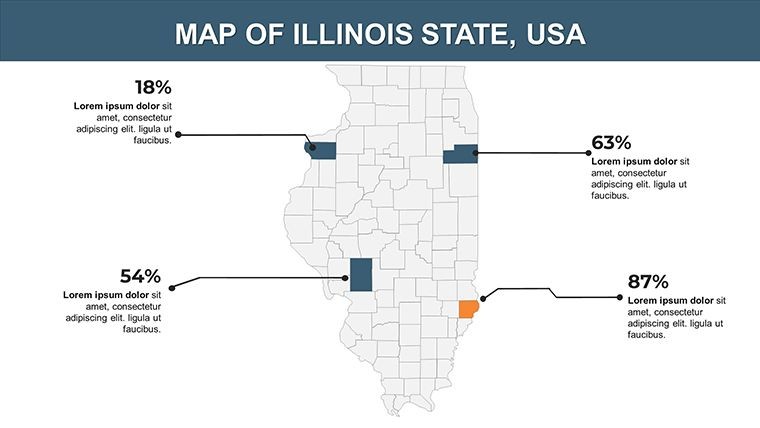
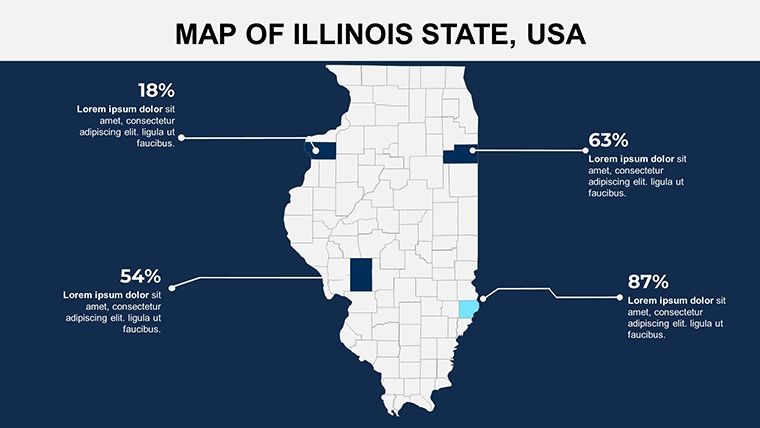
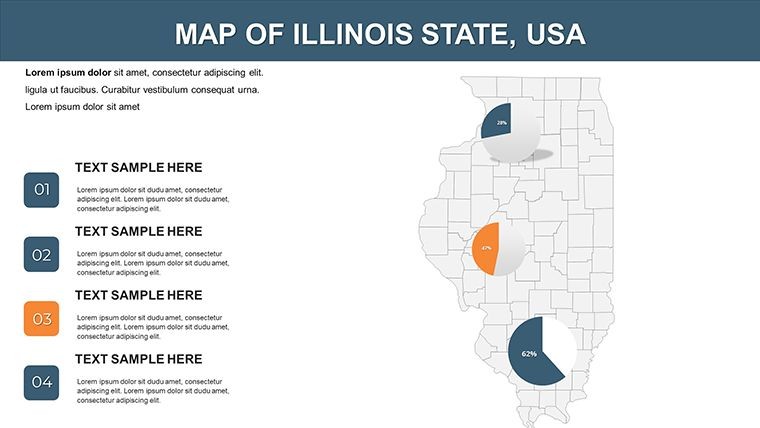
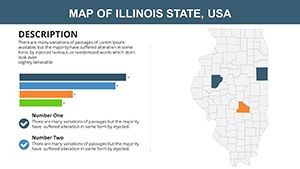
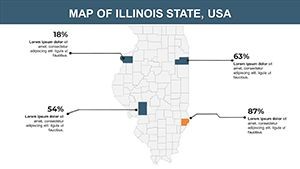
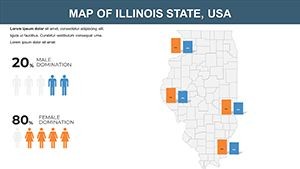
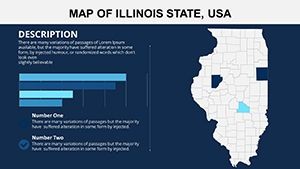
A public health analyst at an Illinois state agency preparing a county-level disease prevalence report for an internal briefing used the full-state county grid to overlay incidence rates using a color gradient - lighter fills for low prevalence, darker for high. The vector precision allowed the gradient fills to align cleanly with county boundaries at both screen and projection sizes, producing a slide that communicated the geographic pattern more directly than a data table would have.
Download and start editing immediately - the .key file opens in Keynote 12 or later with no plugins required.
How to Make It Yours in Under 20 Minutes
Editing difficulty: Beginner. No design software other than Keynote is needed.
- Step 1 - Open the .key file in Keynote 12 or later on macOS or iPadOS (1 minute)
- Step 2 - Select the slide matching your coverage need - full state, county grid, regional cluster, or Chicago metro inset (1 minute)
- Step 3 - Click a county shape to select its vector group, then apply a fill color via the Format sidebar (2 minutes)
- Step 4 - Double-click any label to replace the text with your own county name annotation, territory label, or data value (3 minutes)
- Step 5 - Update brand colors globally via View > Edit Master Slide, propagating changes across all 26 slides at once (2 minutes)
- Step 6 - Export as PDF for distribution or retain as .key for live presenting (1 minute)
The master slide update in Step 5 is the most impactful single action in the workflow. One change to the master updates background color, accent tones, and typography across all 26 slides simultaneously - critical when a team needs to rebrand the file for a different client or internal department without touching individual slides.
The Cost of Not Using a Template
Building a single Illinois county map from scratch in Keynote requires sourcing a correctly projected vector file, importing it as an SVG or EPS, verifying that all 102 county boundaries match current administrative definitions, and constructing a label system that handles the density of northeastern Illinois - where Cook, DuPage, Kane, Lake, McHenry, and Will counties cluster in a small geographic area. An experienced designer spends two to three hours on a single usable slide. 26 slides at that rate is a multi-day project.
The label density problem in northeastern Illinois is the most consistent failure in manual builds. At the zoom level that shows the full state, Cook County's label competes visually with five adjacent counties of similar size. This file spaces labels at the geographic centroid of each county and adjusts font size downward for the northeastern cluster, a decision made at design time that a presenter building under deadline will almost certainly skip, resulting in an illegible slide during the meeting.
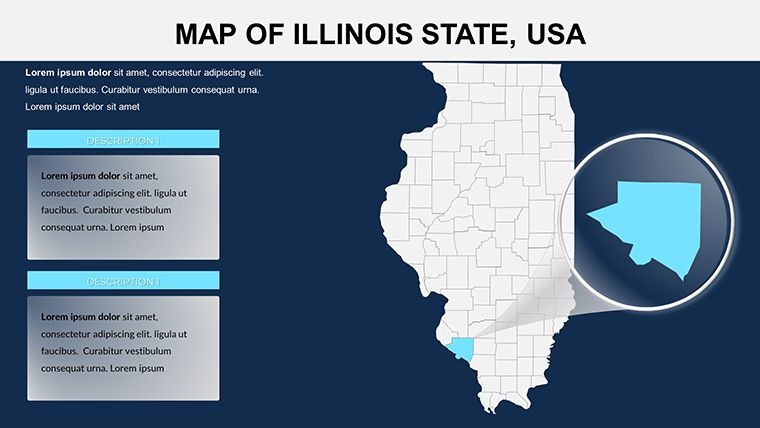
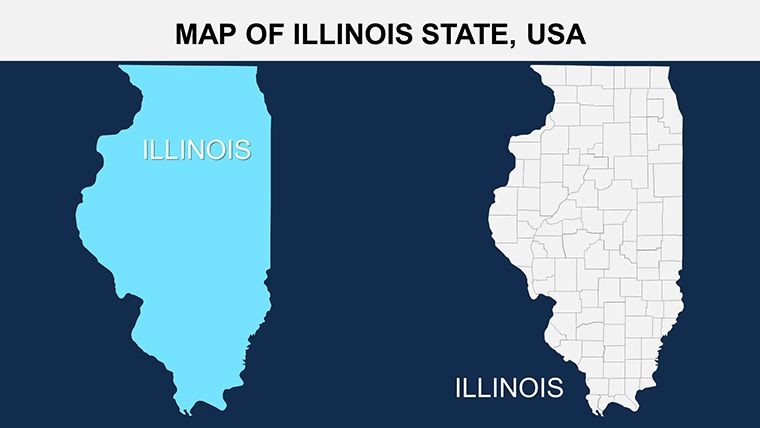
Two design observations that reflect deliberate choices: county boundaries use a slightly heavier stroke weight than the state outline on regional slides, which helps audiences distinguish administrative borders from geographic context at projection distance. And Chicago-focused inset slides use a white vignette border to visually separate the metro area from the surrounding county grid, guiding the audience's attention without requiring a separate pointer or laser during the presentation.
Teams building Midwest regional decks frequently pair Illinois county coverage with adjacent state files - the Arizona editable map set and the Arkansas county map template are common additions for multi-state territory analyses. For full US state-level coverage in a single file, the North America Keynote Maps category contains the complete library organized by region.
Download the 26-slide Illinois .key file now and have your first county map slide ready in under 10 minutes.
Which version of Keynote is required to open this template?
The .key file requires Keynote 12 or later, available as a free download from the Mac App Store on macOS Monterey and later. iPadOS versions of Keynote released in 2021 or later also open the file without compatibility issues. Older Keynote versions included with macOS Catalina or High Sierra may not render the vector groups correctly. If your system has not been updated recently, open the App Store, update Keynote, and then download the template. No third-party fonts, plugins, or add-ons are required.
How do I apply my organization's brand colors to the template?
Open the .key file in Keynote, go to View > Edit Master Slide, and update the background and accent colors using the color picker with your brand hex or RGB values. This applies the change globally to all 26 slides simultaneously. For county-level overrides - for example, highlighting your sales territory in a specific brand color - click the county shape on the relevant slide and change its fill in the Format sidebar. The two-level approach, master for global style and per-shape for specific emphasis, takes under five minutes for the full deck.
What does the license permit - can I use this in paid client work?
The standard license covers internal business presentations and client-facing work where the map slides are part of a delivered professional service - consulting decks, agency reports, government briefings, and similar deliverables. Reselling the .key file itself, sublicensing it, or distributing it as a downloadable product is not permitted. For use cases outside standard presentation delivery - such as incorporating map slides into a sold training video - contact ImagineLayout support before purchasing to confirm that your specific use is covered.
Is there a free version of this template?
The product page does not list a free version for this template. The full 26-slide .key file is available for a one-time purchase of $15. The gallery on the product page shows all slide layouts in preview, so you can evaluate the coverage levels, label density, and visual style before completing the purchase. ImagineLayout's refund conditions are published at imaginelayout.com/refund-policy - review those terms if you have any concerns about compatibility before buying.
Can I add animations to reveal counties one by one?
Yes. No animations are pre-applied - the slides are delivered as clean static layouts, so there is nothing to remove if you do not want animation. To add a sequential county reveal, click the county shapes you want to animate, open the Animate panel in Keynote, choose a Build In effect such as Appear or Fade, and set each shape to trigger on click or after a delay. This approach works well for territory walkthrough presentations and logistics routing discussions where showing regions progressively clarifies the argument better than revealing everything at once.
Can this file be exported to PowerPoint format?
Keynote exports .key files to .pptx format via File > Export To > PowerPoint. Most vector shapes and text labels transfer correctly, but Keynote-specific layout behaviors - such as grouped vector hierarchies and certain transition types - may not render identically in PowerPoint 2016, 2019, or Microsoft 365 on Windows. Test the exported file on the target machine before the presentation date. If PowerPoint is the primary delivery format, ImagineLayout's PowerPoint maps category contains Illinois and other state-level files built natively for PowerPoint.