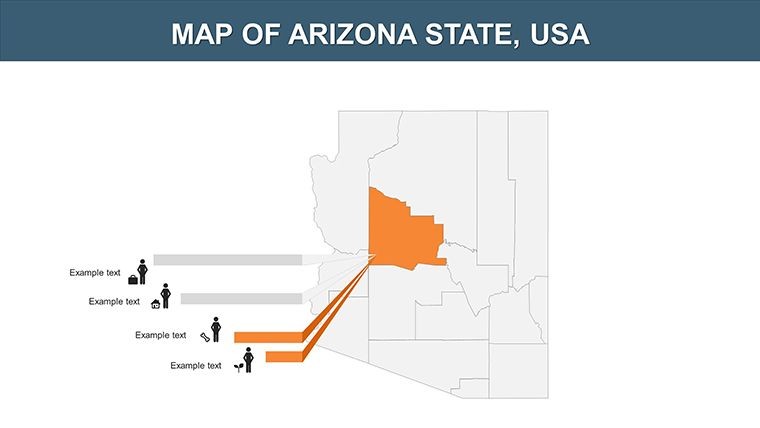
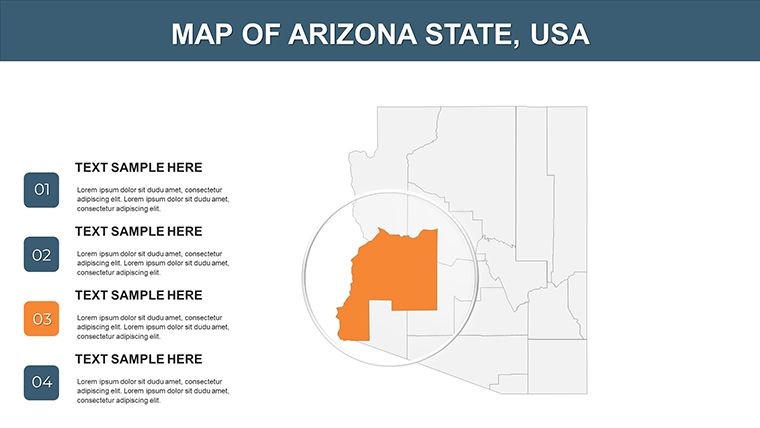
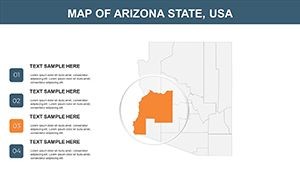
Arizona Map Keynote Template - Fully Editable


Type: Keynote Maps template
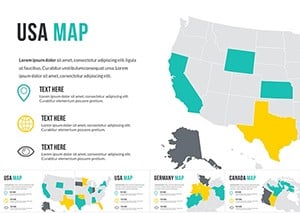
Category: North America
Sources Available: .key
Product ID: KM00092
Template incl.: 24 editable slides
What is a Keynote map template? A Keynote map template is a .key file containing pre-built vector map slides that open directly in Apple Keynote, allowing regions, labels, and fills to be edited without any external design software.
26 Slides, Multiple Coverage Zones: Full Contents
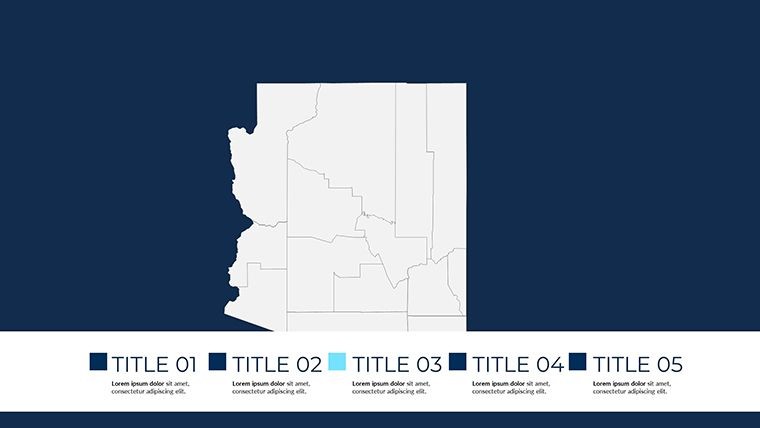
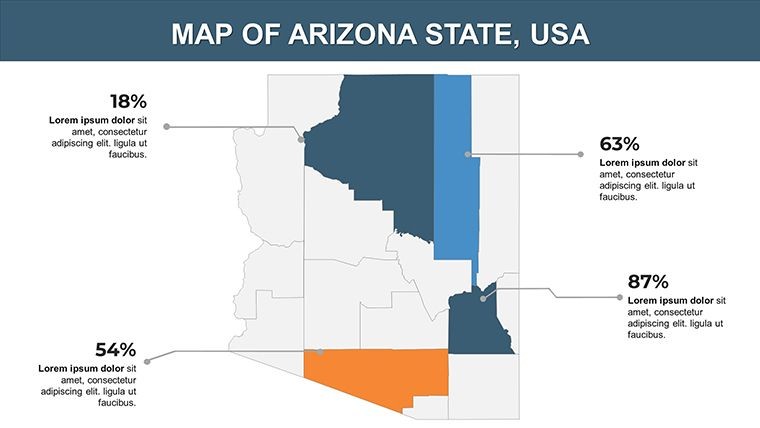
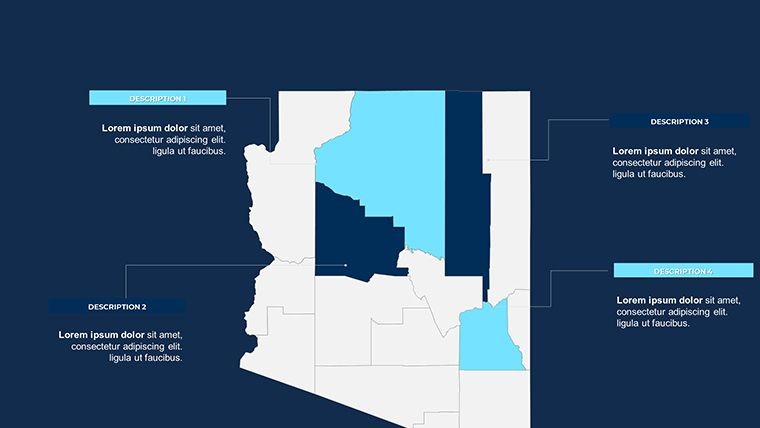
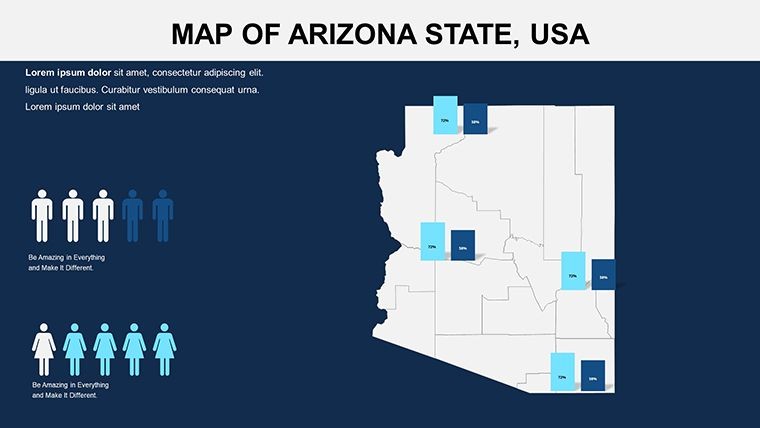
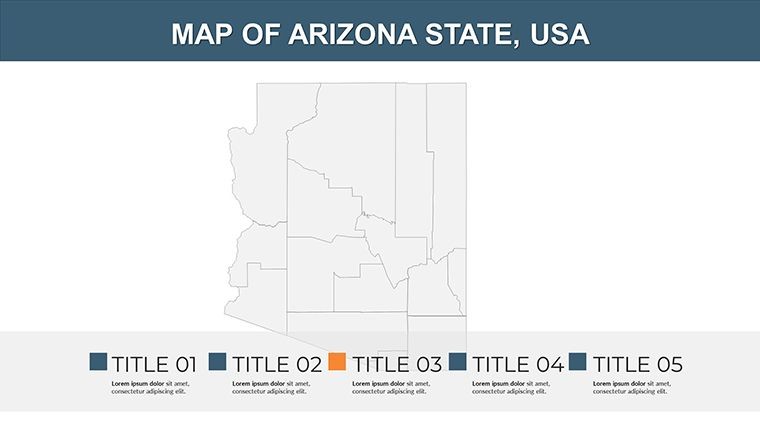
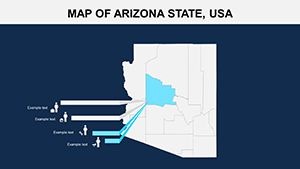
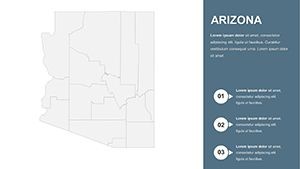
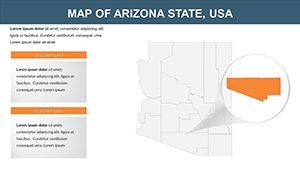
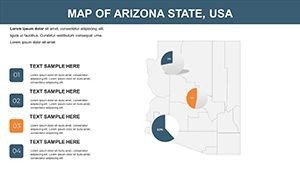
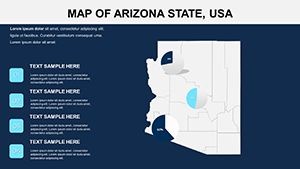
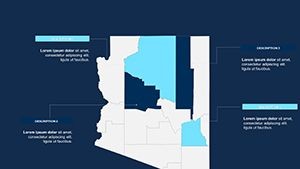
24 editable slides ship in a single .key file, structured to move from Arizona's full state outline down through county boundaries to urban-focused insets for Phoenix, Tucson, and Flagstaff. The 15 counties - including Maricopa, Pima, Yavapai, Coconino, and Mohave - each appear as independently selectable vector groups, so highlighting one county does not require unlocking or editing neighboring shapes.
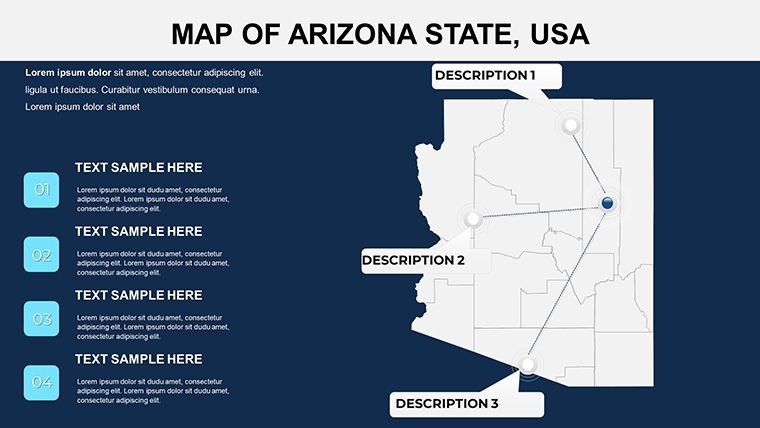
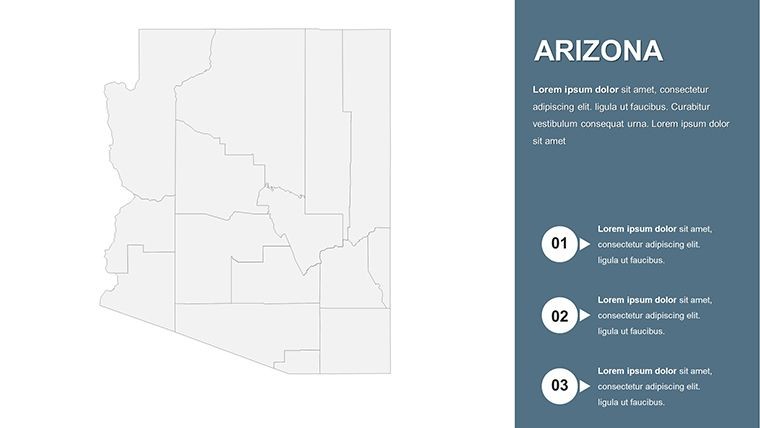
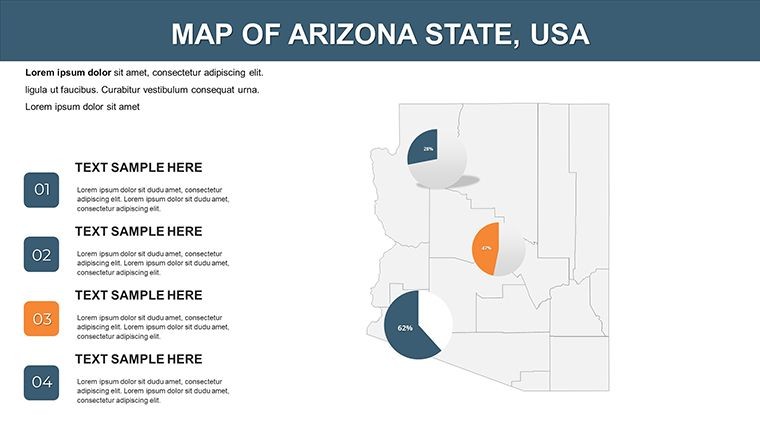
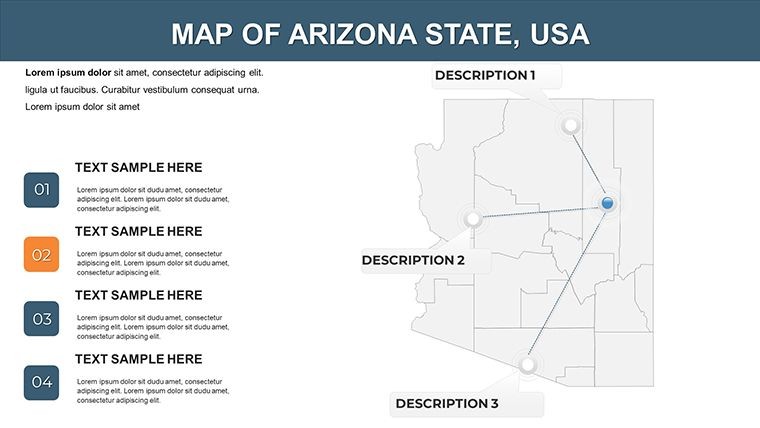
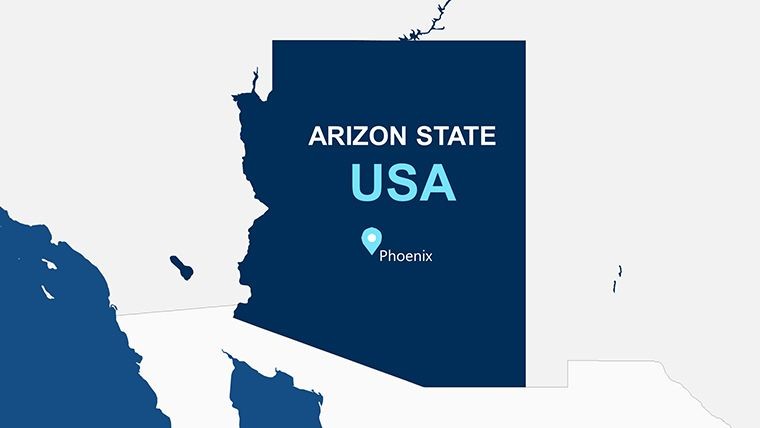
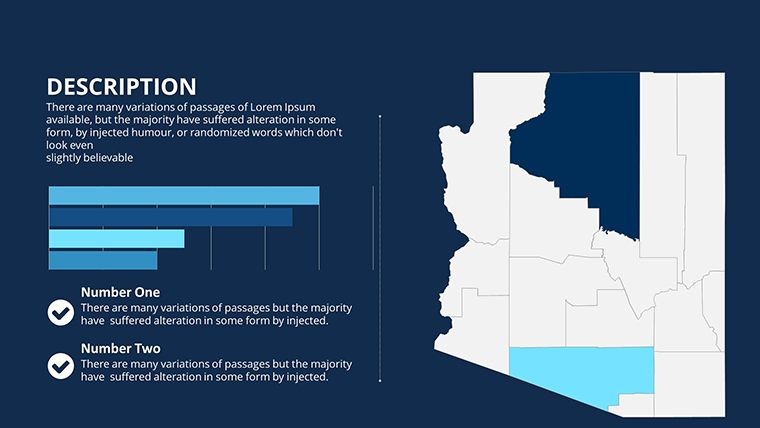
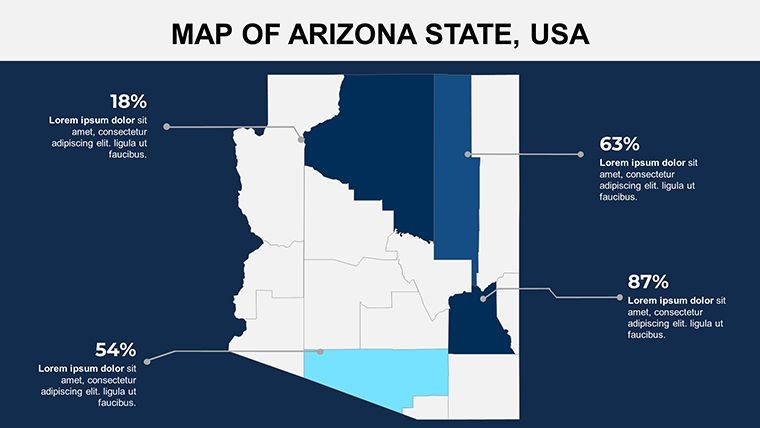
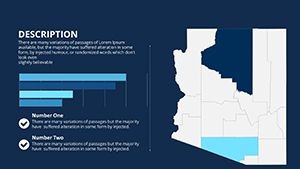
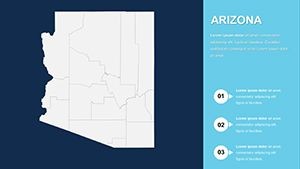
The slide range serves two distinct presentation types. A statewide overview slide establishes geographic context for an audience unfamiliar with Arizona's layout - useful in investor or client meetings where not all attendees have regional knowledge. The county-level slides then support granular arguments: territory assignments, service coverage gaps, infrastructure rollout phases, or demographic zone comparisons. Both layers coexist in one file, eliminating the need to merge slides from multiple sources before a presentation.
Compared to broader multi-state western US sets where Arizona typically receives one or two slides, this file treats Arizona as the sole subject. That depth suits teams with a state-specific focus - a real estate developer analyzing land use patterns across all 15 counties needs coverage that a 50-state atlas cannot provide efficiently.
Key Specifications At a Glance
| Feature | Details |
|---|---|
| Editable county regions | All 15 Arizona counties are separate vector groups - click to select and recolor each independently |
| Text labels | County names and city labels are editable text boxes; double-click to update without ungrouping |
| File format | .key - opens in Keynote 12 or later on macOS and iPadOS |
| Aspect ratio | 16:9 widescreen, compatible with standard projectors and screen outputs |
| Color scheme adjustments | Master slide palette controls global tones; individual shape fills override via Format sidebar |
| Export options | Export as .key for editing, PDF for distribution, or PNG for embedding in other files |
| Animation support | No animations pre-applied; all Keynote built-in transitions and builds are compatible |
| Editing difficulty | Beginner - no design skills required beyond familiarity with Keynote's basic tools |
Three Situations Where This Pays Off
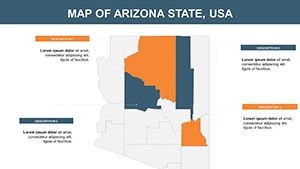
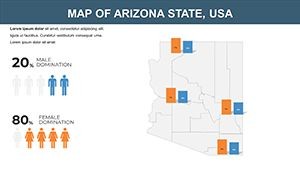
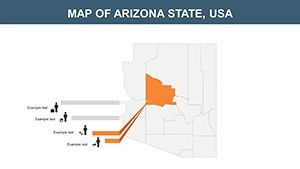
A regional sales director for a Phoenix-based solar energy company needed to present service territory coverage to a board of directors. Using the county-level slides, she filled each active territory in the company's brand orange, left unserved counties in neutral gray, and added installation count labels directly onto each county shape. Preparation for that slide section took 40 minutes. The same file was adapted for five consecutive quarterly briefings by updating only the label data.
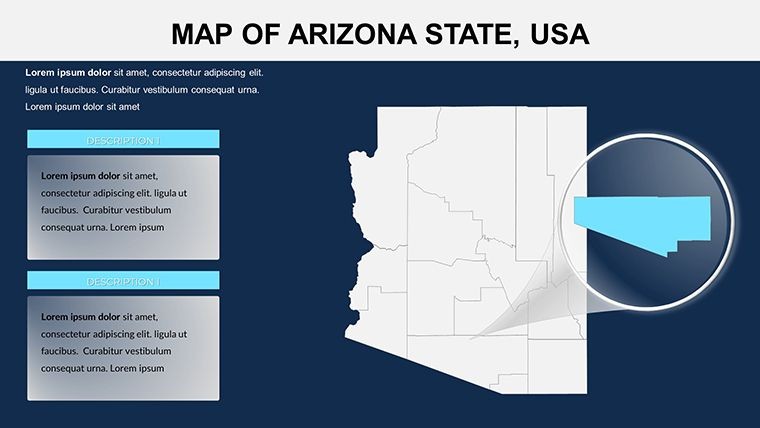
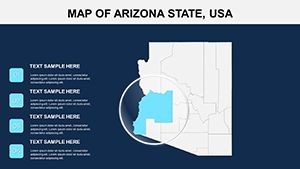
An urban planning consultant in Tucson preparing a public-comment presentation for a county zoning commission used the Pima County inset slide to overlay proposed development zones, using color gradients to distinguish residential, commercial, and preservation areas. The vector quality held sharp at large-format projection - an important factor in public hearing rooms where the audience sits at a distance from the screen.
Download and start editing immediately - the .key file opens in Keynote with no plugins required.
From Download to Final Deck
Editing difficulty: Beginner. Keynote is the only software required at any stage.
- Step 1 - Open the .key file in Keynote 12 or later on macOS or iPadOS (1 minute)
- Step 2 - Select the slide that matches your required coverage level - full state, county grid, or urban inset (1 minute)
- Step 3 - Click a county shape to select its vector group, then apply your fill color via the Format sidebar (2 minutes)
- Step 4 - Double-click any county or city label to replace the text with your own data annotation or territory name (3 minutes)
- Step 5 - Apply brand colors globally via Edit Master Slide, updating background and accent tones across all 24 slides at once (2 minutes)
- Step 6 - Export as PDF or PNG for sharing, or keep as .key for live presenting (1 minute)
The master slide update in Step 5 is the most time-efficient action in the workflow. One change propagates to all 24 slides, which matters when a team needs to re-brand the deck for a different client or project context without re-editing individual slides.
Compared to Starting From Zero
Constructing a single Arizona county map from scratch in Keynote means sourcing an accurate vector file, importing it, verifying that all 15 county boundaries align with current census definitions, and then building a labeling system that handles the proximity of small urban counties like Maricopa and the large open counties of the northwest. An experienced designer spends two to three hours on one usable slide. 24 slides at that pace is a project spanning multiple days.
A consistent failure point in manual builds is label collision. Maricopa County - by far the largest by population but not by area - sits adjacent to smaller counties whose labels compete for space at standard slide zoom. This file positions labels at the geographic centroid of each county with adequate spacing built in at design time, a decision that avoids the last-minute repositioning that typically happens one hour before a presentation.
Two structural choices in the layout reflect deliberate design reasoning: county boundaries use a slightly heavier stroke than internal city markers, which helps audiences identify administrative borders versus population centers without a legend. And the state outline uses a drop shadow on slides where the county grid is shown without a surrounding map context, which maintains spatial orientation when an audience member does not immediately recognize Arizona's shape.
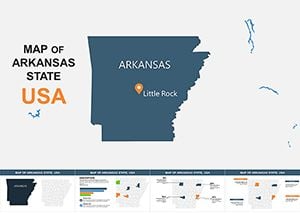
Project managers and logistics teams building multi-state coverage decks often pair Arizona county maps with adjacent state coverage - the Arkansas editable map set and the BC Canada map template are frequently downloaded alongside state-specific US files for cross-regional analyses. For full North America territory coverage, the North America Keynote Maps category contains the complete state-by-state library.
Download the 24-slide .key file now and have your first Arizona county map ready in under 10 minutes.
Which version of Keynote is required to open this template?
The file requires Keynote 12 or later, available as a free download from the Mac App Store and compatible with macOS Monterey and later. iPadOS versions of Keynote from 2021 onward also open the .key file without issues. Older Keynote versions bundled with macOS Catalina or earlier may not render the vector groups correctly. If you are on an older system, update Keynote from the App Store before downloading the template. No third-party fonts or plugins are required.
How do I change the color scheme for my brand?
Open the .key file in Keynote, then go to View > Edit Master Slide. Update the background and accent colors using the color picker with your organization's hex values - this change applies to all 24 slides simultaneously. To highlight a specific county in a different color (for example, a target territory), click that county's shape on the slide and change its fill color in the Format sidebar independently. This two-level system - master slide for global style, per-shape for specific emphasis - means branding the full deck takes under five minutes.
What does the license allow - can this be used in client presentations?
The standard license permits use in internal business presentations and in client-facing work where the maps are part of a delivered service - consulting reports, agency pitch decks, public-comment presentations, and similar professional uses. Reselling the .key file as a standalone product, sublicensing it, or distributing it as a downloadable asset is not allowed. For use cases that fall outside standard presentation delivery - such as embedding map slides in a sold video course - contact ImagineLayout support to confirm license scope before purchasing.
Is there a free version available?
The product page does not list a free version for this template. The full 24-slide .key file is available for a one-time purchase of $15. Before purchasing, review the gallery preview images on the product page - all slide layouts are shown, so you can verify that the coverage levels and visual style match your presentation requirements. ImagineLayout's refund policy is at imaginelayout.com/refund-policy; review those conditions if you have compatibility concerns before completing checkout.
Does the template support animations for county-by-county reveals?
No animations are pre-applied to the template - the slides are delivered as clean, static layouts. Keynote's full animation library is compatible with all vector shapes in the file. To create a county-by-county reveal, select the county shapes on a slide, assign a Build In animation from the Animate panel (such as Appear or Wipe), and set each shape to trigger on click or on a timer. This approach keeps the template flexible for users who do not want animation as well as those who do, without requiring removal of pre-set transitions.
Can the file be exported to PowerPoint for Windows users?
Keynote can export .key files to .pptx format via File > Export To > PowerPoint. Vector shapes and text labels generally transfer correctly, but Keynote-specific layout behaviors and transitions may not replicate exactly in PowerPoint. Test the exported .pptx on the target Windows machine before the presentation date, particularly if the file will run in PowerPoint 2016 or 2019 rather than Microsoft 365. If PowerPoint compatibility is the primary requirement from the start, ImagineLayout's North America PowerPoint maps category contains equivalent files built natively for PowerPoint.