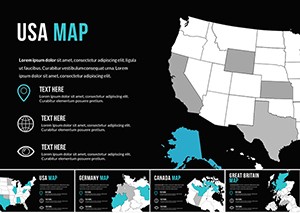
Alaska Counties Map Keynote Template - Fully Editable Designs


Type: Keynote Maps template
Category: North America
Sources Available: .key
Slide size: widescreen (16:9)
Product ID: KM00090
Template incl.: 26 editable slides
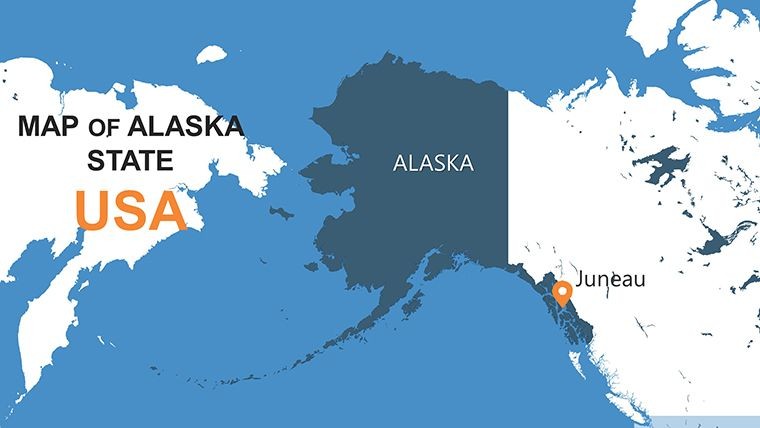
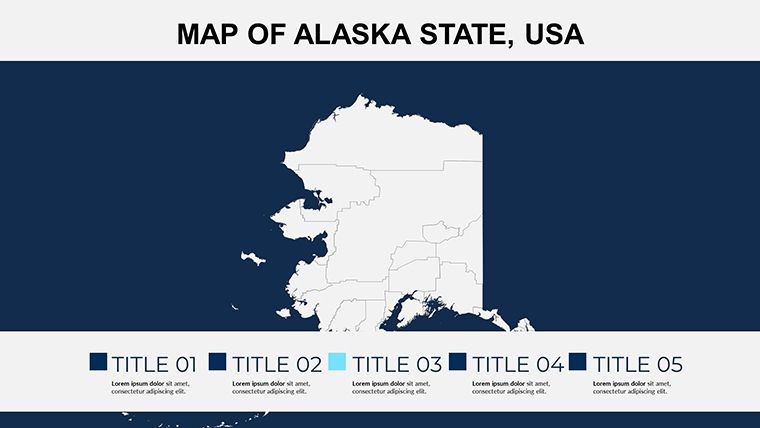
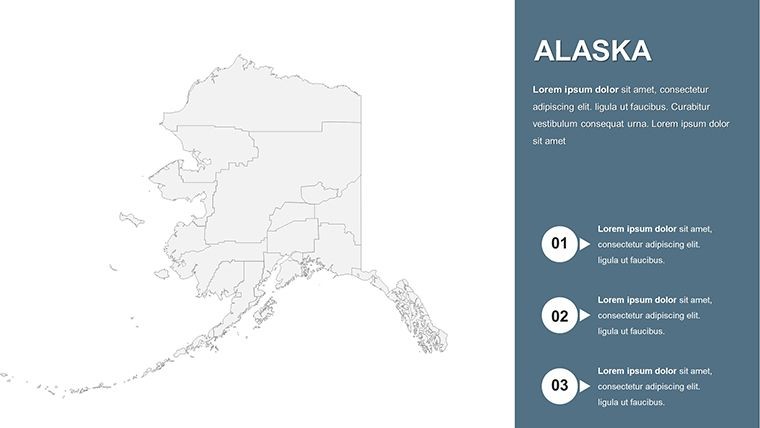
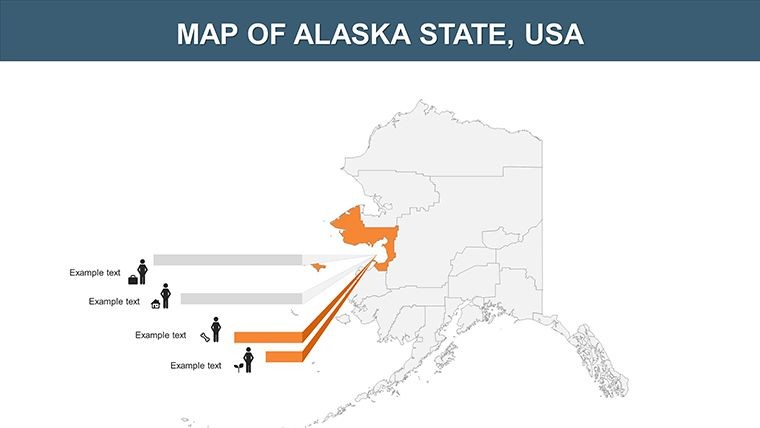
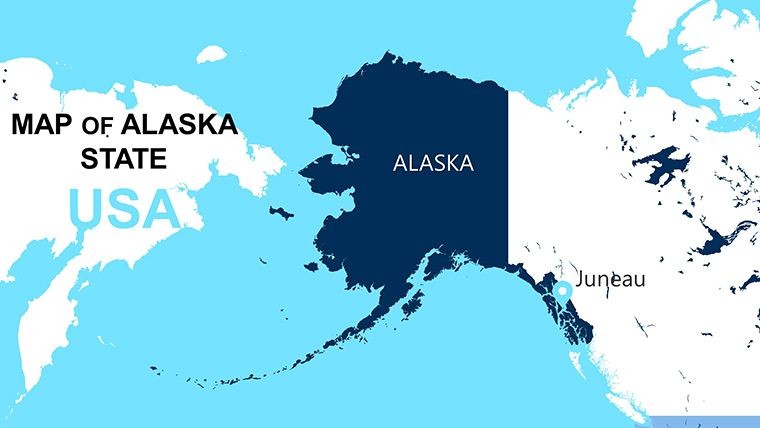
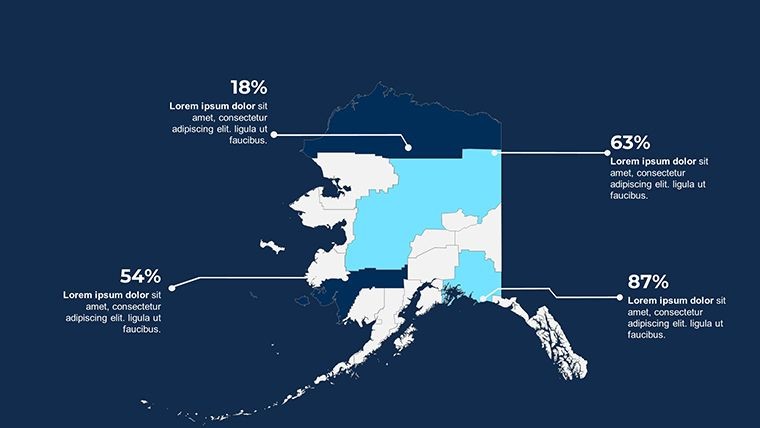
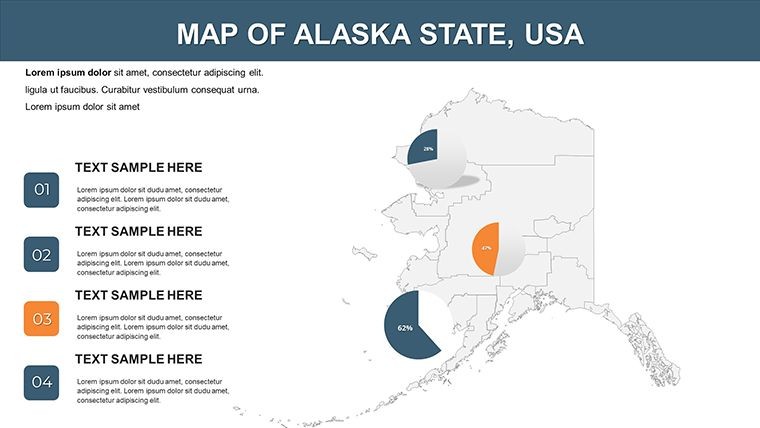
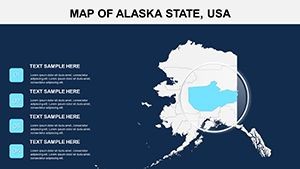
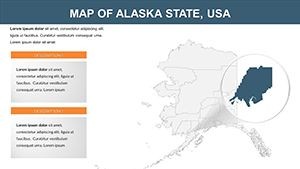
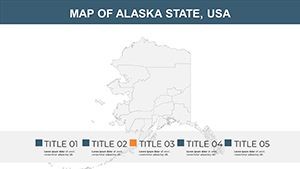
For those tackling the vast expanse of America's Last Frontier, our Alaska counties map Keynote template offers a robust platform to convey intricate details with ease. Spanning from the Aleutian Islands to the Arctic plains, this 26-slide set is ideal for resource managers, environmental scientists, and policymakers needing to visualize boroughs and census areas accurately. It addresses the unique challenges of Alaska's geography - sparse populations, extreme terrains - by providing scalable vectors that maintain integrity during enlargements. Whether plotting oil reserves in the North Slope or conservation zones in Southeast Alaska, this template turns raw data into persuasive visuals, fostering better understanding and collaboration in fields where precision matters most.
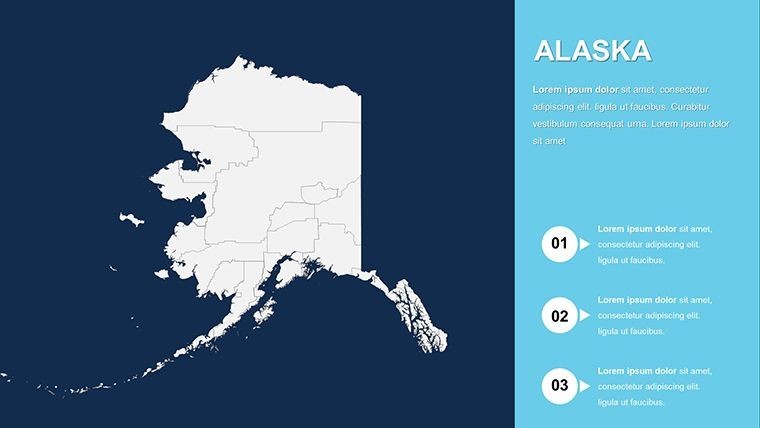
Navigating Alaska's Unique Landscape Through Maps
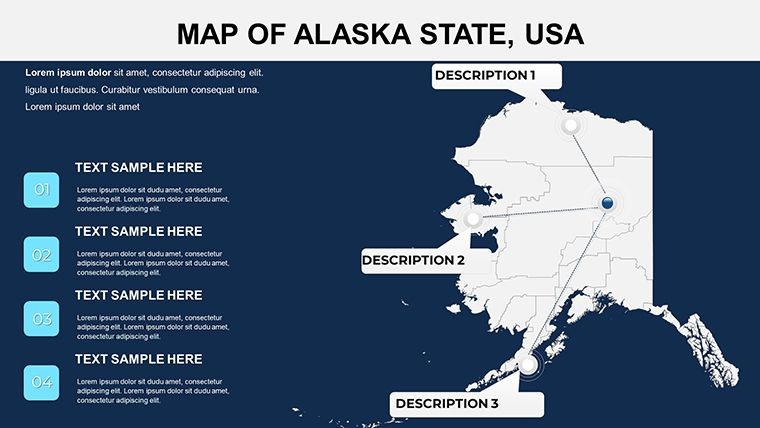
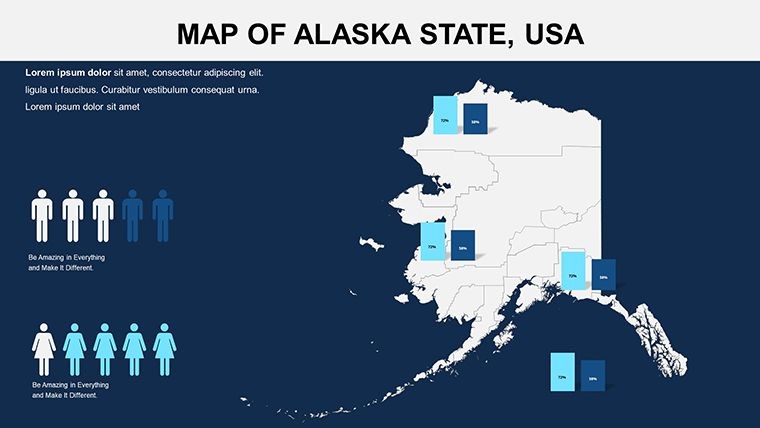
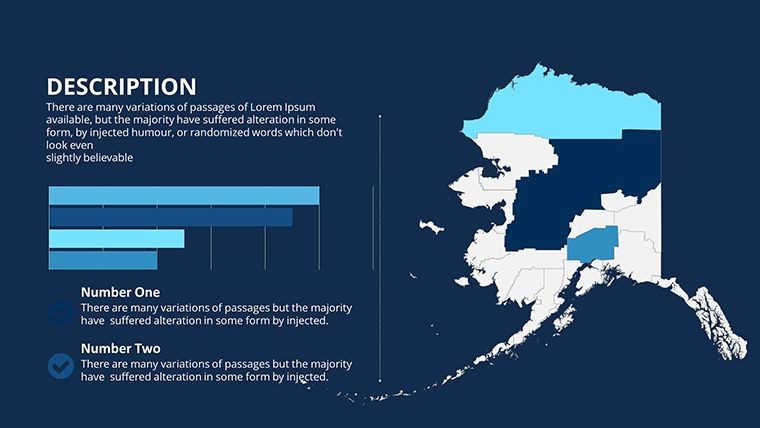
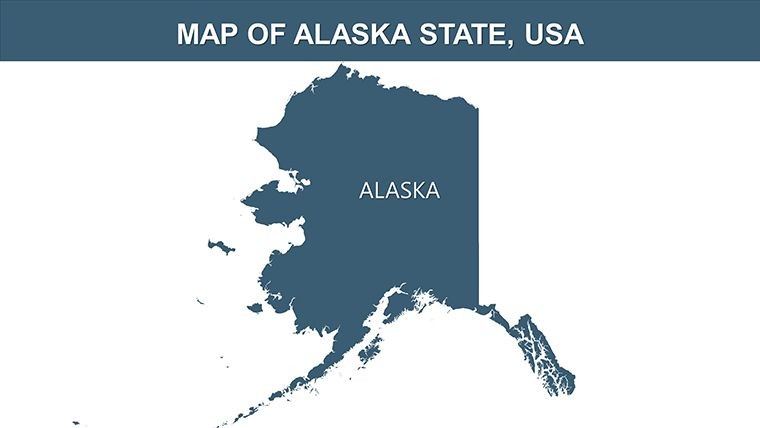
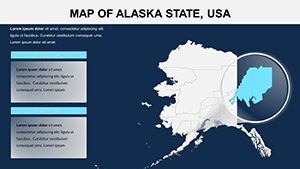
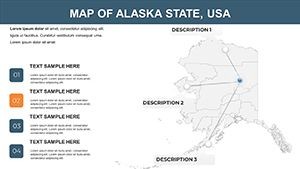
Alaska's sheer size and diversity require maps that go beyond basics, and this template rises to the occasion. Aligned with data from the U.S. Census Bureau for county equivalents (boroughs and census areas), it features detailed outlines that can be layered with thematic elements. Environmental consultants, for example, might animate glacier retreat patterns in the Kenai Peninsula, referencing studies from the National Park Service to underscore climate impacts. This not only showcases authoritative knowledge but also builds audience trust through evidence-based storytelling, much like how the Alaska Department of Natural Resources uses similar tools for public reports.
Essential Features for Professional Edits
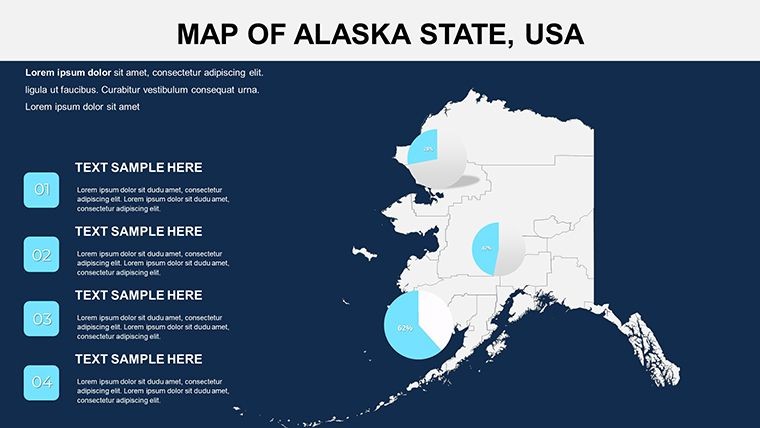
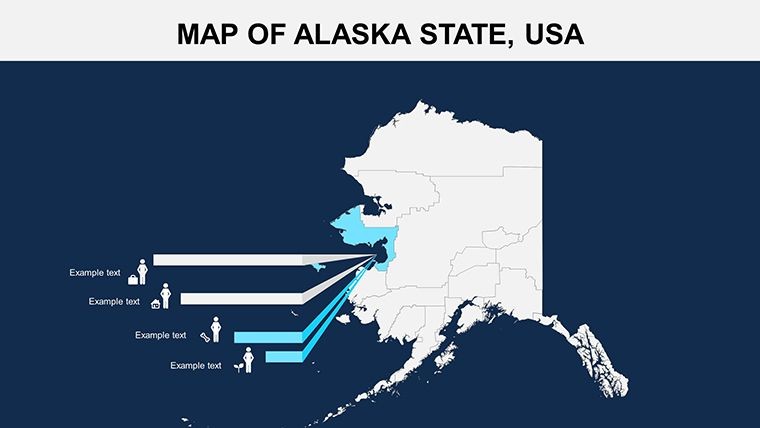
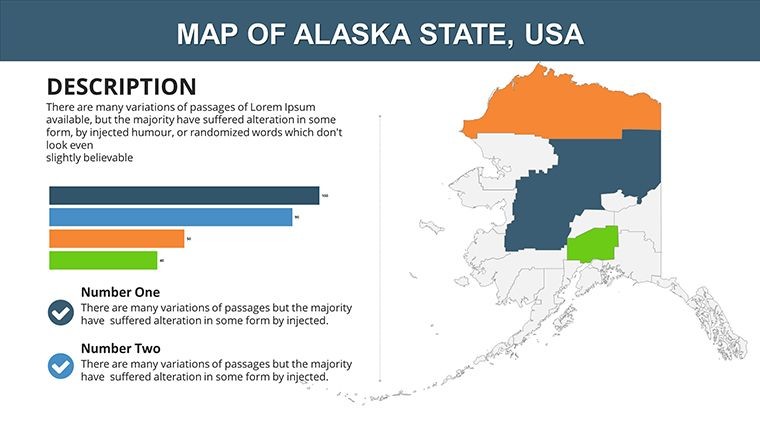
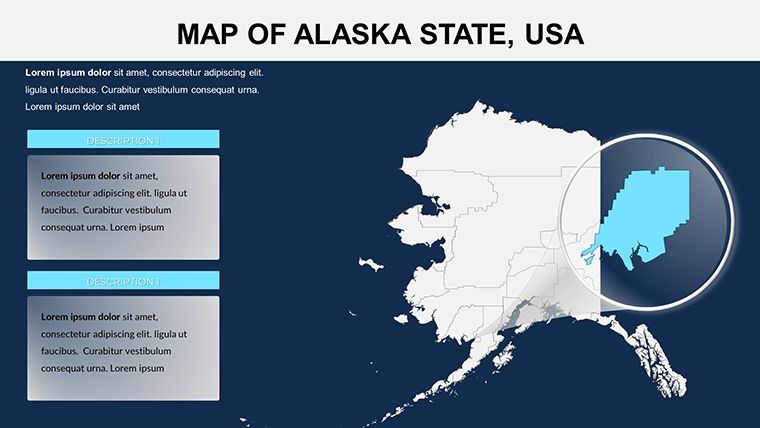
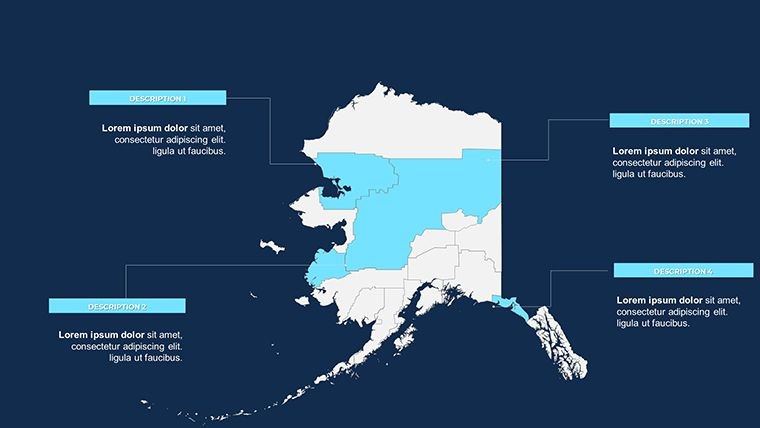
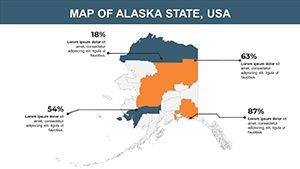
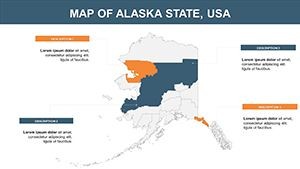
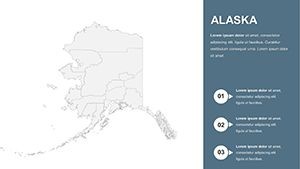
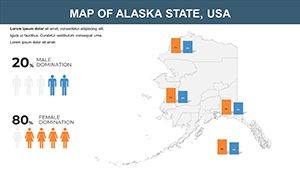
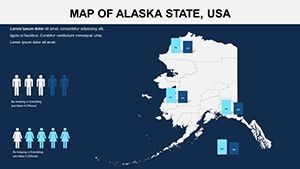
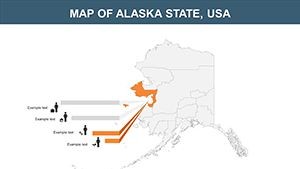
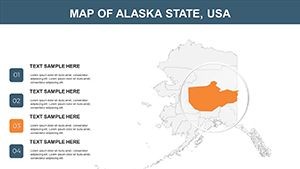
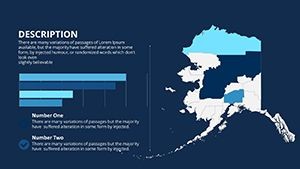
At its heart, the template emphasizes user empowerment with features like full editability - alter colors to denote land use types, add photos of wildlife habitats, or modify text for specific metrics. The widescreen slides support custom animations, allowing you to reveal boroughs one by one in a sequence that mirrors exploration narratives. Included vector icons and PNG files enhance versatility, while the .key format ensures smooth operation on Apple devices.
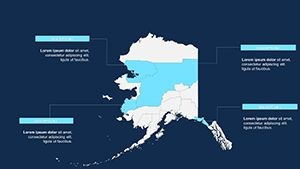
- Complete Customization: Edit every aspect, from boundaries to labels, with simple clicks.
- Animation Capabilities: Add effects to highlight changes over time, like population shifts.
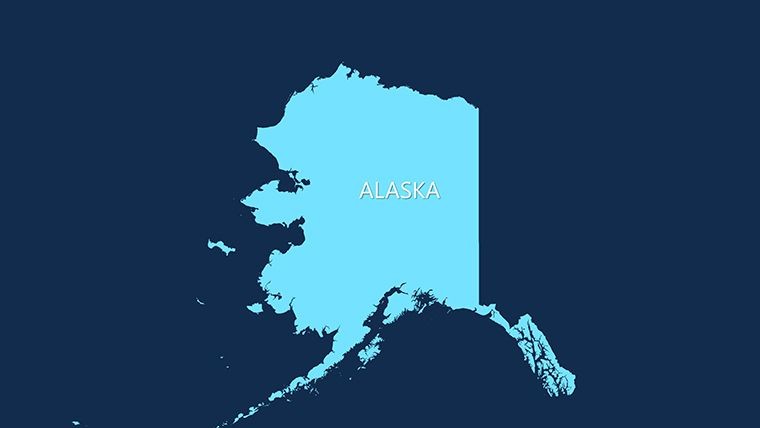
- High-Quality Vectors: Scale infinitely without blurring, ideal for detailed zooms.
- Included Assets: Vector icons and PNGs for quick enhancements.
Tailored Applications for Alaska-Focused Projects
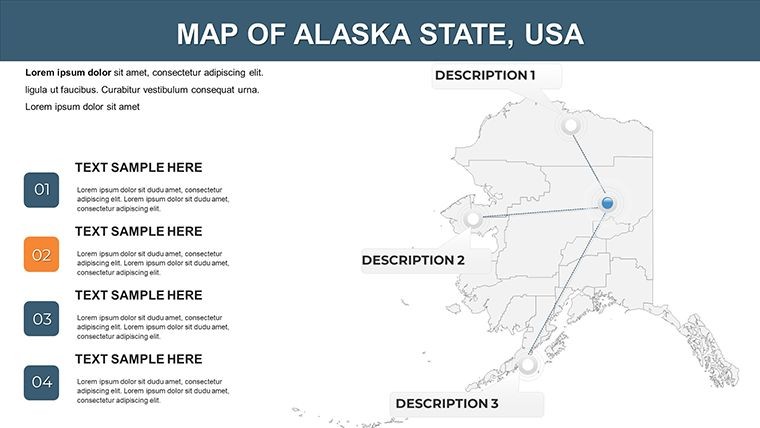
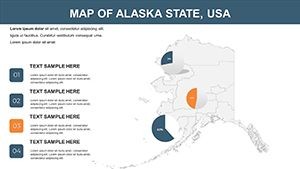
The real value emerges in application. Energy firms can map pipeline routes across the Yukon-Koyukuk Census Area, using animations to simulate flow dynamics and integrate data from EIA (Energy Information Administration) reports. Tourism operators might customize slides to showcase adventure spots in the Matanuska-Susitna Borough, with overlaid itineraries that engage potential visitors. In research, scientists track wildlife migrations, animating paths from Denali to the Bering Sea, drawing parallels to fieldwork by the USGS. Unlike rudimentary maps in default software, this template's depth allows for comparative analyses, such as before-and-after environmental impacts, boosting presentation efficacy as per insights from visualization experts at Tableau.
Streamlined Process for Map Customization
To harness its full potential, follow a clear path: Load the .key file, choose a county-focused slide, and edit shapes directly - recolor the Southeast Fairbanks for mining data or add grids for coordinate precision. Incorporate animations via the inspector panel, setting fades for economic indicators or paths for transportation networks. For integration, pull in external images or charts, ensuring alignment with your theme. This workflow, refined through iterative design testing, mirrors professional pipelines used in GIS software like ArcGIS, but simplified for Keynote users.
Additionally, the template facilitates hybrid presentations, blending maps with infographics for comprehensive overviews, such as Alaska's fishing industry stats from NOAA. It's a leap forward, offering creativity that static alternatives can't match.
Ensuring Reliability in Your Mapping Tools
This template is forged with quality in mind, adhering to digital cartography best practices from organizations like the International Map Industry Association. Its reliability shines in the editable nature, backed by a zip file that includes all necessities, eliminating surprises. For those in remote sensing or policy, it provides a trustworthy base for sensitive data handling.
Close your next briefing with a dynamic map that encapsulates Alaska's grandeur and complexities, leaving stakeholders informed and motivated. Claim this essential tool and chart new territories in presentation excellence.
FAQ
- How editable are the county boundaries?
- Fully - resize, recolor, or reshape without quality degradation using vector tools.
- Can I add animations to specific boroughs?
- Yes, apply custom effects individually for targeted emphasis.
- Is this optimized for large-scale projections?
- Certainly, with high-res vectors that stay sharp on big screens.
- What additional files come with the download?
- .key slides, vector icons, and PNGs for extra flexibility.
- Suitable for environmental data visualization?
- Ideal - overlay stats on maps for clear, impactful displays.