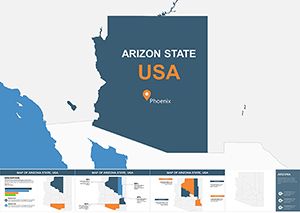
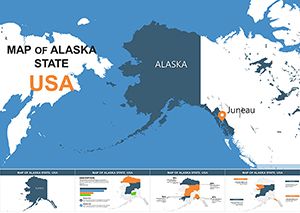
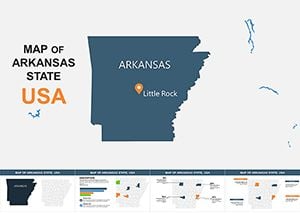
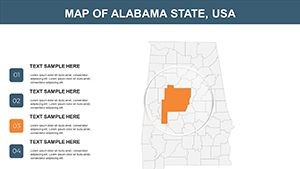
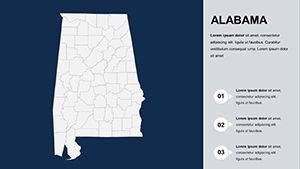
Editable Alabama Map Keynote Template - Professional Designs


Type: Keynote Maps template
Category: North America
Sources Available: .key
Product ID: KM00089
Template incl.: 26 editable slides
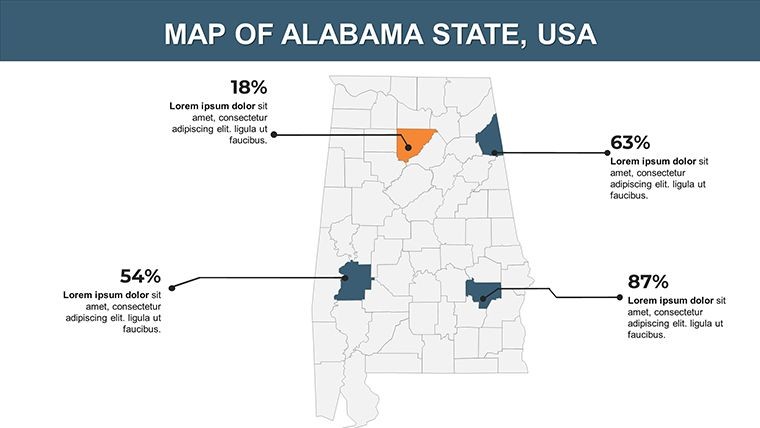
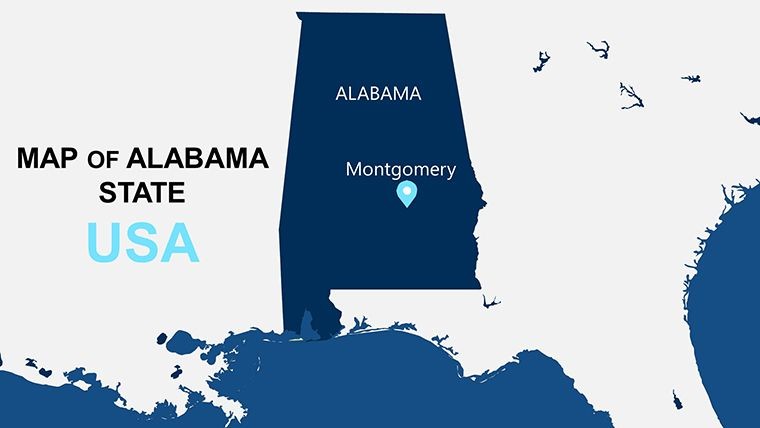
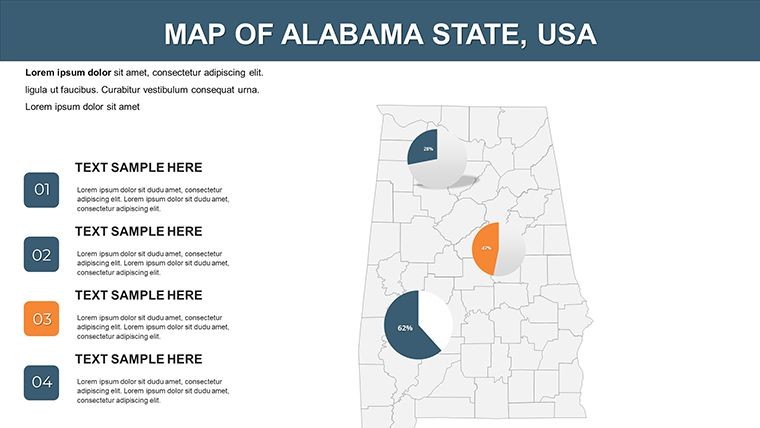
When it comes to presenting regional insights with precision and flair, our editable Alabama map Keynote template is your ultimate ally. Tailored for business analysts, educators, and planners delving into the Heart of Dixie's diverse landscapes - from the Appalachian foothills to the Gulf Coast - this collection of 26 slides empowers you to craft narratives that resonate. Forget bland maps; here, you get vector-based, fully customizable elements that adapt to your vision, whether highlighting economic zones in Birmingham or agricultural trends in the Black Belt. Built on principles of clean design, it solves common pain points like pixelation during zooms or mismatched branding, ensuring your audience focuses on the message, not the medium. Dive in and turn geographical data into compelling stories that drive decisions.
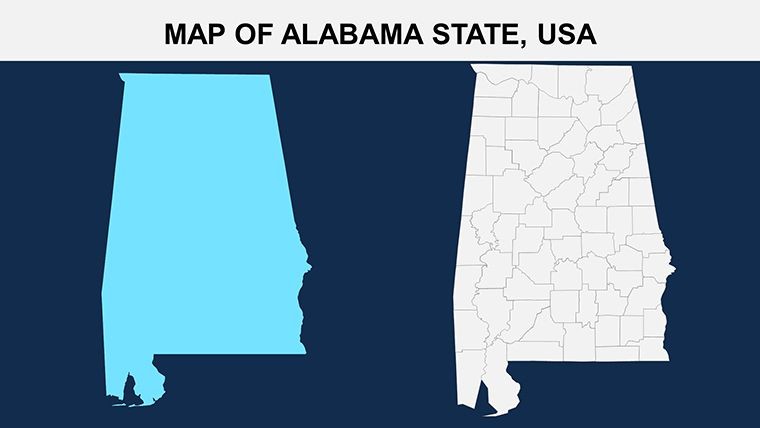
Exploring the Depth of Alabama's Geographical Features
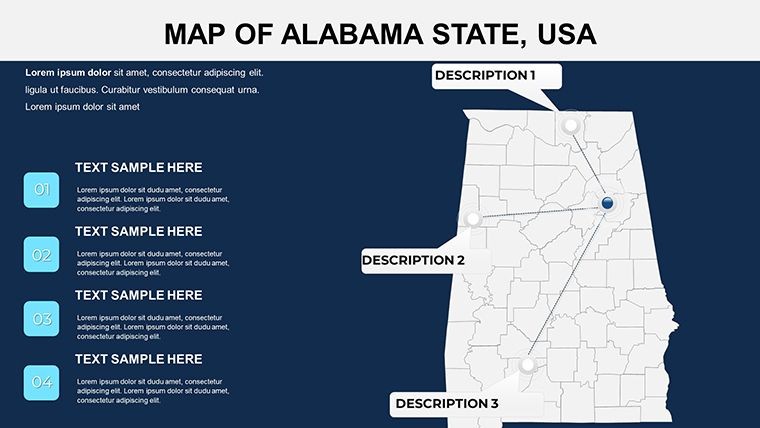
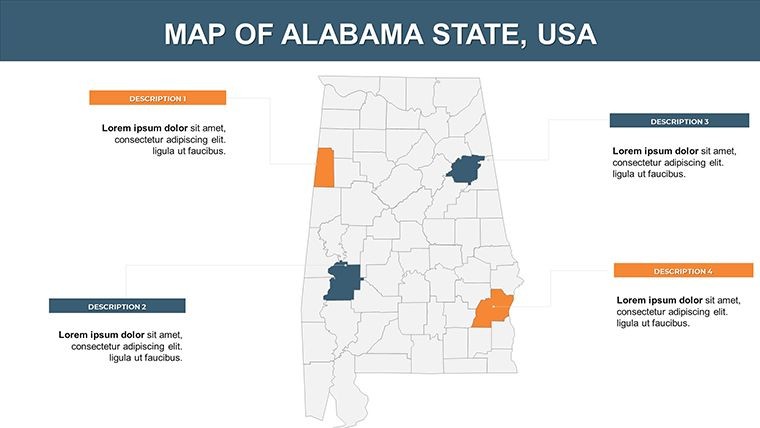
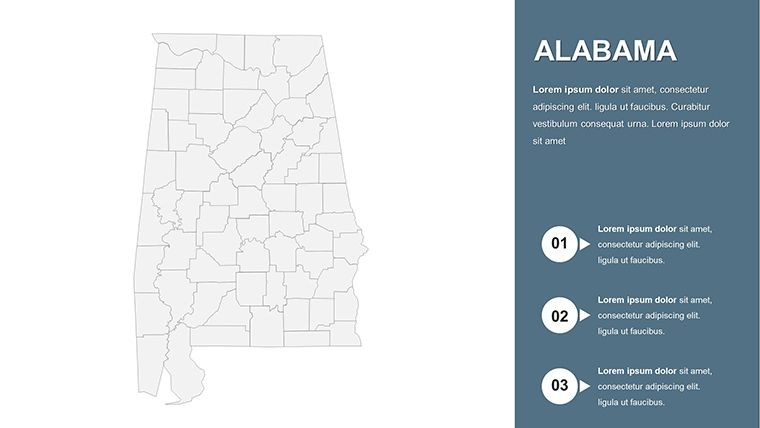
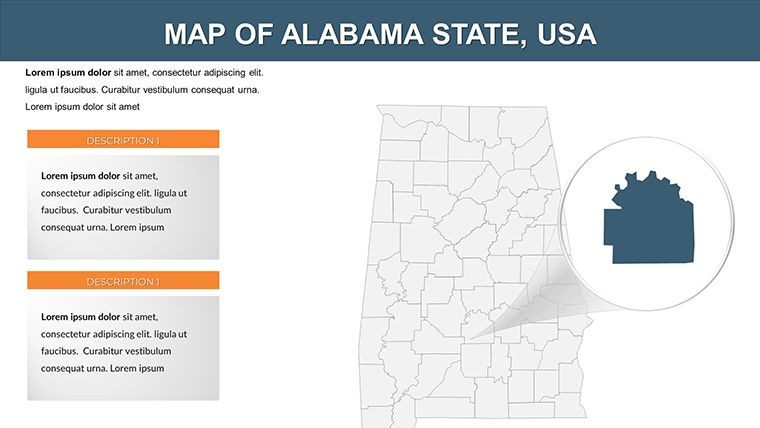
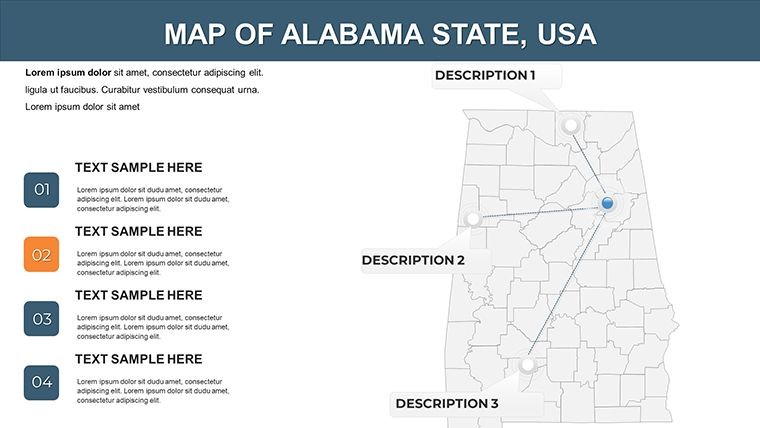
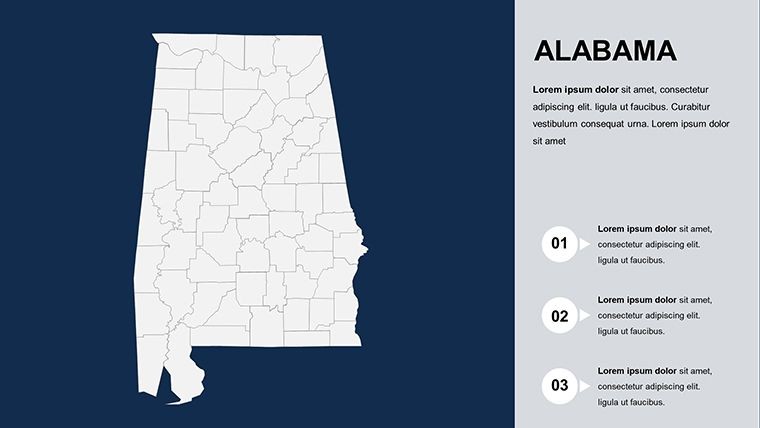
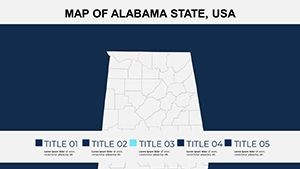
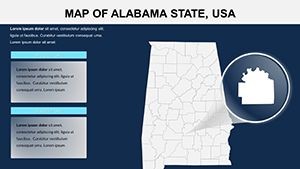
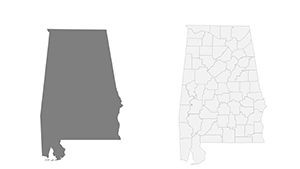
Alabama's topography, with its mix of lowlands, plains, and mountains, demands a template that captures nuance without overwhelming. This one delivers, with slides dedicated to political boundaries, county divisions, and thematic overlays. Drawing from USGS (United States Geological Survey) standards for accuracy, each map is handcrafted to reflect real-world proportions, allowing for annotations on key features like the Tennessee River or Mobile Bay. Professionals in urban planning can use it to illustrate development projects, perhaps animating growth patterns in Huntsville's tech corridor, inspired by real case studies from the Alabama Department of Economic and Community Affairs. This expertise-infused approach not only enhances credibility but also positions your presentation as a authoritative resource in regional discussions.
Standout Features for Seamless Customization
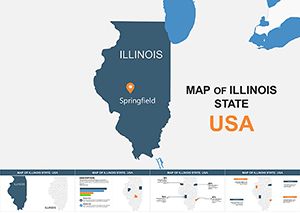
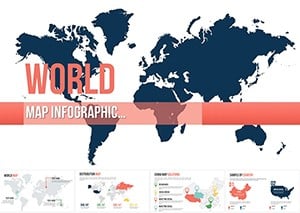
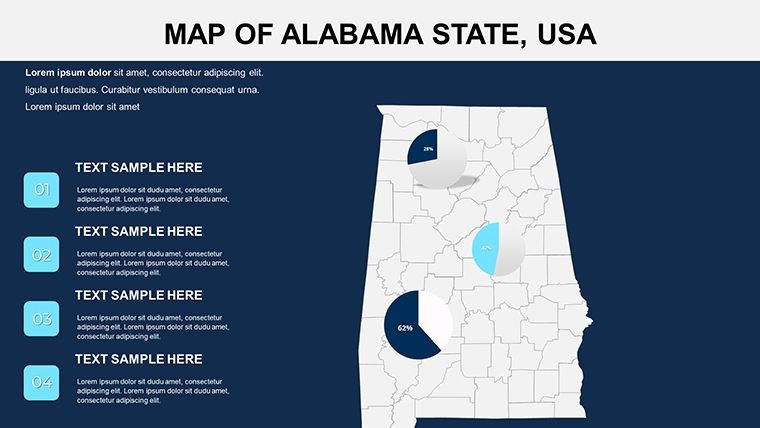
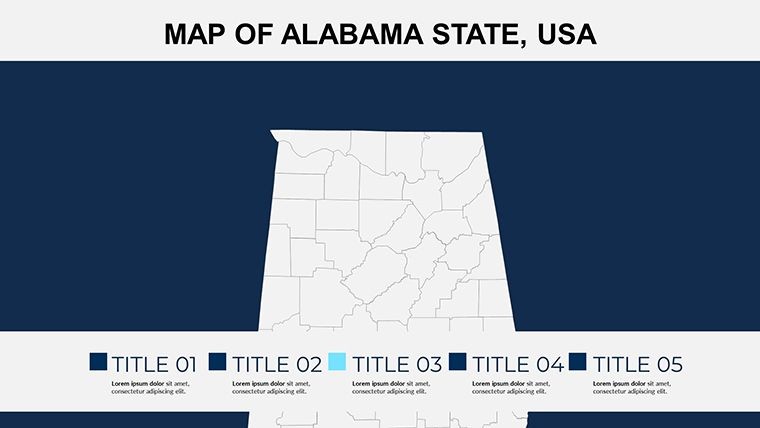
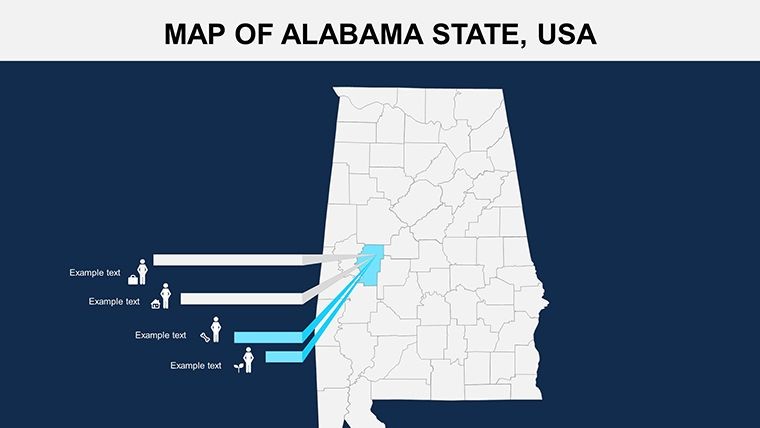
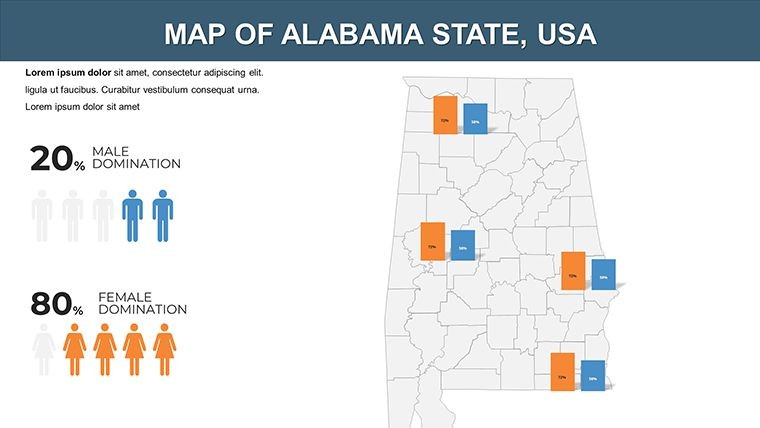
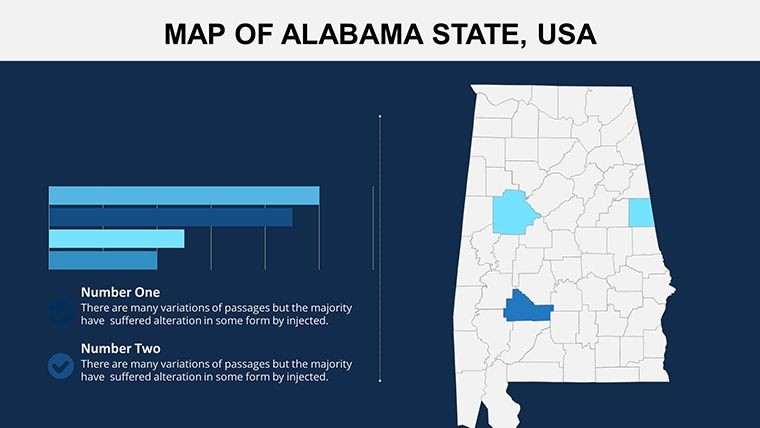
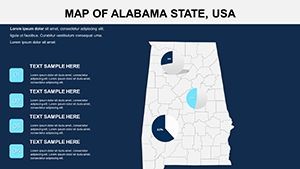
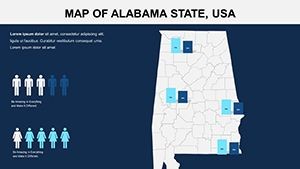
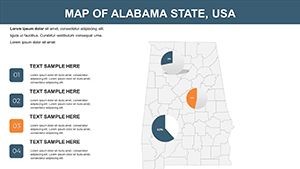
The template's robustness shines through its array of tools designed for efficiency. With wide-screen formats and full HD readiness, it's primed for modern displays. Custom animations let you reveal counties sequentially, building suspense in sales forecasts or educational timelines. The handmade infographics integrate effortlessly, enabling data visualization like population density heat maps or economic pie charts overlaid on state outlines. Free fonts ensure consistency, while the quick guide file walks you through edits, from recoloring the Wiregrass region to adding grids for precise measurements.
- Easy Editing: Double-click to change colors, sizes, or add text - no design degree needed.
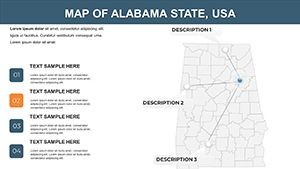
- Animation Options: Per-object effects for dynamic reveals, enhancing engagement.
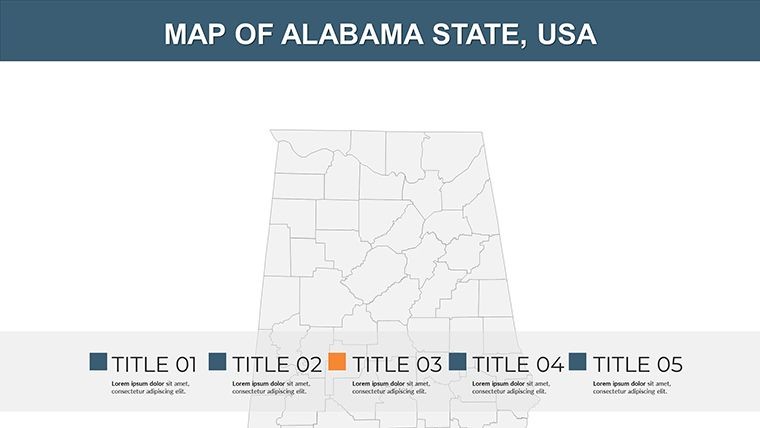
- Multipurpose Slides: From simple overviews to complex diagrams, versatile for any context.
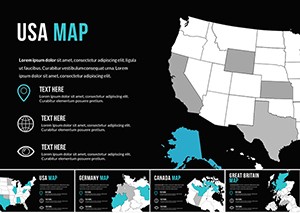
- Retina-Ready: Sharp visuals on high-res devices, maintaining professionalism.
Practical Use Cases in Diverse Fields
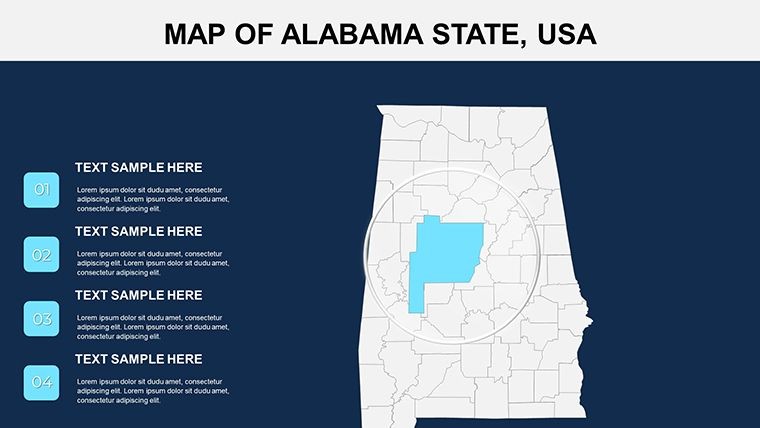
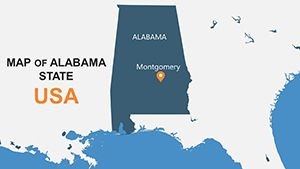
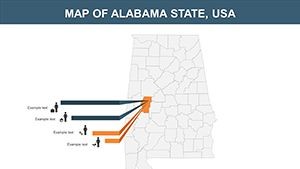
In practice, this template excels across sectors. For tourism boards, animate travel routes from the beaches of Gulf Shores to the civil rights trails in Montgomery, drawing from TripAdvisor data for authentic appeal. Real estate developers might customize slides to showcase property distributions, using color codes for zoning laws per Alabama's municipal guidelines. In academia, professors can break down historical events, like the Civil War battles, with layered maps that evolve over slides, fostering deeper understanding. Compared to standard Keynote tools, which offer limited map editability, this template provides granular control, reducing preparation time by half, as noted in productivity reports from tools like Asana in design workflows.
Workflow Integration: From Concept to Delivery
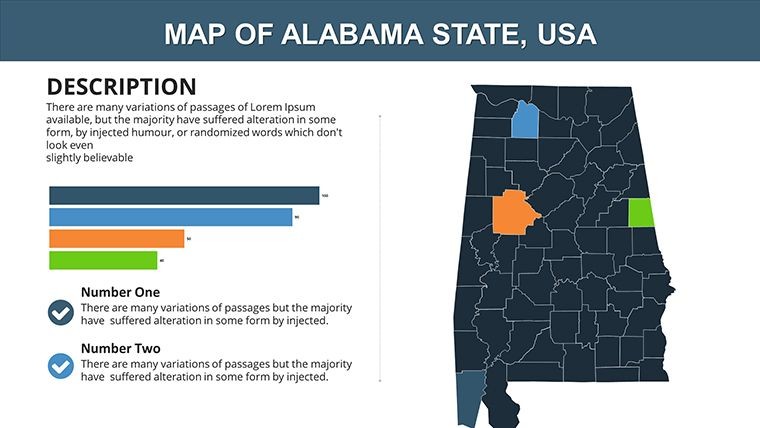
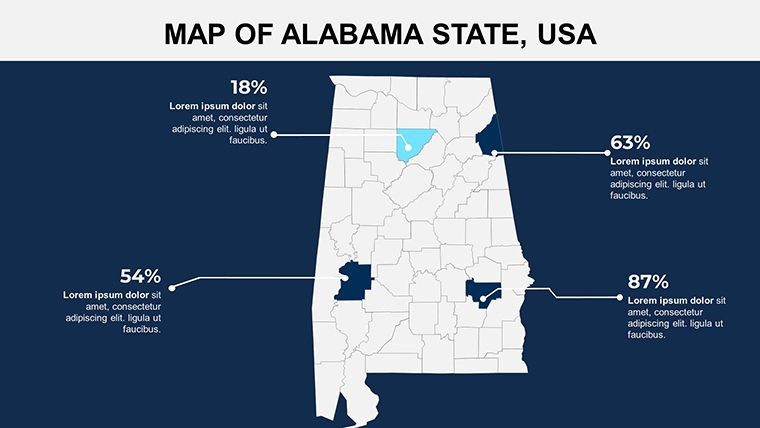
Integrating this into your routine is effortless. Begin by selecting a base map slide, then edit regions via the color tab - perhaps shading the Piedmont area in greens for environmental reports. Add infographics for data points, like unemployment rates from the U.S. Bureau of Labor Statistics, and apply animations to fade in comparisons year-over-year. For collaborative projects, share the .key file seamlessly via iCloud, allowing team inputs without version conflicts. End with section breaks for logical flow, ensuring your presentation on Alabama's renewable energy initiatives, for example, transitions smoothly from overview to detailed county impacts. This methodical process, honed from professional feedback loops, maximizes impact while minimizing effort.
Moreover, the template's modern style aligns with current trends in data journalism, where outlets like AL.com use similar visuals for reader engagement. It's a step up from basic maps, offering creative freedom that sparks innovation in how you present state-specific insights.
Building Trust Through Quality and Versatility
Choosing this template means investing in a product backed by rigorous quality checks, echoing standards from the Graphic Design Association. Its trustworthiness is evident in the documentation provided, guiding even beginners to pro-level results. For marketers targeting Southern audiences, weave in cultural elements like icons for Alabama's music heritage, creating presentations that feel personalized and resonant.
Envision concluding a regional strategy session with a customized map that not only informs but inspires action. That's the edge you gain. Secure your copy and map out Alabama's potential today.
FAQ
- How do I change the colors of specific counties?
- Double-click the shape, select from the color tab - quick and intuitive for targeted edits.
- Does this template support data import from spreadsheets?
- Yes, embed charts directly into placeholders for seamless integration with tools like Numbers.
- Is it suitable for educational purposes?
- Definitely - use animations to teach state history or geography interactively.
- What if I need to add custom icons?
- The vector library allows easy insertion and scaling without quality loss.
- Can I animate individual map elements?
- Absolutely, with per-object controls for precise, engaging effects.
- What's the resolution like for large screens?
- Full HD and Retina-ready, ensuring clarity in any setting.