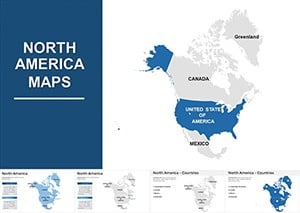
North America Political Map: Navigate Continents with Clarity


Type: Keynote Maps template
Category: North America
Sources Available: .key
Product ID: KM00068
Template incl.: 8 editable slides
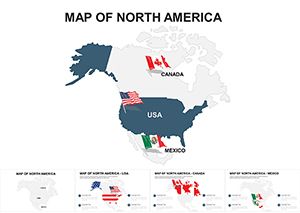
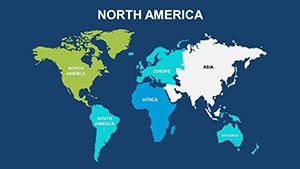
North America, with its diverse tapestry of 23 sovereign nations and myriad cultures, demands presentations that capture its essence without overwhelming. Enter our North America Political Map Keynote template: 8 editable slides that distills the continent's political intricacies into visually compelling narratives. Perfect for policy analysts dissecting trade pacts, historians tracing colonial legacies, or real estate developers scouting cross-border opportunities, this template turns geographical jargon into accessible insights.
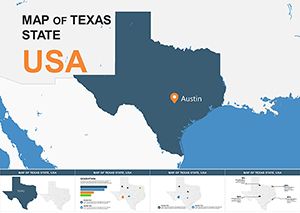
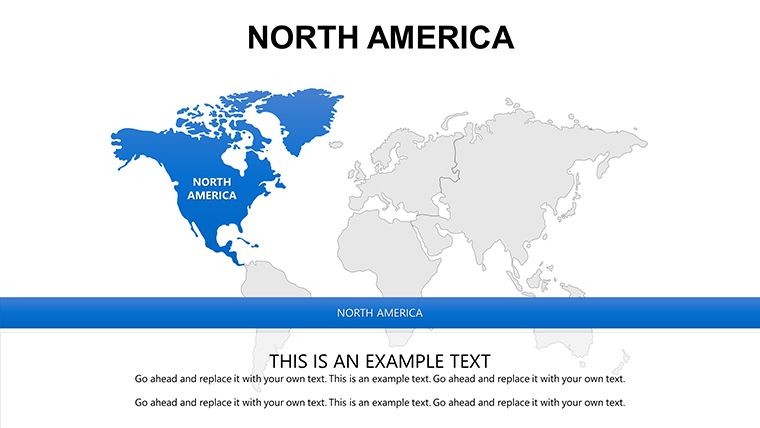
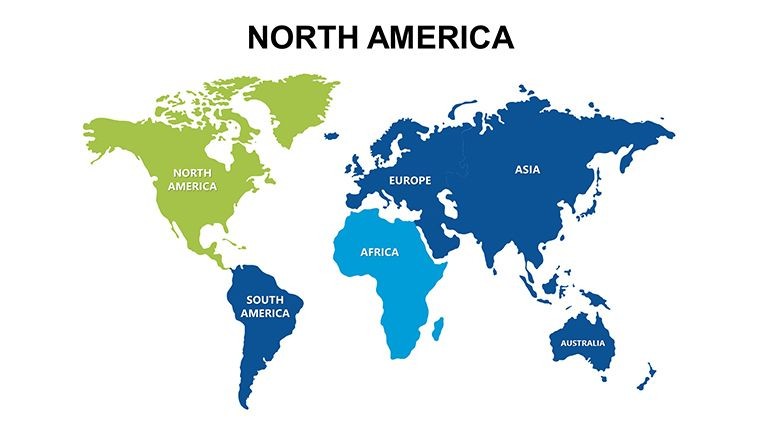
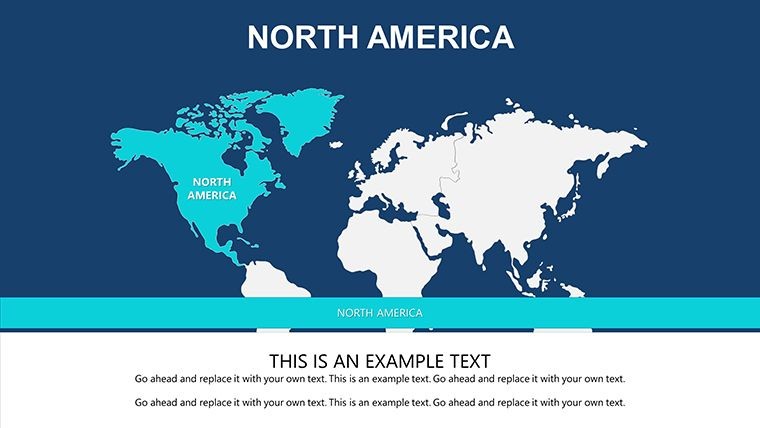
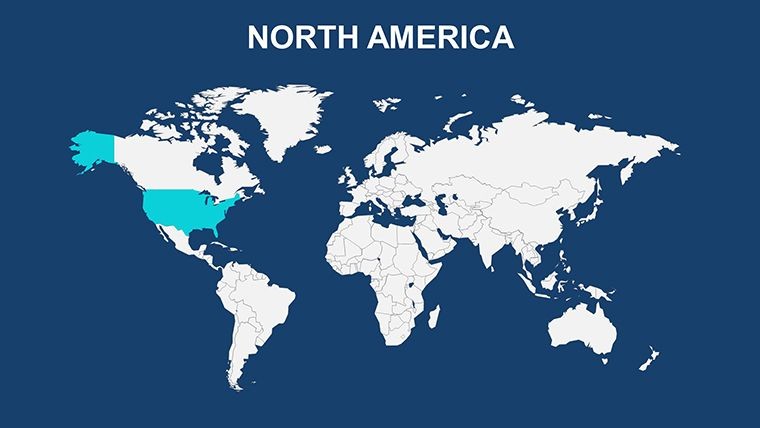
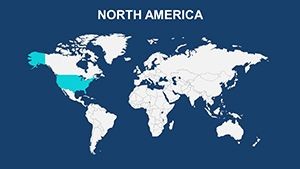
Rooted in precise cartography - aligned with UN geopolitical standards - these slides showcase everything from the elongated north-south axis to island dependencies in the Caribbean. Slide 2's overview map employs soft borders to delineate Central America's seven nations, while Slide 5 zooms on Latin America's 16 countries with ethnic diversity shading. Editability is king here: Infuse economic indicators via gradient fills, or pinpoint urban hubs like Mexico City with scalable markers, all while preserving the template's clean, contemporary lines that evoke trust and sophistication.
The value? Beyond aesthetics, it's about amplification. A urban planning consultant leveraged these slides for a binational infrastructure bid, overlaying rail proposals across U.S.-Mexico lines, securing funding through crystal-clear visualizations. Compatible with Keynote's robust ecosystem and exportable to PowerPoint for Windows collaborators, it ensures your message lands universally. Studies from the Presentation Guild show such targeted visuals can lift comprehension by 60%, turning passive listeners into active advocates.
Core Features Tailored for Political Precision
These 8 slides are engineered for depth without density. From the mainland sprawl to offshore territories, each element is vector-optimized for infinite scalability.
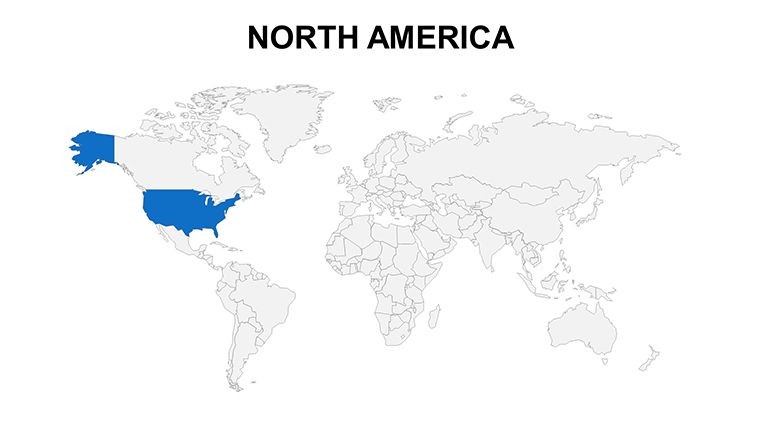
- Political Boundary Accuracy: Crisp lines for borders, with toggleable labels for capitals and major cities.
- Regional Breakdowns: Dedicated slides for sub-continents, like a Central America focus with canal highlights.
- Customization Suite: Color-code by alliance (e.g., NAFTA zones in unified hues) or economic tiers.
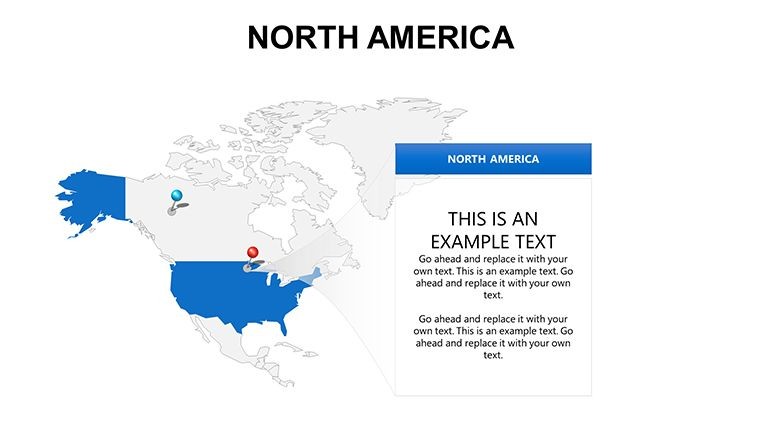
- Annotation Arsenal: Pre-built callouts for cultural notes, like Indigenous territories.
- Transition Tools: Smooth morphs between overviews and details, enhancing flow.
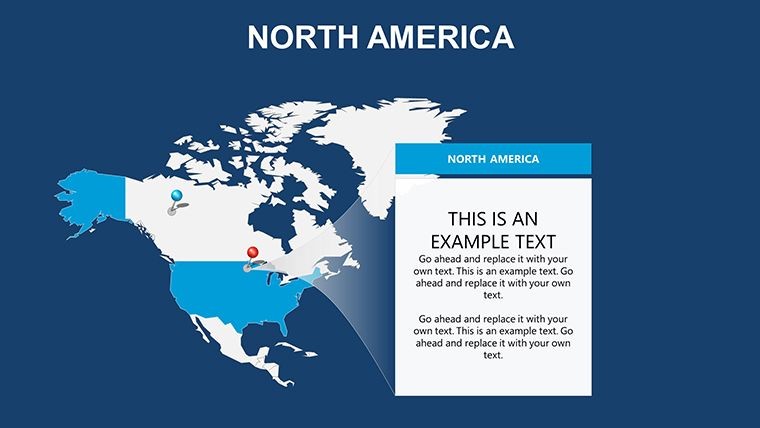
An NGO director praised Slide 6 for mapping migration corridors, adding arrow overlays that visualized policy impacts vividly.
Targeted Use Cases for Impactful Storytelling
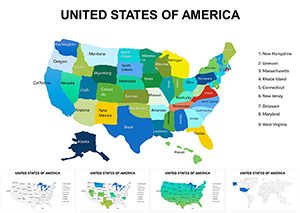
Apply this template where geography meets governance. In boardrooms, use the full-continent slide to chart energy pipelines snaking from Canadian tar sands to U.S. refineries. For academic panels, animate ethnic compositions on Slide 3 to discuss cultural mosaics, per Smithsonian frameworks.
Workflow walkthrough for a policy brief: Load data into Slide 1's base map, customize segments on Slides 2-4, integrate charts on Slide 7, and finalize with a summary infographic. Outshines generic tools by embedding context-specific icons, like policy flags or economic symbols.
- Base Setup: Align with your theme via global color sync.
- Data Fusion: Merge GIS exports for layered intelligence.
- Visual Polish: Apply textures for terrain hints, like Rockies' ridges.
- Output Options: High-res prints for reports or animated GIFs for social.
It's the compass for continental conversations.
Insider Tips for Continental Mastery
Elevate with narrative arcs: Frame North America as a 'bridge continent,' starting with unity themes. For levity in training sessions, joke about the 'endless' U.S.-Canada border while highlighting shared lakes. Adhere to data privacy by anonymizing sensitive zones.
Sync with QGIS for advanced analytics, or Keynote's notes for speaker cues. Elevate your North America narratives - download this template instantly.
Frequently Asked Questions
Does it cover dependent territories?
Yes, including Puerto Rico and Greenland with editable statuses.
Editable for thematic mapping?
Completely - adapt for climate, economy, or demographics seamlessly.
Suitable for K-12 education?
Ideal, with simplified views for younger learners.
File compatibility beyond Keynote?
Exports flawlessly to Google Slides and PDF.
Updates for border changes?
Quarterly revisions keep it current.