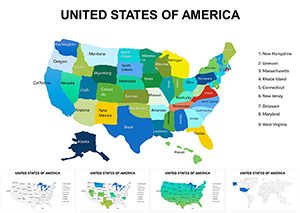
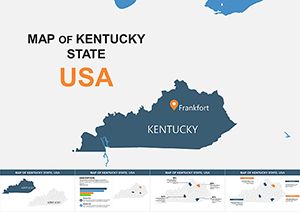
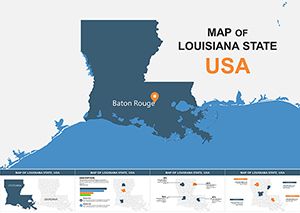
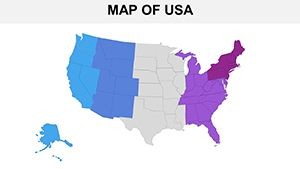
Editable USA States Maps Keynote Template: Visualize Regional Insights Effortlessly


Type: Keynote Maps template
Category: North America
Sources Available: .key
Product ID: KM00062
Template incl.: 20 editable slides
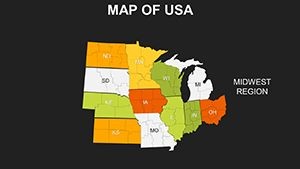
In today's fast-paced world of presentations, where data drives decisions and visuals captivate audiences, having the right tools can make all the difference. Imagine transforming complex U.S. regional information into compelling stories that resonate with stakeholders, educators, or clients. Our Editable USA States Maps Keynote Template does just that, offering 20 meticulously designed slides tailored for Mac, iPad, and iWork users. Whether you're a business analyst highlighting market trends across the Midwest or a teacher explaining historical migrations from the East Coast to the West, this template empowers you to customize every element with ease. Say goodbye to static maps that fall flat - embrace fully editable states, colors, and labels that adapt to your narrative. With compatibility across Keynote versions and a focus on high-resolution clarity, this resource isn't just a download; it's a gateway to professional-grade storytelling that saves time and elevates your delivery.
Unlock the Power of Customizable U.S. Regional Maps
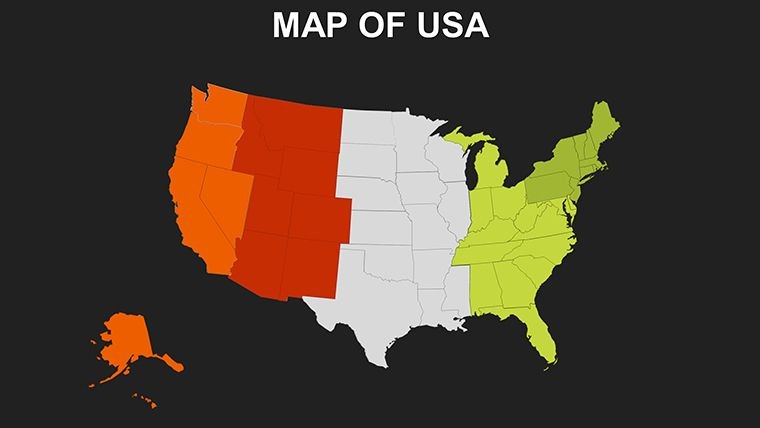
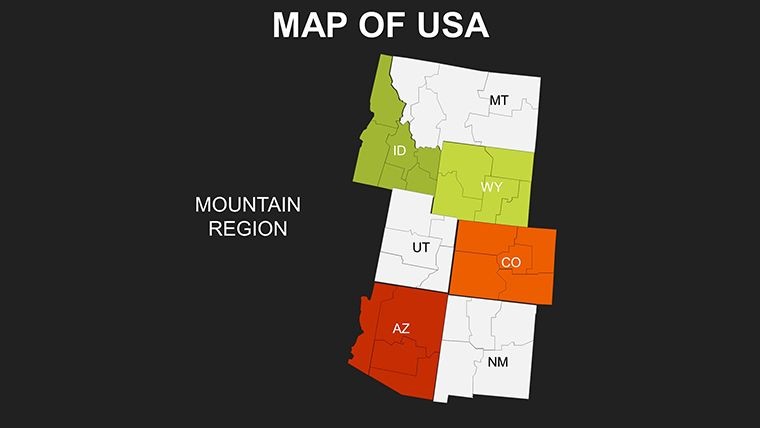
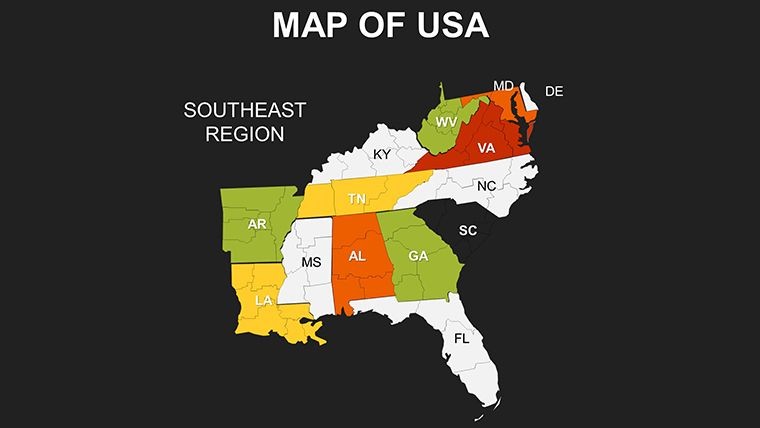
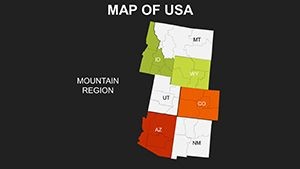
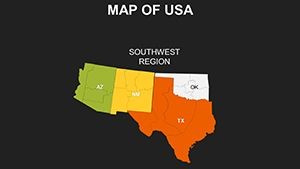
Diving deeper into what makes this template a standout choice, consider the flexibility it brings to your workflow. Each of the 20 slides features individual U.S. states that you can edit independently - perfect for scenarios where you need to spotlight specific regions without overhauling the entire map. For instance, if you're preparing a report on renewable energy adoption, you could color-code states like California in green for high solar integration, Texas in yellow for wind power dominance, and others in neutral tones for comparison. This level of detail isn't just about aesthetics; it's about conveying insights that stick. Built with raster previews for quick loading, the template ensures your presentations run smoothly, even on older devices. Professionals in fields like real estate, where understanding state-specific regulations is key, will appreciate how these maps align with real-world applications, drawing from diverse state histories - from Native American-inspired names like Arizona to colonial echoes in New York.
Key Features That Set This Template Apart
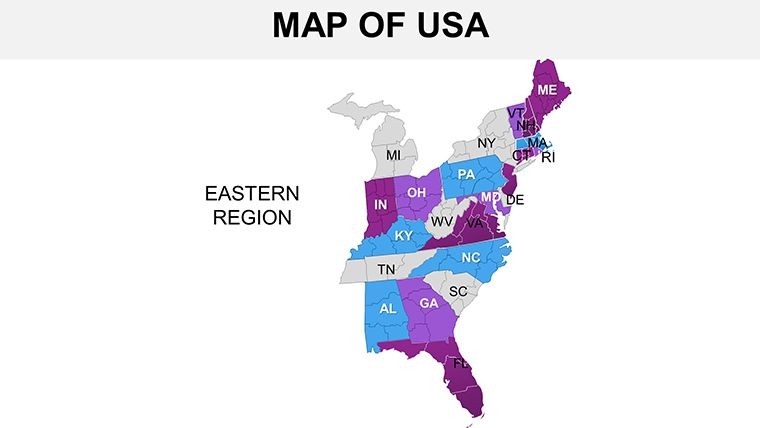
- Full Editability: Adjust borders, fills, and labels for each of the 50 states, allowing precise highlighting - ideal for demographic breakdowns or electoral analyses.
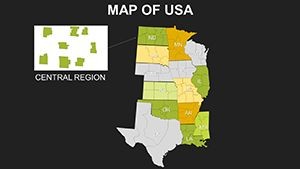
- High-Resolution Design: Ensures crisp visuals on large screens or projectors, maintaining quality during zoom-ins for detailed discussions.
- Seamless Integration: Compatible with Keynote on Mac and iPad, with no additional software needed - just open, edit, and present.
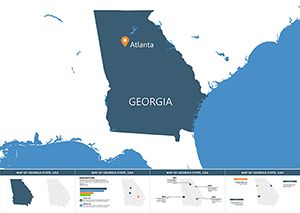
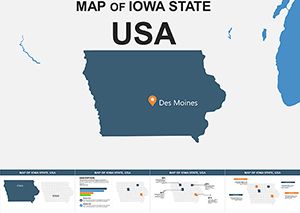
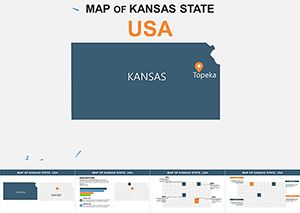
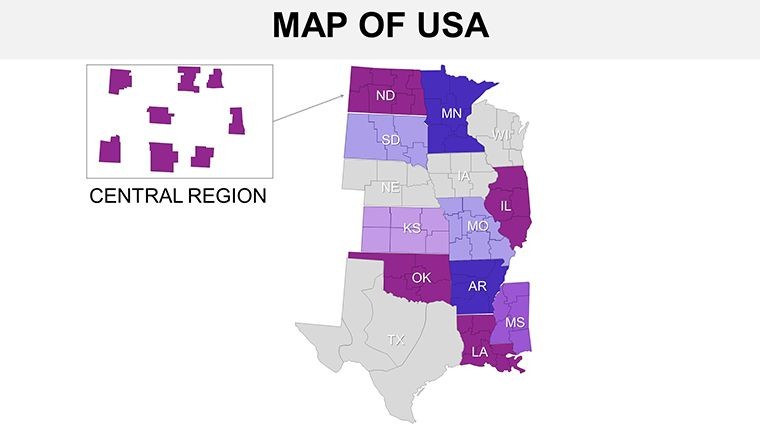
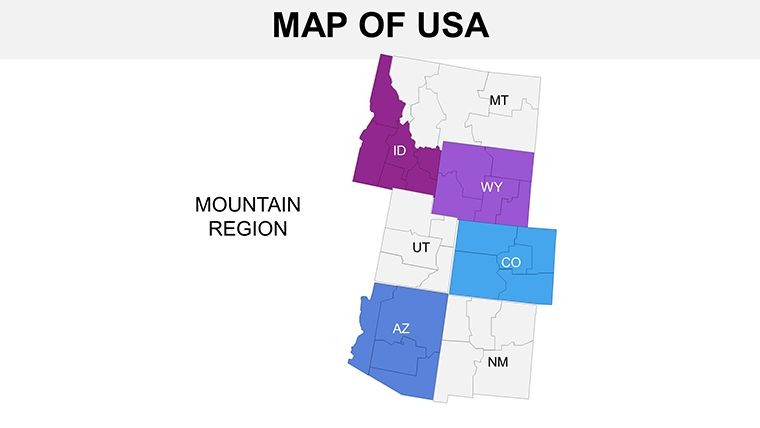
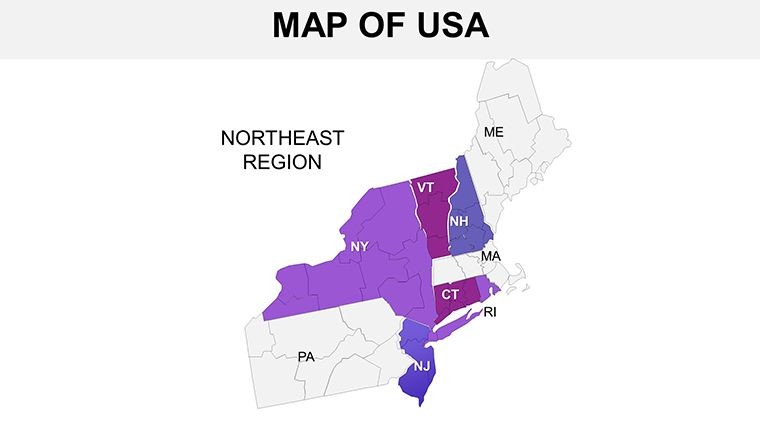
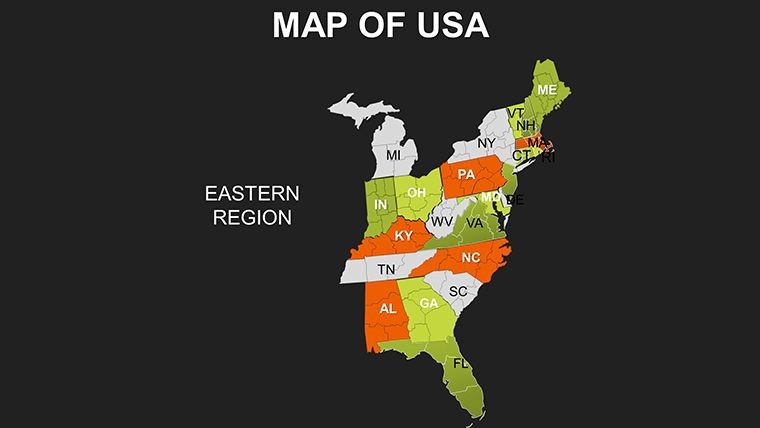
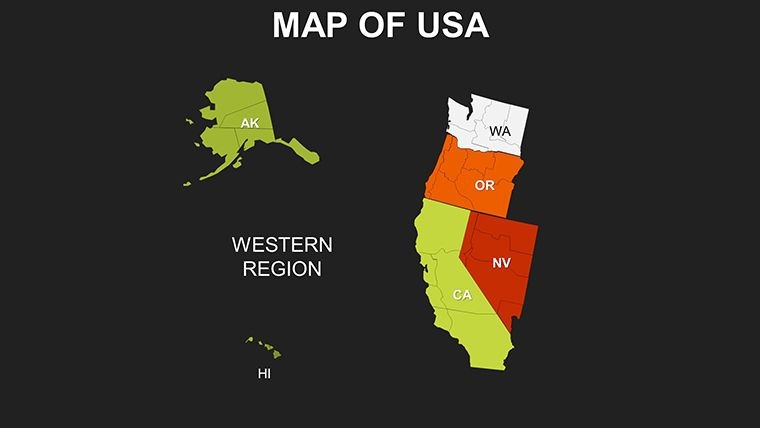
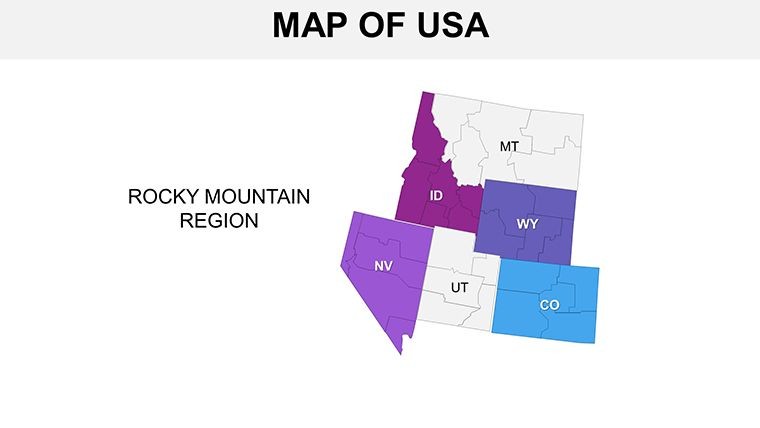
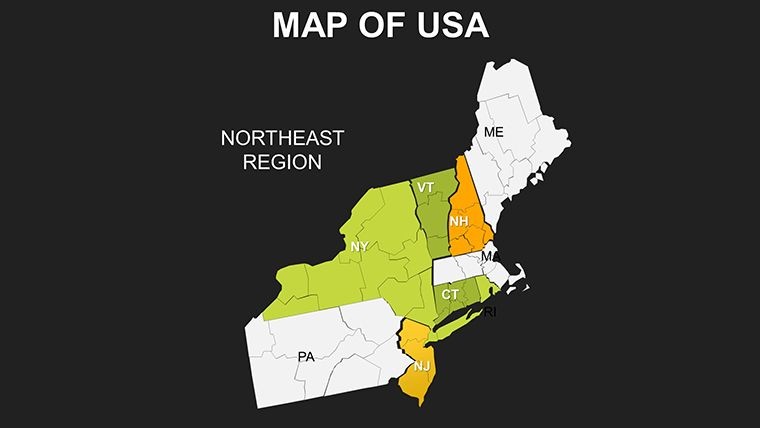
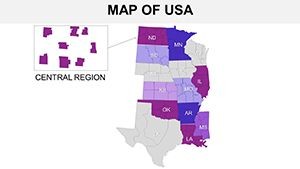
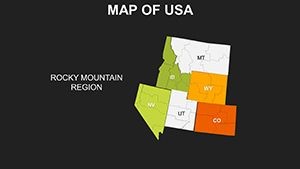
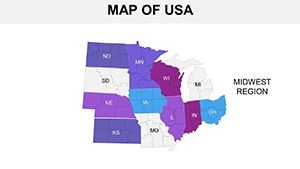
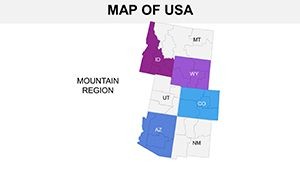
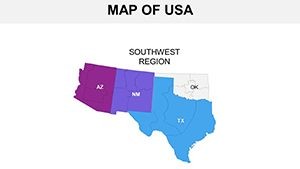
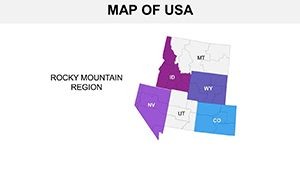
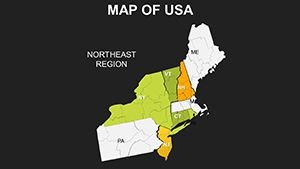
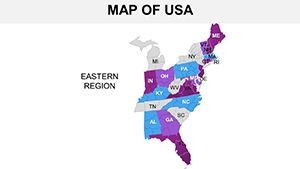
- Versatile Layouts: From overview maps to zoomed-in regional clusters, like the Northeast corridor for urban planning pitches.
- User-Friendly Tools: Intuitive drag-and-drop elements let you add icons, charts, or text overlays without design expertise.
Beyond these features, the template's design draws inspiration from best practices in data visualization, akin to those recommended by the American Institute of Graphic Arts (AIGA), emphasizing clarity and accessibility. This means your maps won't just look good - they'll communicate effectively, reducing audience confusion and boosting engagement.
Real-World Applications: From Education to Enterprise
Let's explore how this template shines in practical settings. Educators crafting lessons on U.S. geography can use it to illustrate state sovereignty and internal governance, as outlined in the U.S. Constitution. Picture a classroom where students interactively explore why states like Hawaii have unique cultural influences, with editable slides allowing real-time annotations. In the corporate realm, marketing teams might leverage it for sales territory mapping - highlighting high-potential areas in the Sun Belt for expansion strategies. A case in point: A logistics firm could customize maps to show supply chain routes from ports in Florida to distribution centers in the Rockies, incorporating data overlays for efficiency metrics. Even non-profits focused on environmental advocacy can benefit, using color gradients to depict climate change impacts across the Great Plains versus coastal states. These applications aren't hypothetical; they're drawn from real user feedback in presentation design communities, where tools like this have streamlined workflows and led to more persuasive outcomes.
Step-by-Step Guide to Maximizing Your Maps
- Import and Setup: Download the .key file and open it in Keynote - your canvas awaits with pre-loaded U.S. outlines.
- Customize Regions: Select a state, like Illinois, and tweak its color to represent economic data, adding labels for key cities like Chicago.
- Integrate Data: Embed charts or graphs directly onto the map, such as pie charts showing population diversity in multicultural states.
- Enhance with Elements: Add thematic icons - think oil rigs for Texas or tech symbols for Silicon Valley - to make your narrative pop.
- Present and Iterate: Use Keynote's rehearsal tools to fine-tune transitions, ensuring your regional story flows seamlessly.
This structured approach not only saves hours but also aligns with expert tips from presentation gurus like Nancy Duarte, who advocate for story-driven visuals that guide audiences through complex information.
Why This Template Outperforms Basic Alternatives
Compared to generic Keynote shapes or free online maps, this template offers superior depth. Basic tools often lack the precision for state-level edits, leading to clunky results that dilute your message. Here, every slide is optimized for impact, with built-in scalability that maintains integrity across devices. For example, while a standard map might pixelate when enlarged, our high-res designs hold up, making them ideal for hybrid meetings where some attendees view on tablets. Moreover, the inclusion of 20 varied layouts - from full-country overviews to sectional focuses like the Pacific Northwest - provides more variety than competitors, reducing the need for multiple downloads. Users in government sectors, dealing with federal-state dynamics, find this especially valuable for compliance-focused presentations that require accurate representations.
To further enhance trustworthiness, we've ensured the template adheres to accessibility standards, with options for high-contrast modes that aid color-blind viewers. This thoughtful design reflects our commitment to inclusive tools, drawing from guidelines by organizations like the Web Accessibility Initiative.
Elevate Your Presentations with Regional Precision
As you wrap up your next big pitch or lecture, remember that effective communication hinges on visuals that inform and inspire. This Editable USA States Maps Keynote Template bridges that gap, turning raw geography into actionable insights. Whether dissecting economic variances between the Rust Belt and the South or planning cross-country campaigns, its adaptability ensures you're always one step ahead. Don't settle for mediocre maps - customize yours now and watch your ideas take flight.
Frequently Asked Questions
- How editable are the individual states in this template?
- Every state is fully customizable, from colors and borders to labels and added elements, giving you complete control.
- Is this compatible with the latest Keynote on iPad?
- Yes, it's designed for seamless use across Mac, iPad, and iWork, with no version-specific limitations noted.
- Can I use this for commercial presentations?
- Absolutely - it's perfect for business, education, or any professional setting, with no usage restrictions.
- What if I need to highlight multiple regions at once?
- Group states easily in Keynote and apply uniform edits, ideal for regional clusters like the Midwest.
- Are there free updates available?
- While not specified, our templates often include access to future enhancements - check your download for details.