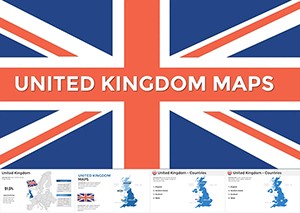
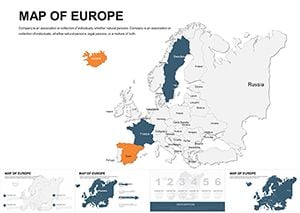
UK Editable Keynote Maps Template 2024: Precision Mapping for Modern Narratives


Type: Keynote Maps template
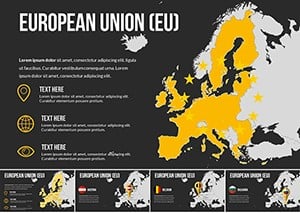
Category: Europe
Sources Available: .key
Product ID: KM00055
Template incl.: 44 editable slides
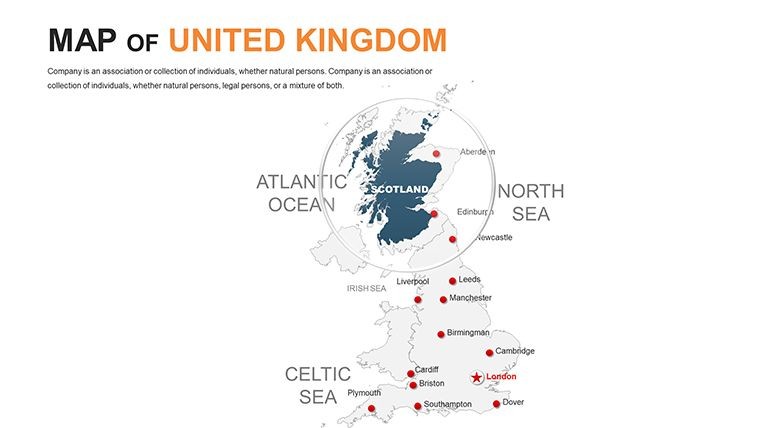
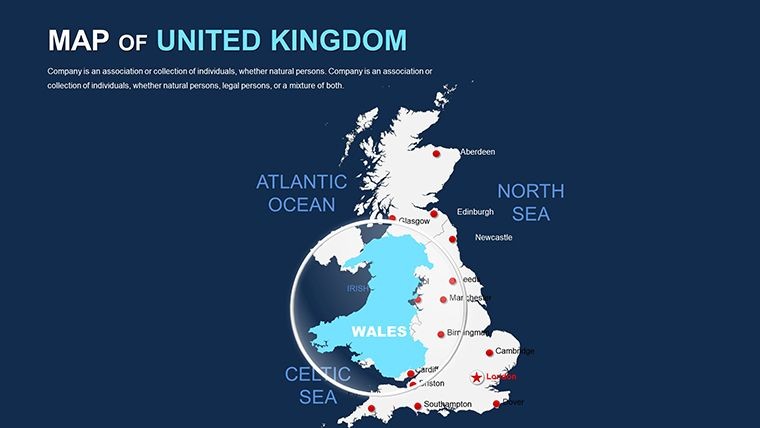
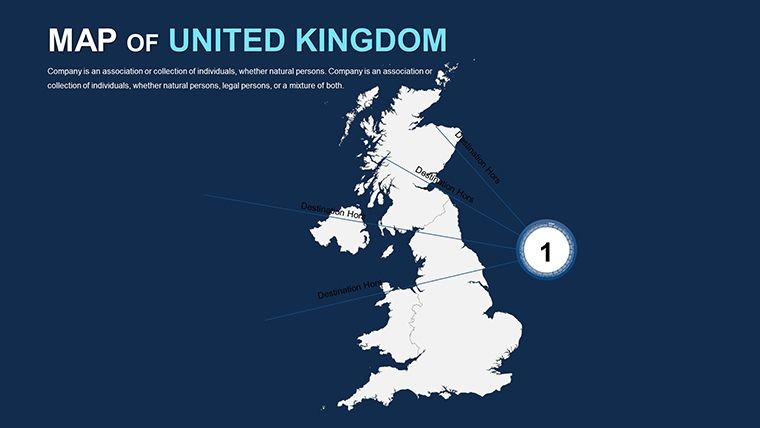
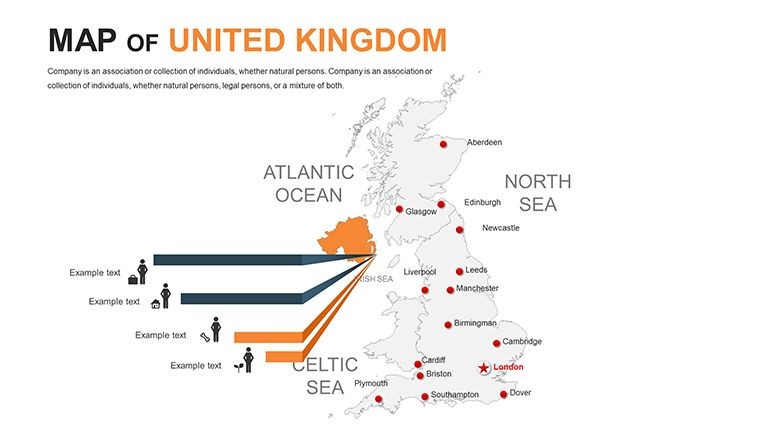
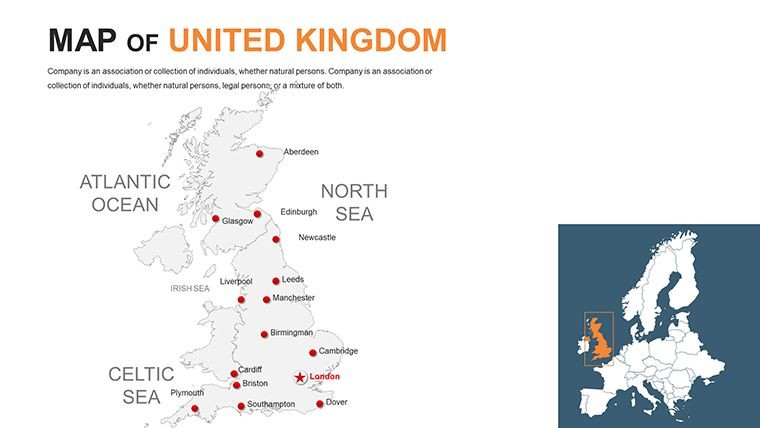
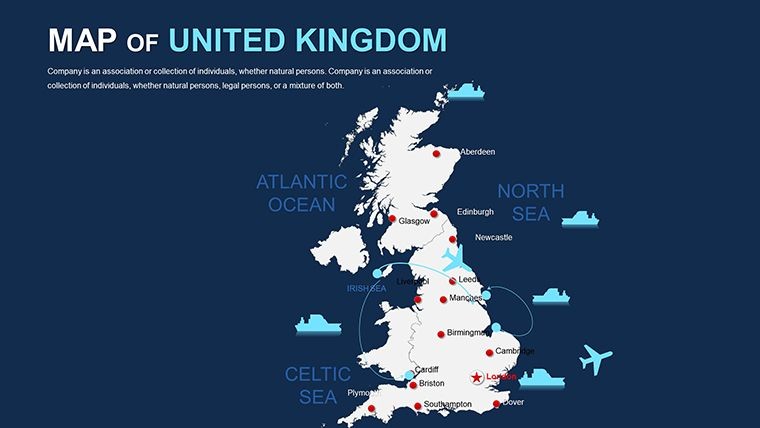
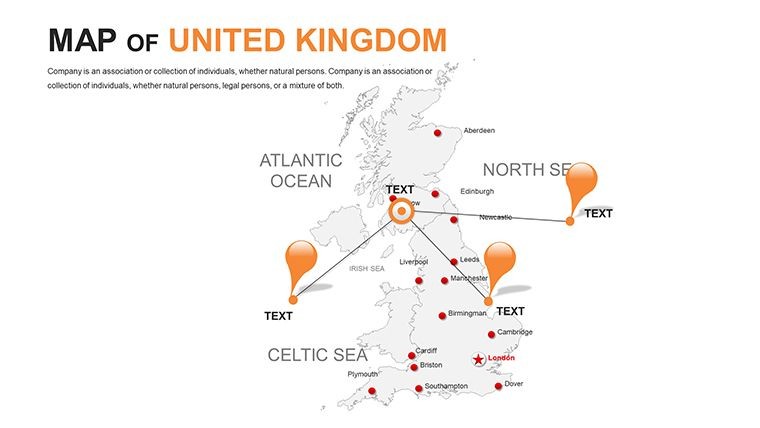
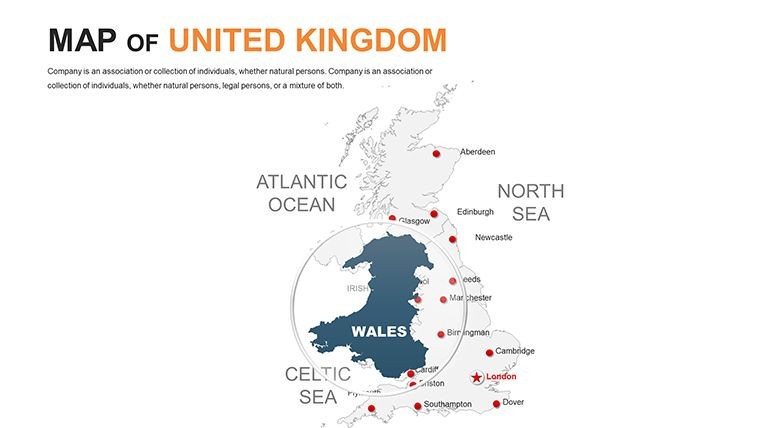
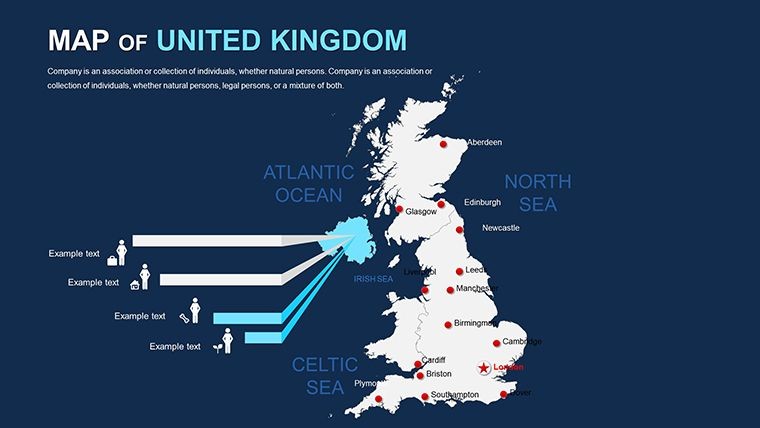
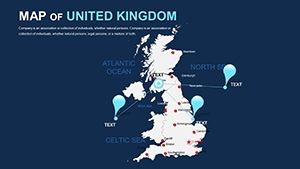
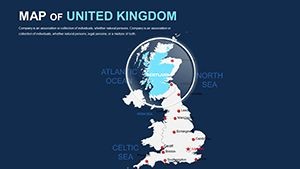
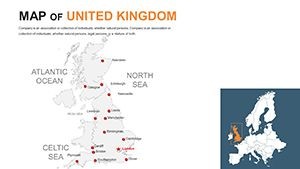
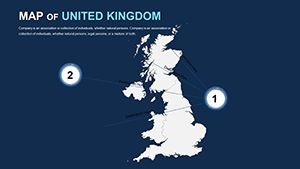
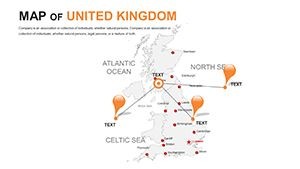
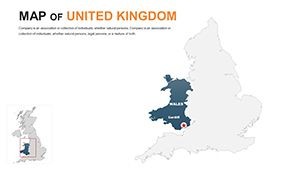
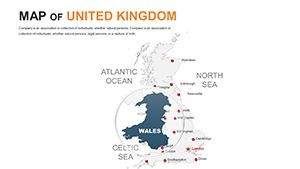
Unleash the potential of the United Kingdom's intricate geography with the 2024 UK Editable Keynote Maps Template, featuring 44 editable slides that blend tradition with innovation. Perfect for educators exploring British history, business analysts navigating post-Brexit landscapes, and consultants decoding regional disparities from London to the Scottish Highlands, this template delivers visuals that inform and inspire. Whether charting economic hubs in Manchester or cultural sites in Wales, it positions you as a master storyteller in any forum.
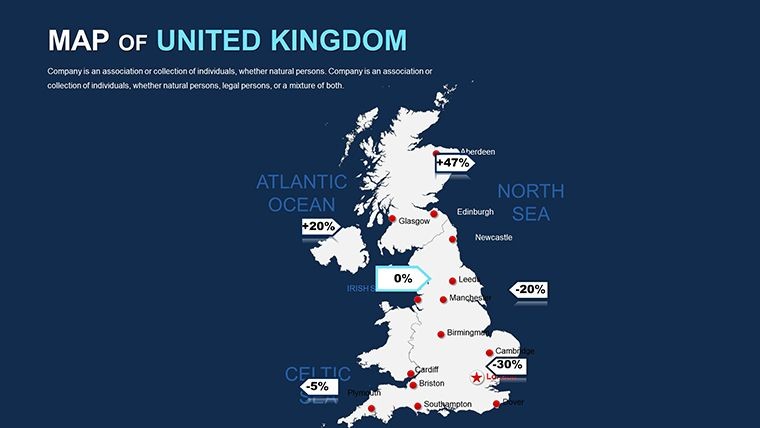
Backed by Ordnance Survey-level accuracy and aligned with UK government data standards, this latest edition ensures your maps reflect current realities like devolved powers or urban regeneration projects. Keynote's robust platform allows intuitive tweaks - resize counties, color-code constituencies, or embed stats on tourism in Cornwall - making complex topics accessible. In today's data-saturated world, these maps cut through noise, fostering informed discussions and strategic wins.
Key Innovations in the 2024 Template
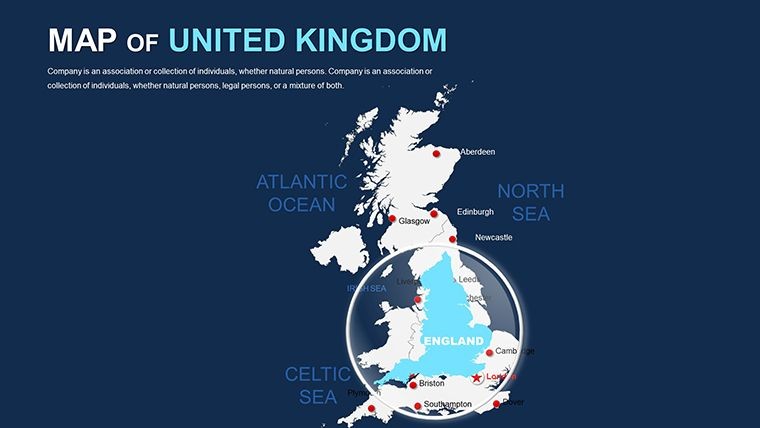
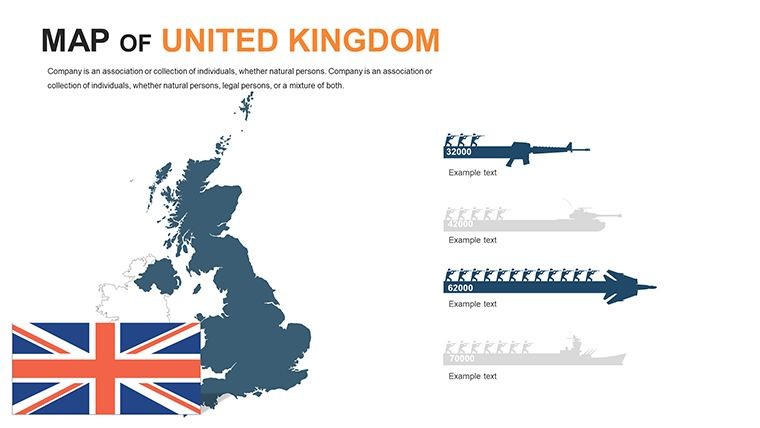
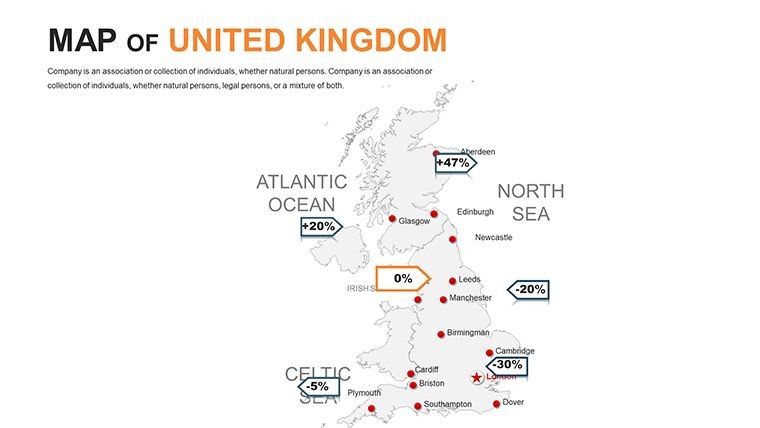
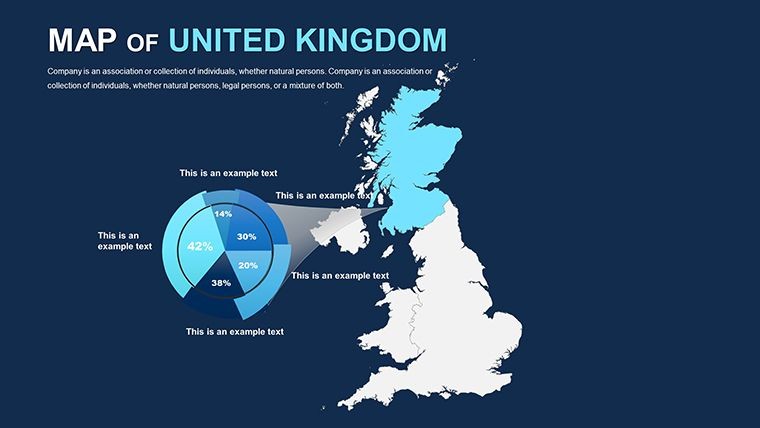
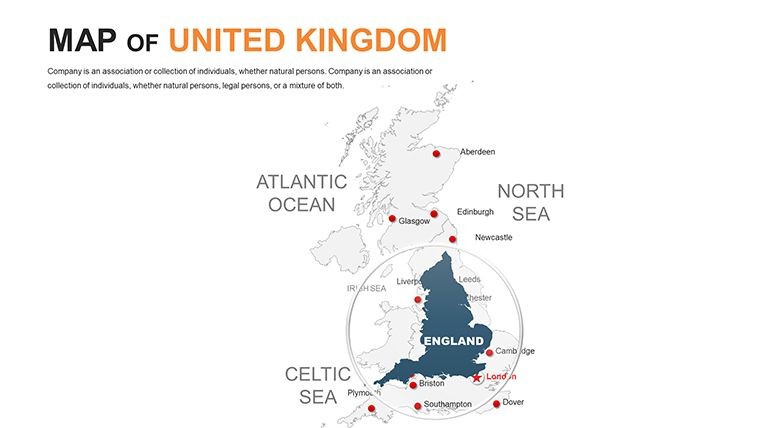
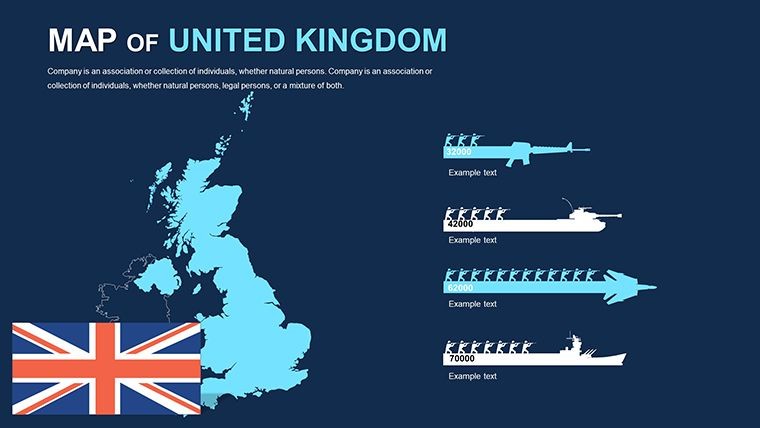
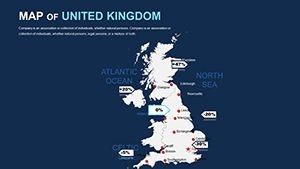
This version introduces enhanced demographic layers, capturing nuances like population densities in the Midlands or renewable energy sites in the North Sea. All elements are vector-sharp, supporting 4K exports for hybrid events.
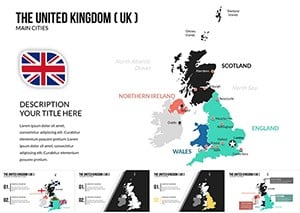
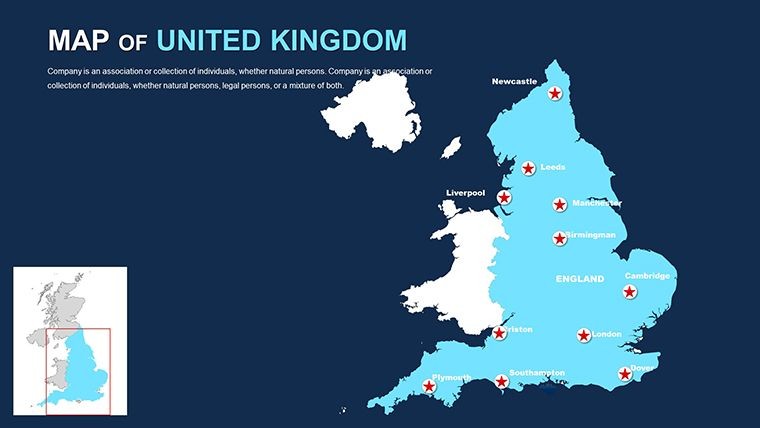
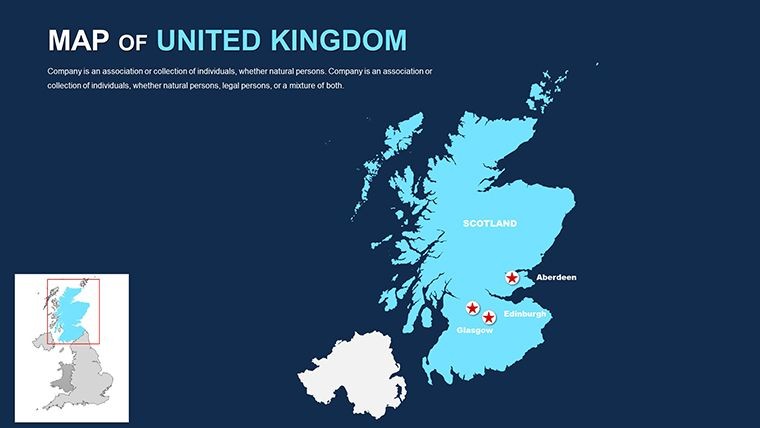
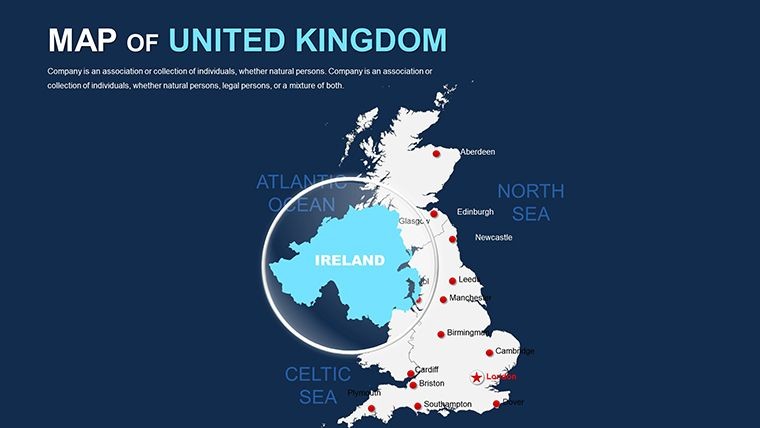
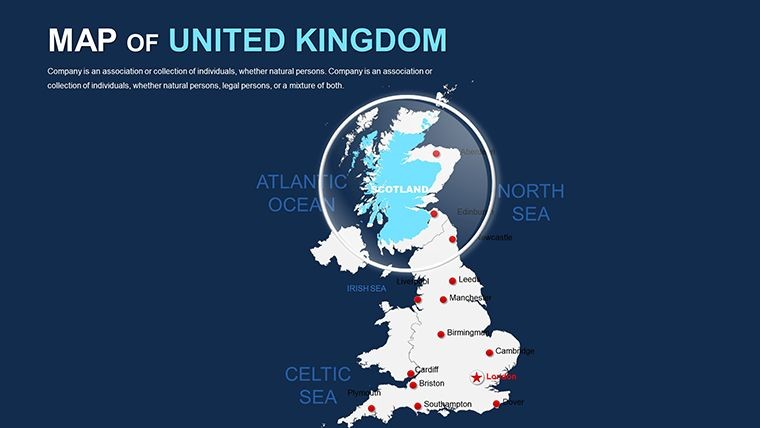
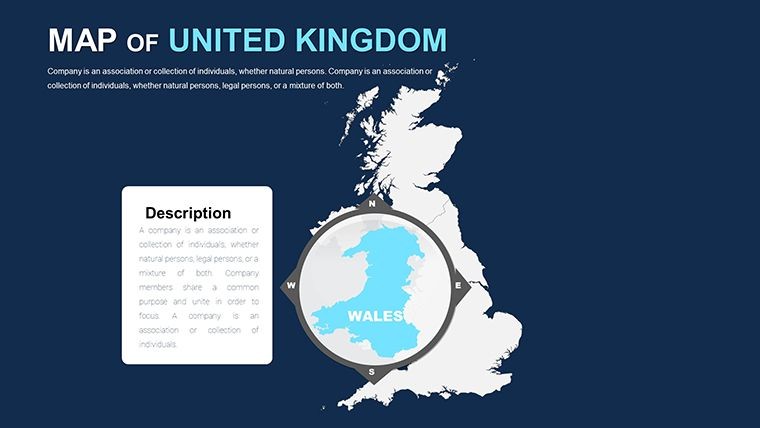
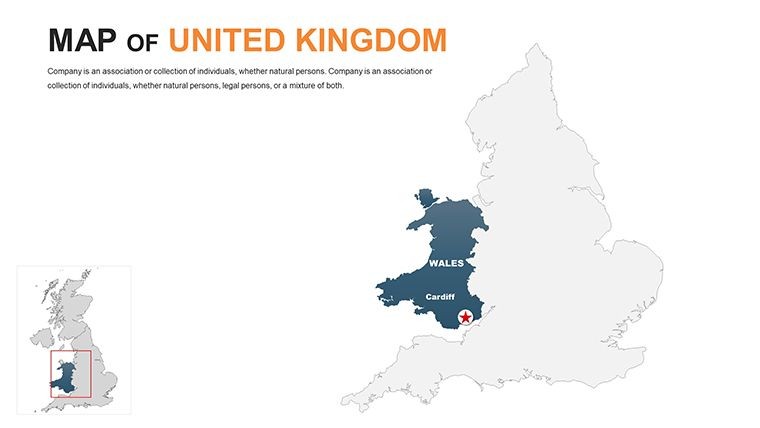
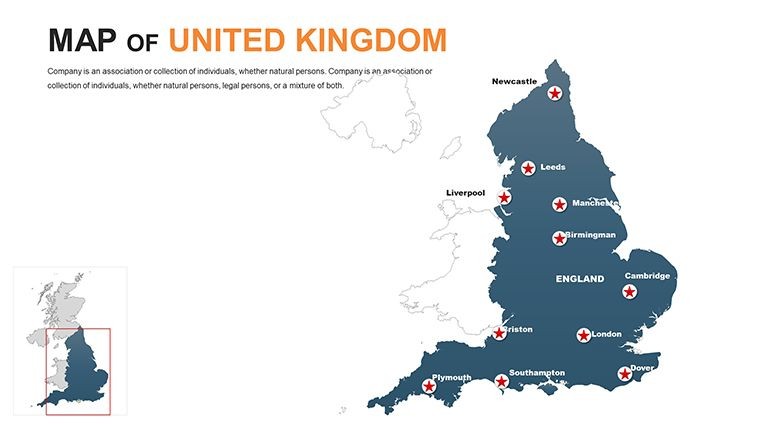
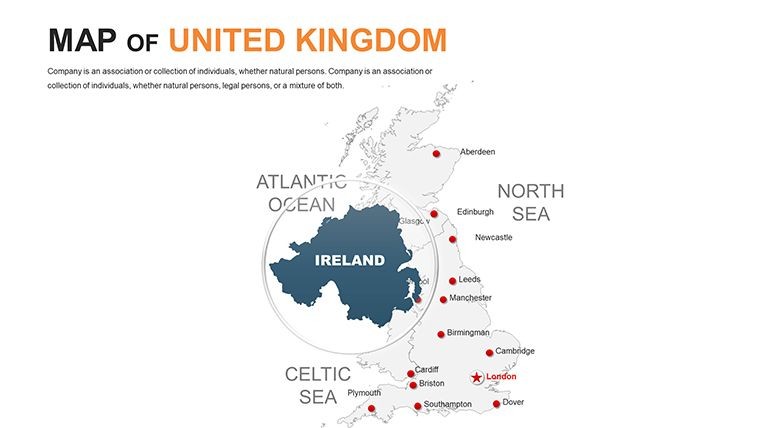
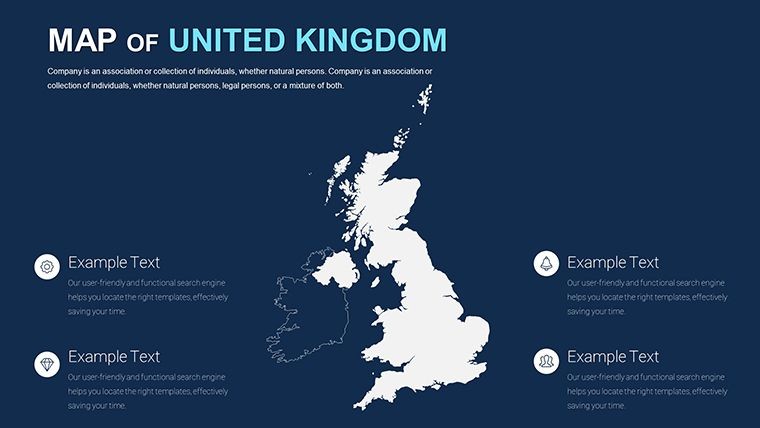
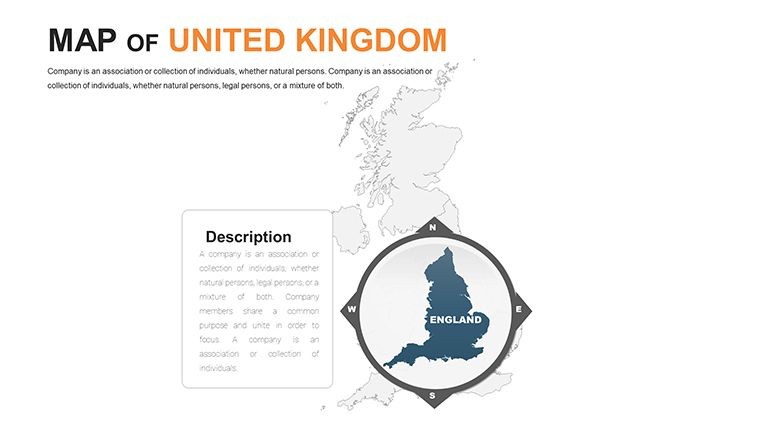
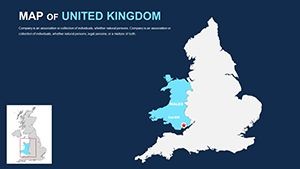
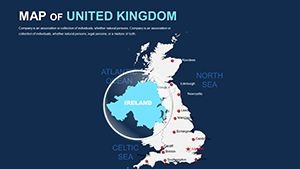
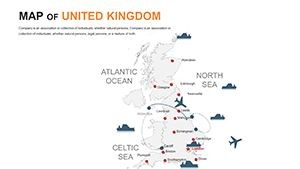
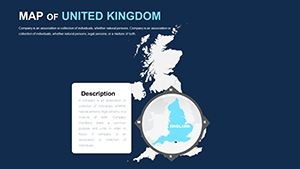
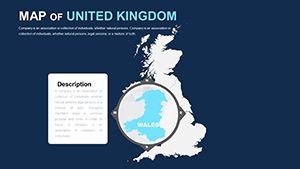
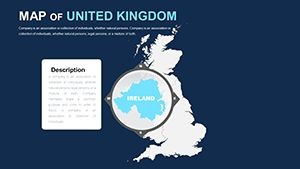
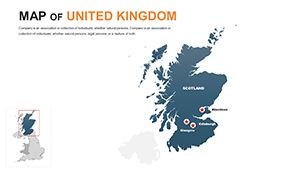
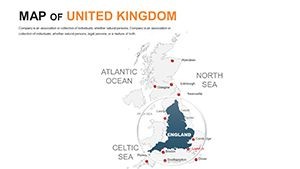
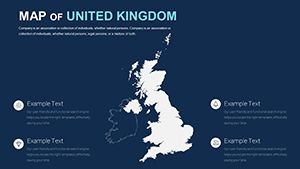
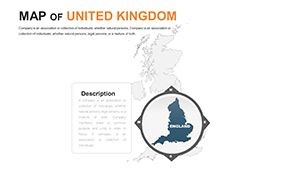
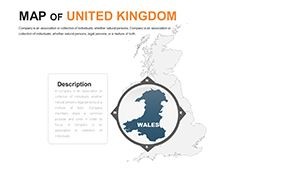
- Targeted Regional Focus: 44 slides covering England, Scotland, Wales, Northern Ireland with political, regional, and demographic views.
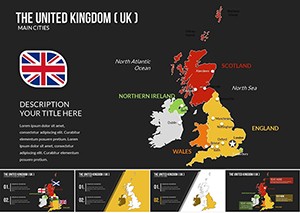
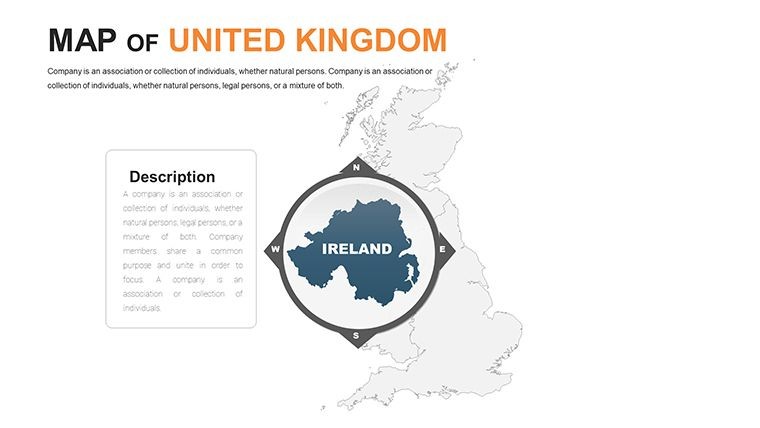
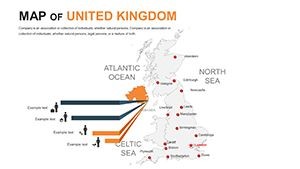
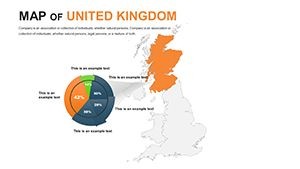
- Smart Editing Suite: One-click recoloring for themes like heritage sites (e.g., Stonehenge icons), plus data import for seamless stats overlay.
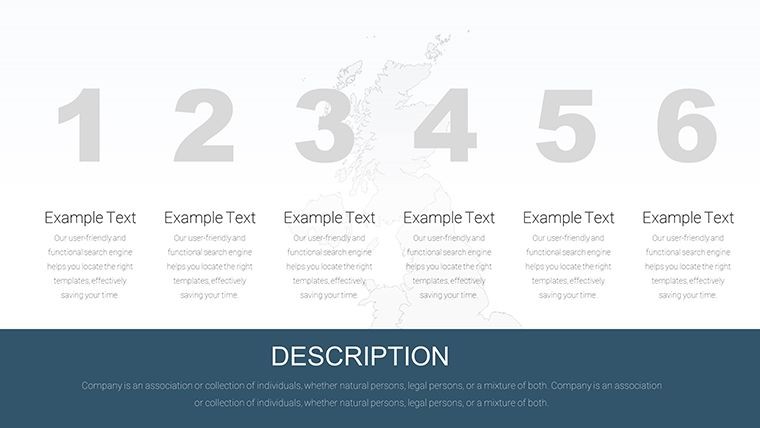
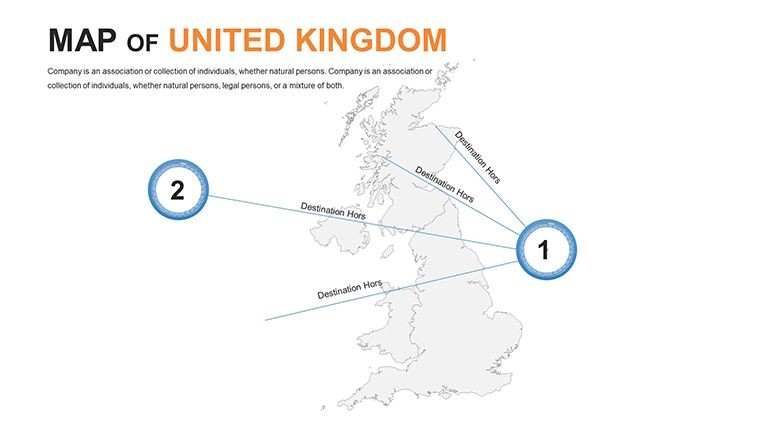
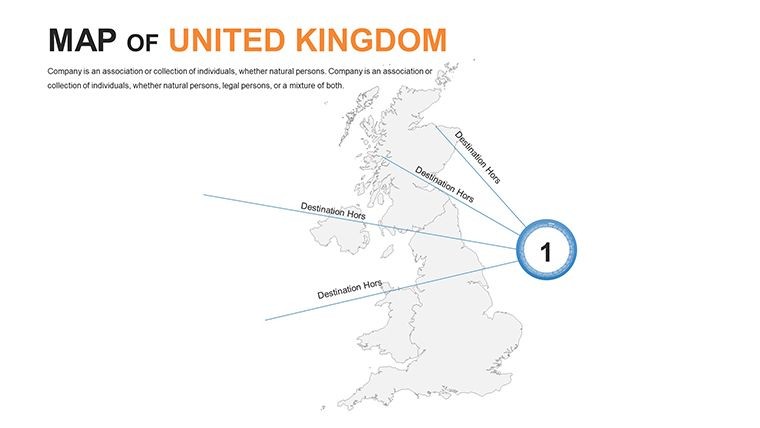
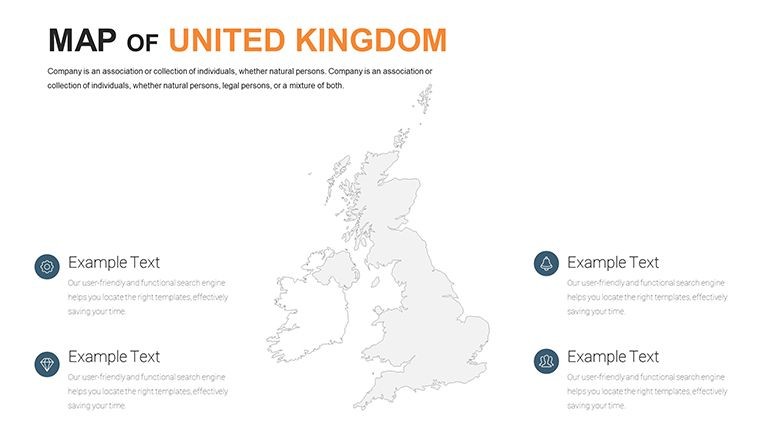
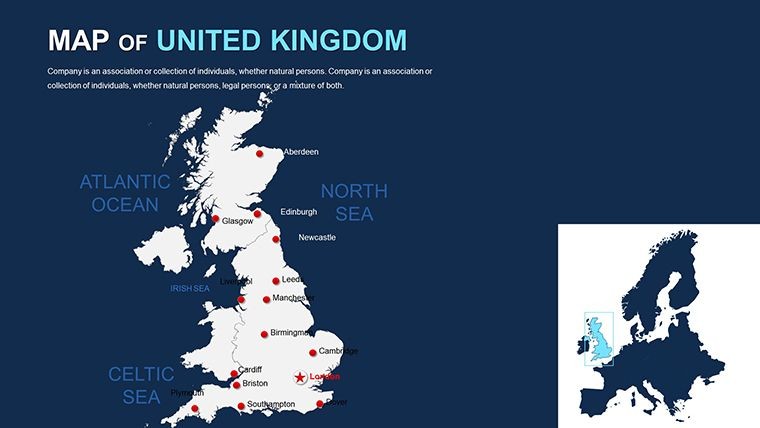
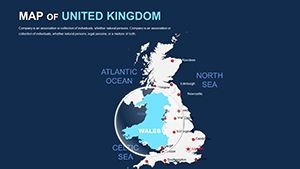
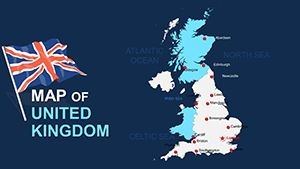
- Dynamic Variants: From outline maps for broad overviews to detailed insets for cities like Edinburgh.
- Accessibility Built-In: High-contrast options and alt-text prompts for inclusive presentations.
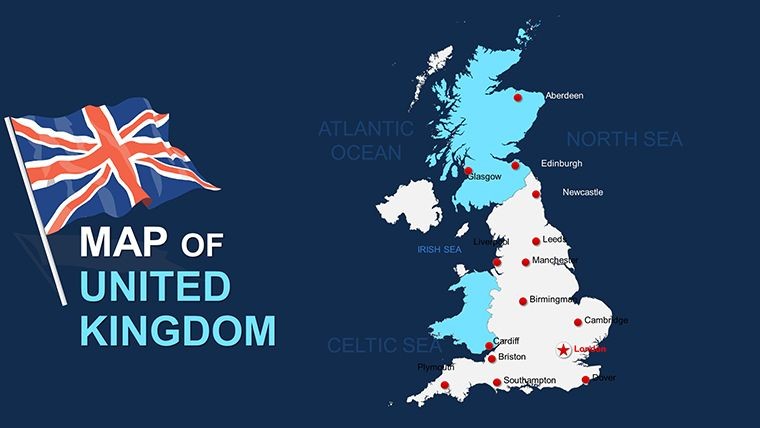
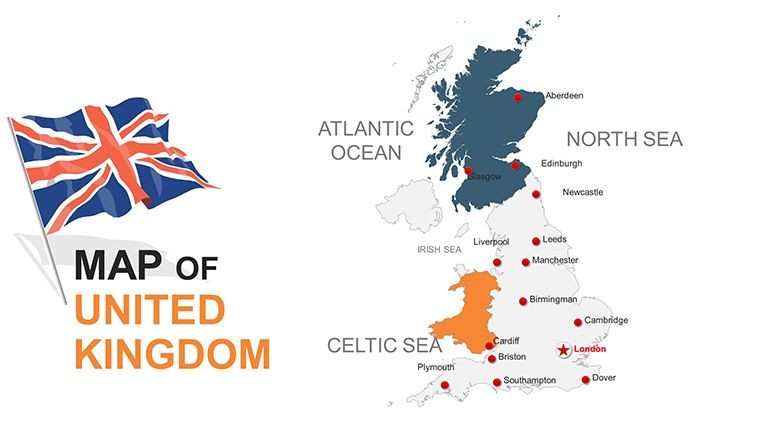
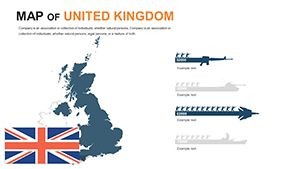
Superior to standard tools, it pre-includes UK-specific motifs - think Union Jack accents or rail network paths - streamlining creation for time-crunched pros. Policy advisors have used it to illustrate levelling-up initiatives, swaying stakeholders with crystal-clear projections.
Practical Use Cases: Tailored for UK Contexts
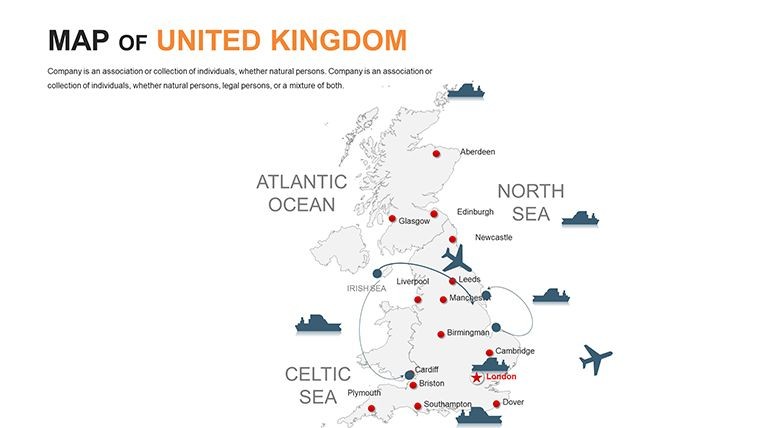
Educators animate the Industrial Revolution's spread from Birmingham factories to Liverpool ports, captivating classes with layered timelines. Business teams map supply chains post-Brexit, highlighting EU trade routes and domestic alternatives for resilient strategies.
Consultants visualize healthcare disparities, using demographic maps to pinpoint rural needs in the Lake District versus urban demands in Belfast. For real estate pitches, overlay property trends on regional views, showcasing growth in the Thames Valley. The process is efficient: Load the file, choose a base (e.g., Scotland's isles), add annotations like wind farm locations, animate reveals, and iterate - professional results in moments.
- Scope Your Story: Select maps matching needs, such as political for election analyses.
- Infuse Data: Link to ONS figures for unemployment rates in Yorkshire.
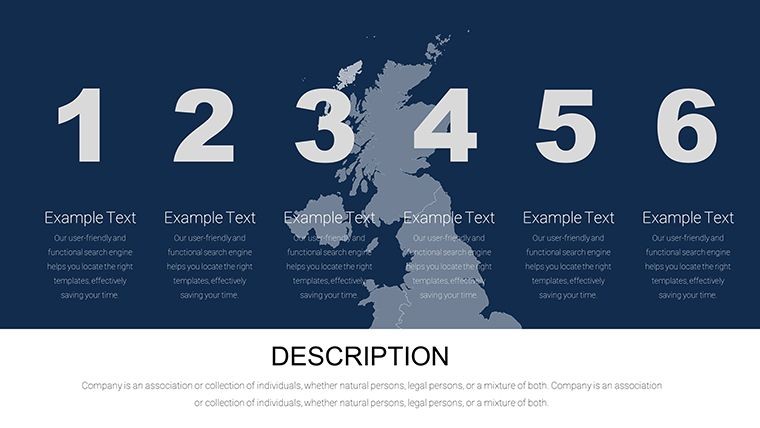
- Enhance Engagement: Use builds to unveil devolution impacts progressively.
- Distribute Effectively: Export for web or print, optimizing for audience platforms.
A notable example: An Edinburgh-based firm employed these maps in a sustainability report on Highland renewables, securing funding through evocative visuals of wind turbines dotting the moors. This template turns insights into influence.
Strategic Tips for Optimal Use
Employ subtle animations for transitions between regions, like fading from Welsh valleys to Irish coasts, to maintain flow. Pair with charts for hybrid views, such as GDP per capita in London alongside national averages. For compliance, watermark sensitive data, building trust in advisory roles.
A lecturer from Oxford praised its role in Brexit impact seminars, noting how editable layers facilitated real-time updates during debates. Leverage it to craft narratives that resonate deeply.
The Forward-Thinking Edge of 2024
As the UK evolves with net-zero goals and regional autonomy, this template's adaptability ensures longevity. It's your ally in visualization. Download and define your UK story with unmatched clarity!
Transform your approach today. Acquire the UK Editable Keynote Maps 2024 and map success across the realms!
Frequently Asked Questions
Does it include Northern Ireland specifics?
Yes, dedicated slides for all UK nations, including border details and cultural markers.
Can I integrate real-time data?
Editable fields support embeds from APIs like UK Gov stats for live updates.
Are animations customizable?
Fully - adjust speeds and sequences for tailored pacing in educational or corporate settings.
How does it handle scale variations?
Vector design allows zooming from national to local levels without quality loss.
Is it suitable for policy presentations?
Ideal, with neutral designs that align with governmental visualization guidelines.