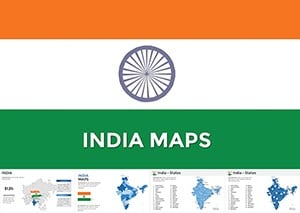
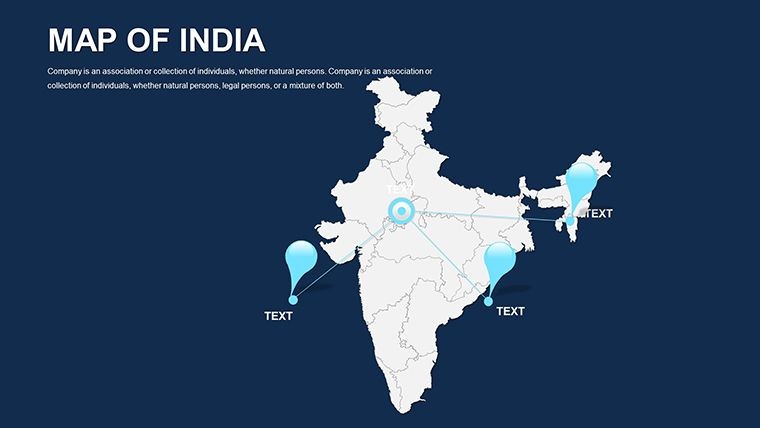
India Keynote Map Template - Fully Editable KEY


Type: Keynote Maps template
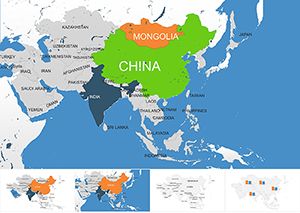
Category: Asia
Sources Available: .key
Product ID: KM00048
Template incl.: 44 editable slides
What is a Keynote map template? A Keynote map template is a pre-built .key file containing vector geographic slides that open natively in Apple Keynote, allowing users to recolor states, update labels, and overlay data without drawing territory outlines from scratch.
Package Contents
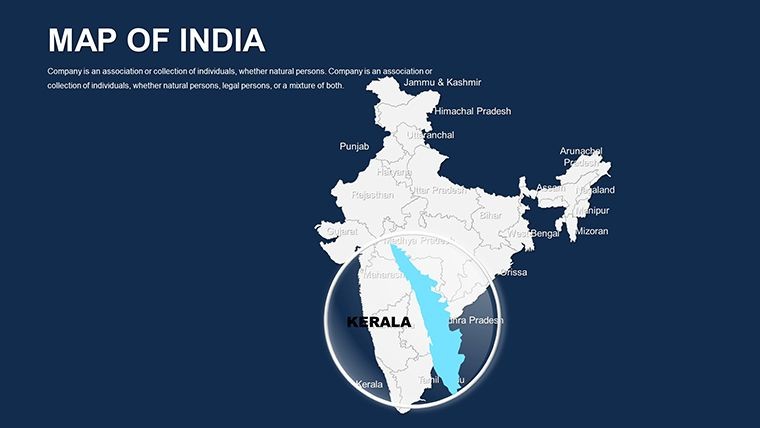
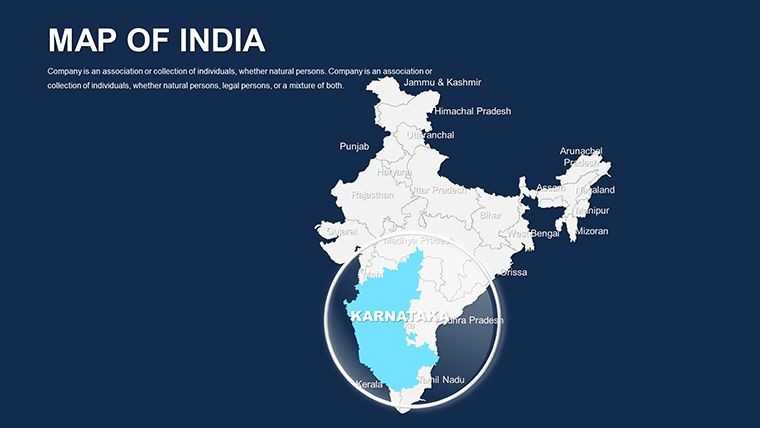
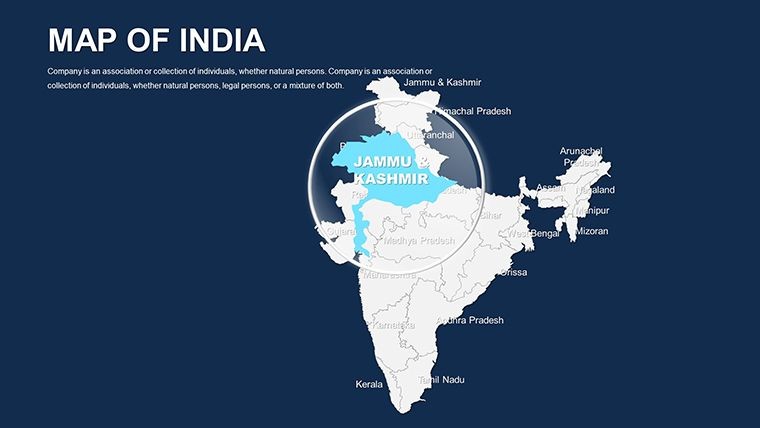
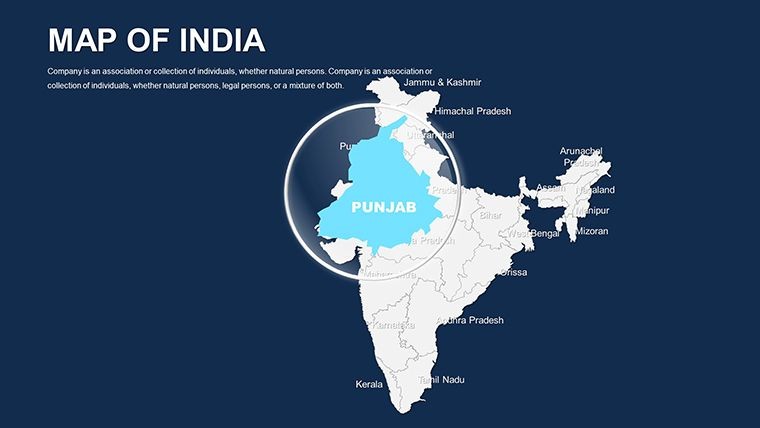
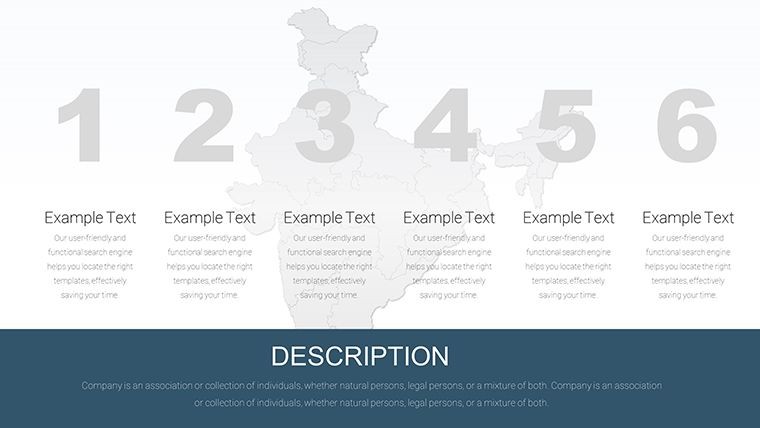
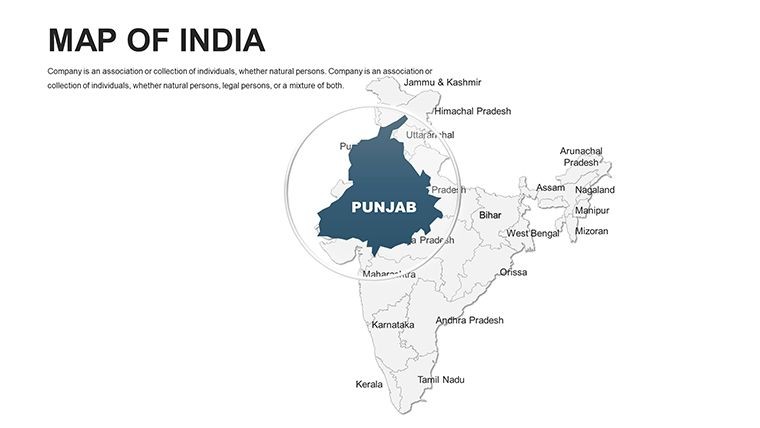
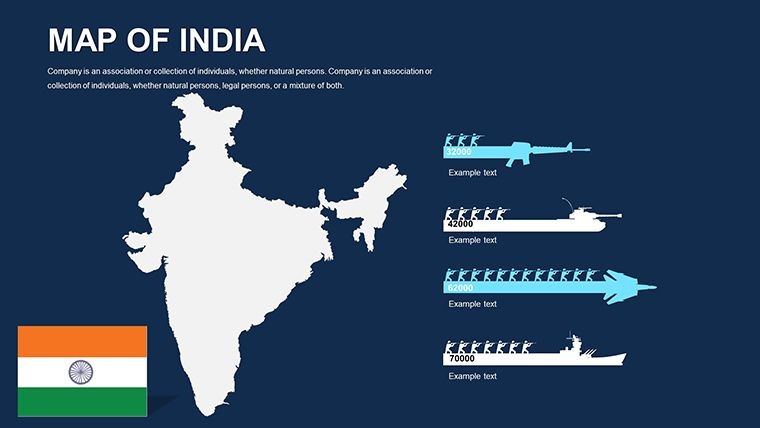
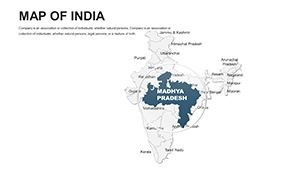
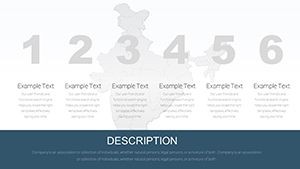
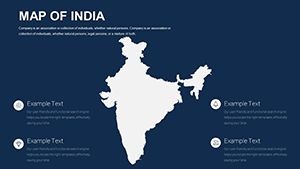
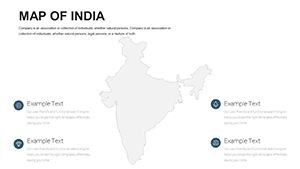
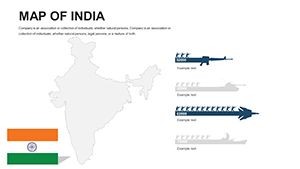
44 editable slides cover India's full political and geographic range - from national overview layouts to individual state and union territory outlines. Each slide is built on vector paths, so state shapes scale without quality loss and respond directly to Keynote's fill, stroke, and text tools. The file downloads as a single .key format document, compatible with Apple Keynote 12 and later.
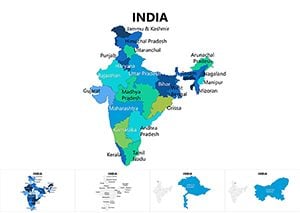
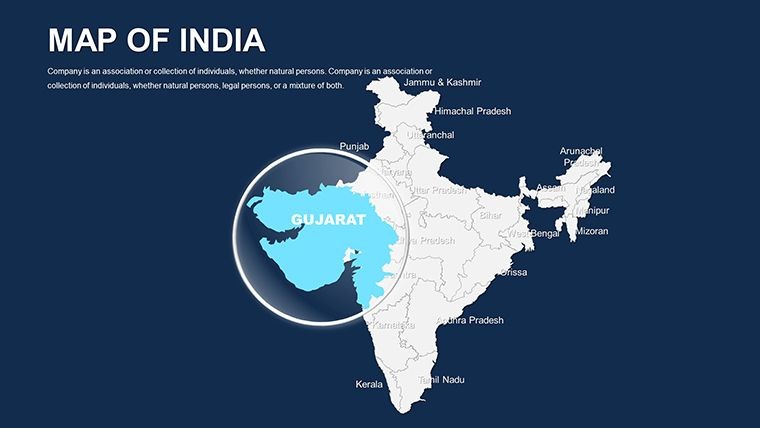
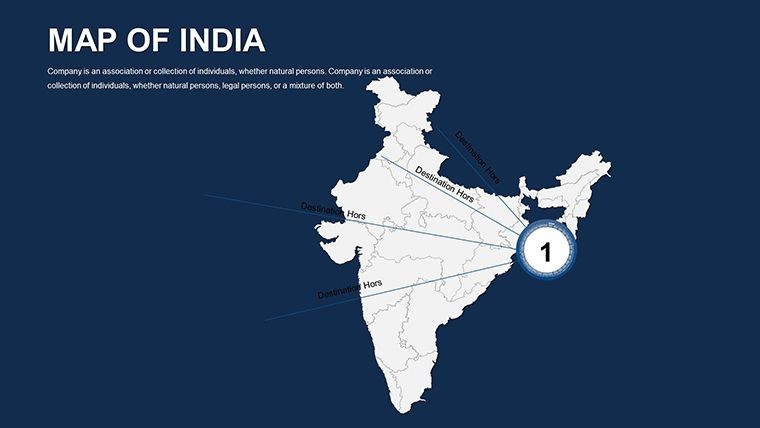
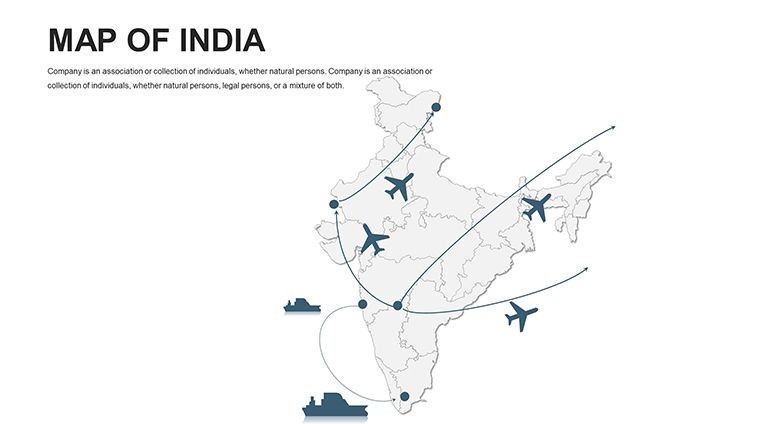
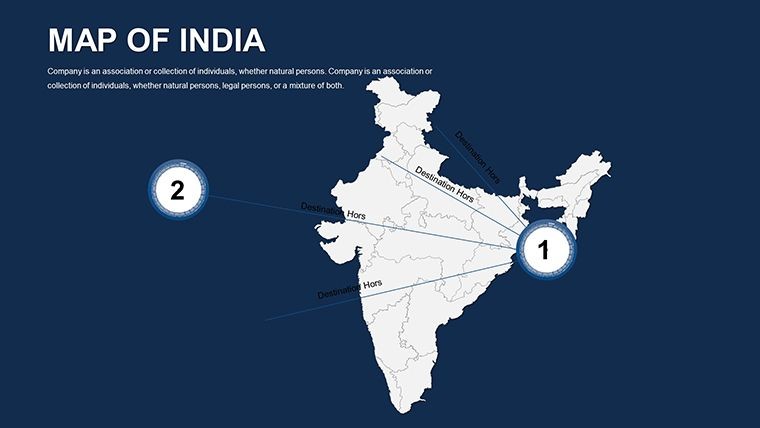
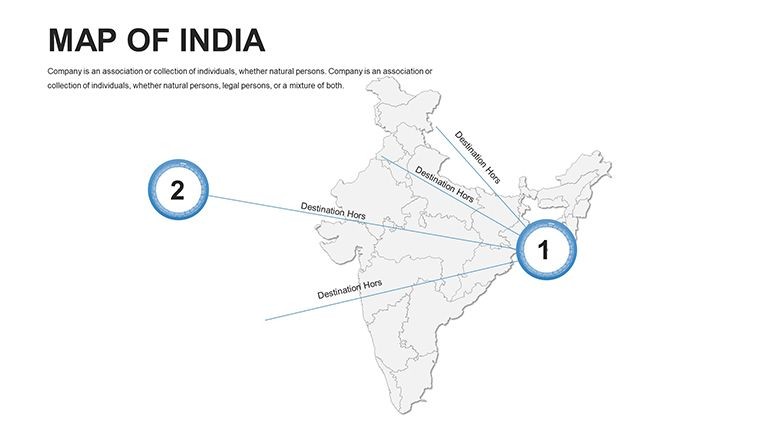
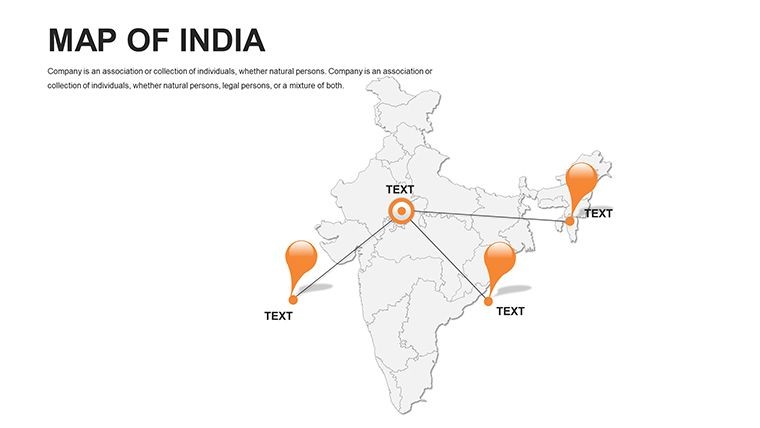
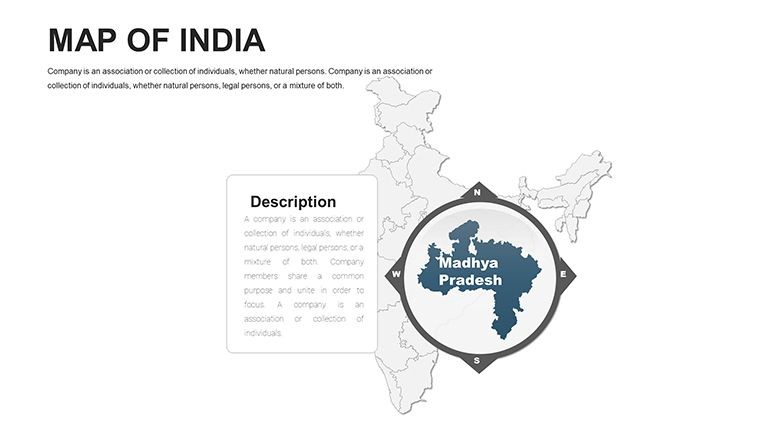
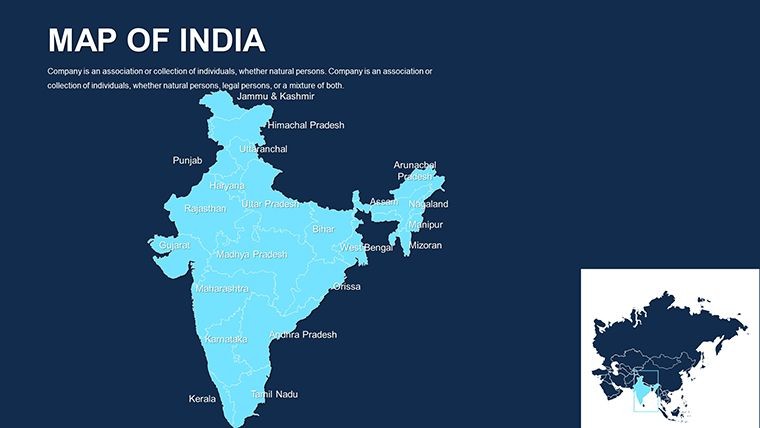
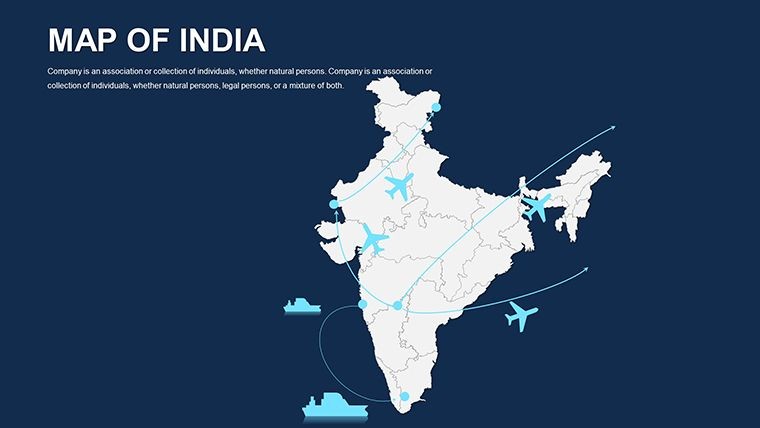
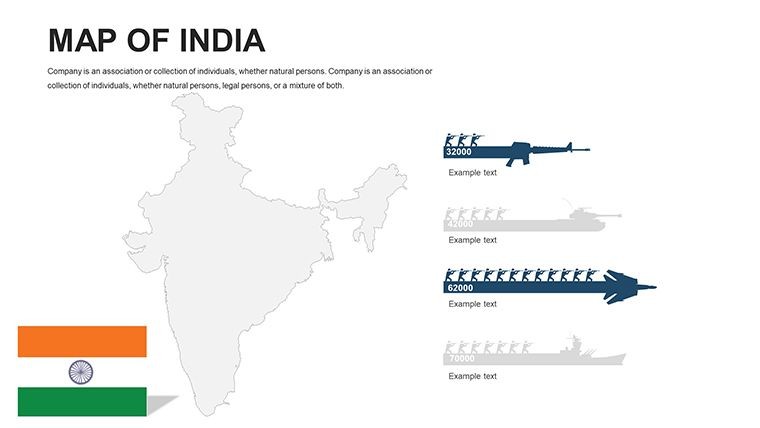
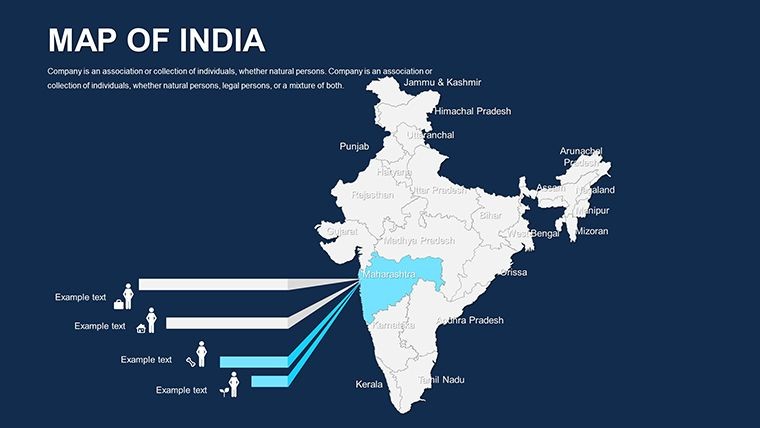
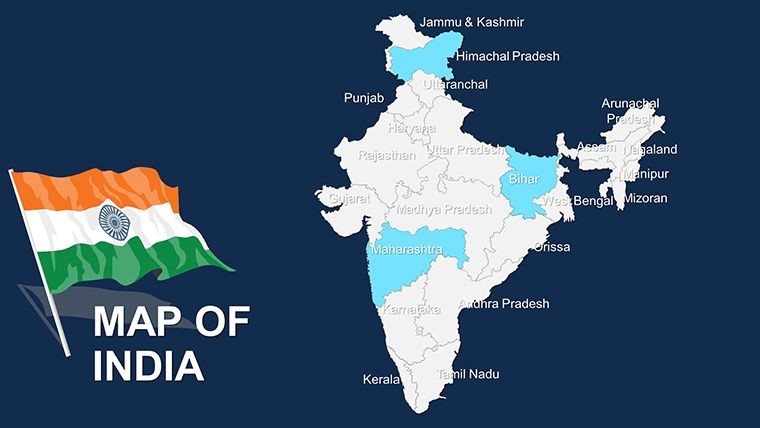
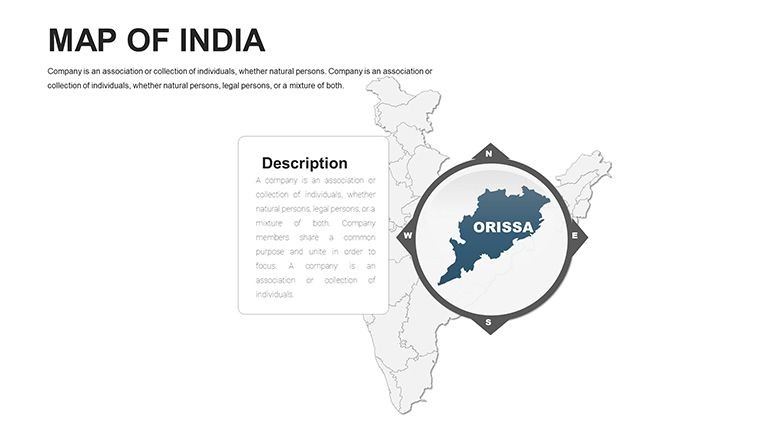
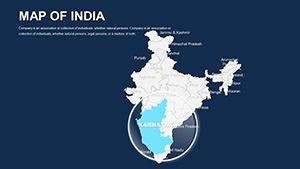
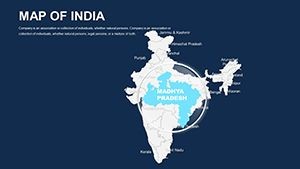
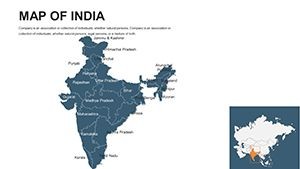
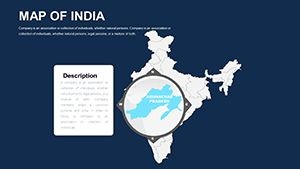
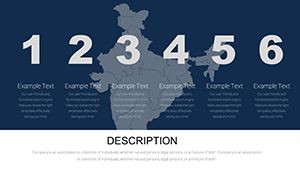
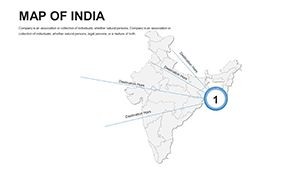
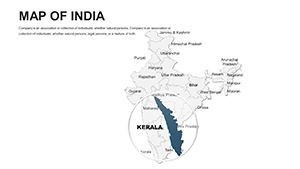
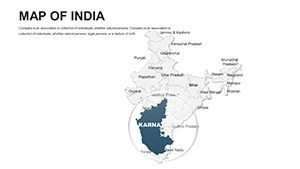
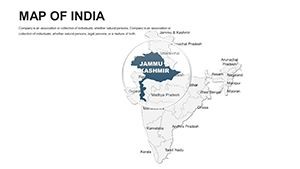
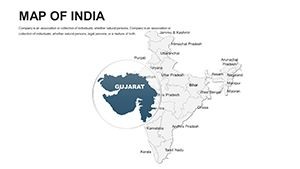
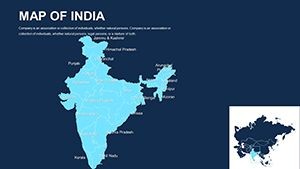
The coverage spans all 28 states and 8 union territories, with slides organized to progress logically from national-level layouts toward regional and state-specific detail. A business analyst preparing a regional expansion brief can open the national overview to establish the full subcontinent scope, then switch to a state-level slide to focus on Maharashtra or Tamil Nadu without leaving the file. Political boundary slides, physical geography layouts, and thematic map canvases are distributed across the 44 slides, giving presenters distinct starting points depending on whether the focus is administrative, topographic, or data-driven.
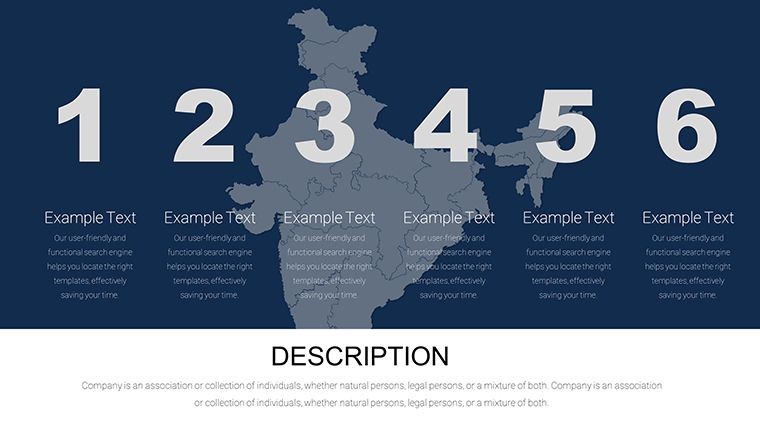
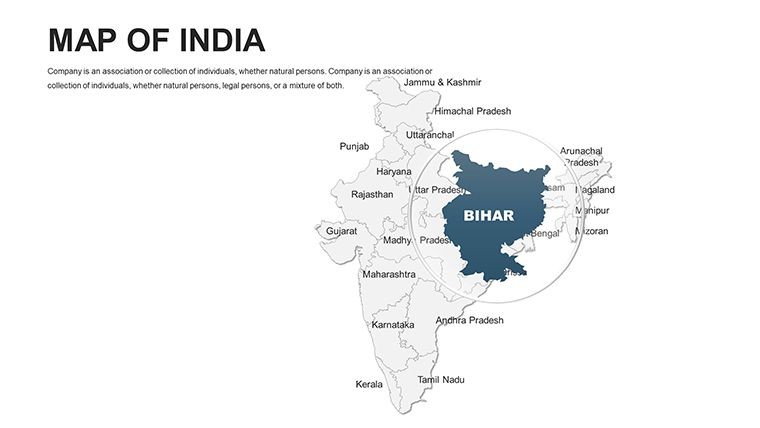
Among Asia-category map sets covering broader multi-country continental overviews, this file is the only option here dedicated entirely to India's internal structure. That scope difference produces noticeably higher slide depth per state: each major state gets its own dedicated layout canvas rather than sharing space on a regional overview slide. For a consulting deck, investor presentation, or internal reporting session where India's internal geography carries the argument, that per-state granularity is the practical differentiator.
Format and Compatibility Details
| Feature | Details |
|---|---|
| File format | .key - opens natively in Apple Keynote 12 or later on macOS |
| Slide count | 44 editable slides: national overview, state-level, union territory, and thematic layouts |
| State and territory coverage | All 28 states and 8 union territories, each with independently editable vector outlines |
| Label layers | State name text boxes sit on separate layers from fill shapes; edit without ungrouping |
| Color adjustments | Apply via Keynote master slide palette for global changes; per-shape fills for individual states |
| Animation support | Compatible with Keynote's Animate panel; build transitions assignable per state shape layer |
| Export options | .key for live editing, PDF for distribution, JPEG/PNG per slide for web or print use |
| Editing difficulty | Beginner - standard Keynote fill and text tools are sufficient; no design software needed |
Three Situations Where This Pays Off
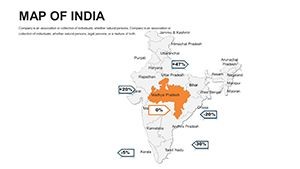
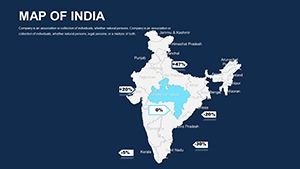
A market research manager at a Mumbai-based FMCG company needed to present state-by-state distribution coverage to the regional leadership team ahead of a Q2 planning cycle. The task required shading covered states in the company's primary color and leaving uncovered territories in neutral gray - a visual gap analysis that typically takes two to three hours to build from scratch using imported SVG files in Keynote. With this file, the manager selected the relevant state slides, applied the two-color scheme, and had a finished gap-analysis slide in under 45 minutes. The same file was adapted for the Q3 and Q4 reviews by updating the fill assignments each quarter without rebuilding any layouts.
A senior lecturer at a Delhi university used the physical geography slides to build an interactive classroom session on monsoon progression across the subcontinent. The ability to shade each state individually allowed the lecturer to build a slide sequence revealing monsoon coverage region by region - a sequential reveal that illustrated timing differences across the Bay of Bengal and Arabian Sea branches in a way that a static map could not. Student retention on the topic improved noticeably compared to sessions using static printed maps.
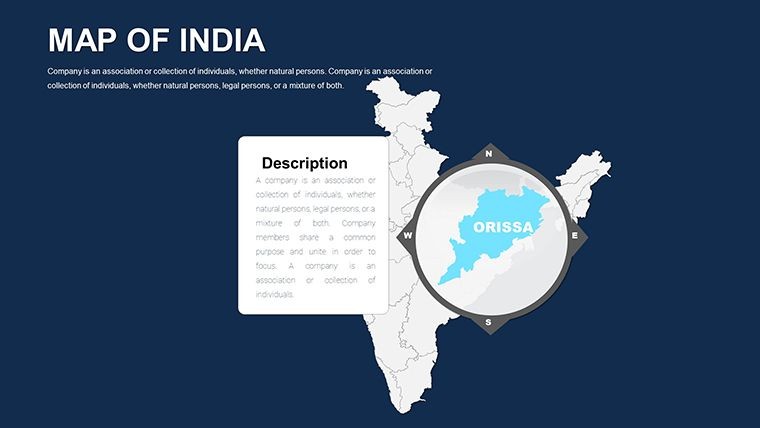
A policy consultant preparing a funding proposal for a rural infrastructure program used the union territory slides alongside the state overview to show both federal and territorial jurisdictional coverage in a single presentation. The consistency of vector styling across state and union territory slides - matching border weights, label placement conventions, and fill behavior - meant the two slide types could be placed side by side in the same deck without visual inconsistency.
Download and start editing immediately.
Edit, Brand, Present: The Workflow
How do I apply my brand colors to India state maps in Keynote? Open the .key file in Keynote 12, navigate to View > Edit Master Slides, and update the default fill on the regional slide master. Slides inheriting from that master update immediately; individually overridden shapes require a direct Format > Fill update.
- Step 1 - Open the .key file in Keynote 12 or later (1 minute)
- Step 2 - Use the slide navigator to identify state slides relevant to your coverage area; the national overview slide is typically the first in sequence (2 minutes)
- Step 3 - Apply brand or data colors to selected state shapes via Format > Fill, or update the master slide palette for a global change (3 minutes)
- Step 4 - Click label text boxes on each state to update names, statistics, or callout copy; adjustments do not require ungrouping the underlying shape (3 minutes)
- Step 5 - Duplicate or reorder slides as needed for multi-region breakdowns; delete unused layouts to reduce file size (2 minutes)
- Step 6 - Export as .key for live presentation or PDF for stakeholder distribution (1 minute)
Editing difficulty: Beginner. No prior design experience is required. Users unfamiliar with Keynote typically complete a first-pass brand adaptation within 15 to 20 minutes of opening the file for the first time.
What You'd Need to Replicate This Yourself
Building India's 28 state and 8 union territory outlines from a blank Keynote slide requires sourcing politically accurate boundary vector data, importing each state as a separate SVG path, correcting alignment and scale across the full canvas, positioning label text boxes at geographically correct coordinates, applying consistent stroke weights, and verifying that the overall shape proportions hold at 16:9 presentation format. That process runs 6 to 10 hours for a presenter working without GIS software, and the resulting file is still susceptible to misalignment when slides are scaled for different projector resolutions. The state paths in this file are already aligned, proportion-accurate, and tested at presentation scale.
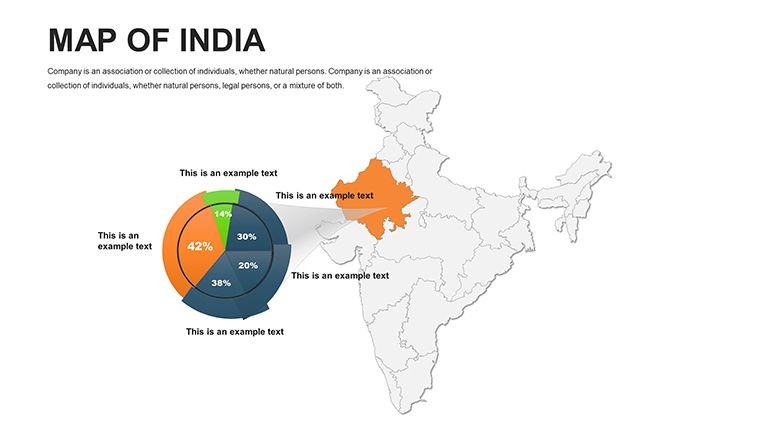
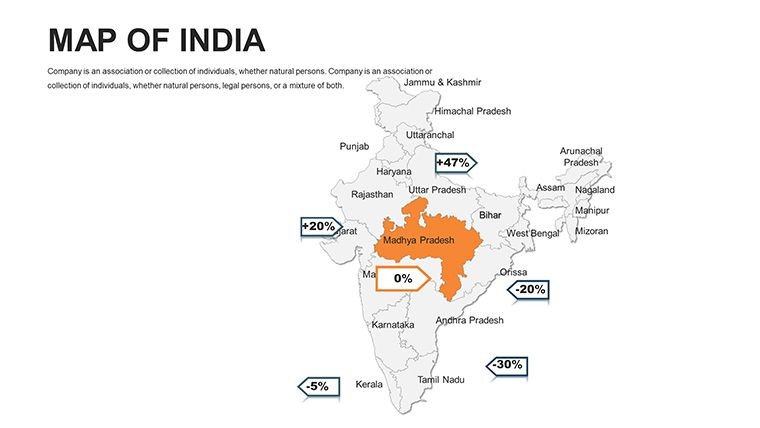
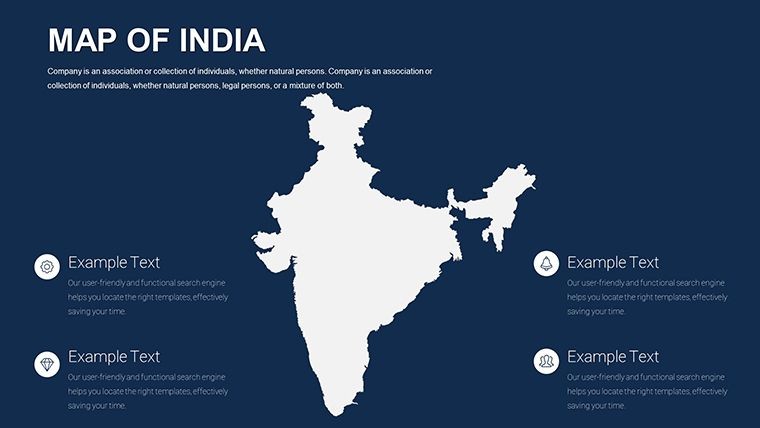
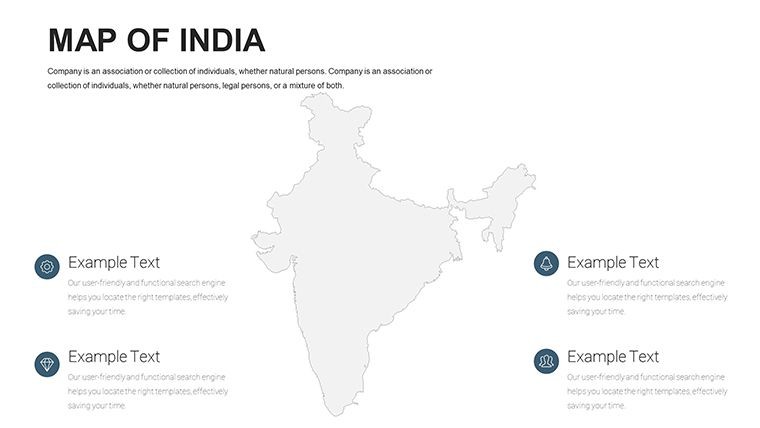
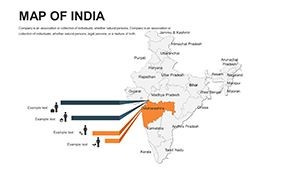
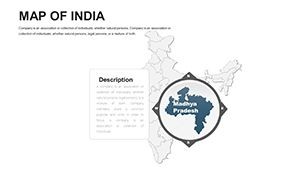
One design point worth noting: state label text boxes in this file are positioned outside the filled territory shapes rather than inside them. Labels placed inside filled areas become difficult to read when the fill is dark or highly saturated - a consistent problem in heatmap-style data presentations where fill intensity encodes performance data. Positioning labels externally keeps them legible regardless of fill color and eliminates the need to manually adjust text contrast every time the color scheme changes across the 44 slides.
The India-specific scope also distinguishes this set from broader Asia multi-country collections, which typically allocate 2 to 4 slides to India as part of a continental overview. A continental Asia file cannot deliver per-state slide depth. For a deck where the argument depends on showing differences between Rajasthan and Gujarat, or between Telangana and Andhra Pradesh, the per-state granularity of a dedicated India file is the only approach that works at presentation scale.
Download and start editing immediately.
Frequently Asked Questions
Which version of Apple Keynote is required to open this file?
The .key file is compatible with Apple Keynote 12 and later, running on macOS Monterey or a more recent macOS version. Keynote 12 handles the vector path groupings and layer structure the file relies on for clean editing. Earlier Keynote versions may open the file but could produce alignment issues with the grouped state shape layers. Keynote for iCloud and Keynote for iPad can open .key files, but complex grouped vector structures may behave differently in those environments versus the macOS desktop application. If you are unsure of your current Keynote version, check the App Store or About Keynote menu before purchasing.
How do I change the color of individual states in the map?
Select the state shape on the slide canvas - click directly on the filled territory area - then open Format > Fill in the right sidebar and choose your color. Each state shape is a separate vector path, so editing one state's fill does not affect neighboring states. For a global palette change across all state slides, go to View > Edit Master Slides and update the default shape fill on the master; slides inheriting from that master will update simultaneously. For heatmap-style presentations where each state needs a different color intensity, per-shape manual fill assignment is the correct approach and takes approximately 30 to 60 seconds per state depending on how many fills you are applying.
Can this file be used for commercial client presentations?
The standard purchase license covers internal business use and client-facing deliverables - for example, incorporating slides from this file into a strategy deck or report delivered to a paying client. The license does not permit reselling the .key file, redistributing it as a standalone template, or uploading it to any digital marketplace. If your use case involves delivering the template file directly to clients rather than incorporating its slides into finished presentations, review the ImagineLayout terms of use at imaginelayout.com/terms to determine whether an extended license applies to your situation.
Is there a free version, and what does the $40.00 purchase include?
The product page does not list a free version or partial download for this template. The $40.00 purchase provides the complete 44-slide .key file, covering all national overview, state-level, union territory, and thematic layout slides, with fully editable vector shapes and label layers throughout. There is no indication of a tiered free/paid structure on the product listing. If a sample preview becomes available in the future, it would appear in the product pricing section on the ImagineLayout page at the time of purchase.
Does the file work with PowerPoint, or is it Keynote-only?
The file is delivered in .key format, designed for Apple Keynote. Keynote includes an export option to .pptx, accessible via File > Export To > PowerPoint, which converts the file for use in Microsoft PowerPoint. However, vector shape groupings and layer structures do not always transfer with full fidelity during that conversion, and some fill behaviors and animations may simplify or require manual adjustment after export. If your primary editing environment is PowerPoint rather than Keynote, verify the export results on a sample slide before committing to the full deck in PowerPoint format.
What is the refund policy for this download?
ImagineLayout's refund policy applies to digital downloads. Refund eligibility is generally limited to technically defective files - for example, a .key file that fails to open in the specified Keynote version or contains missing slides not matching the product description. Change of mind after download or aesthetic dissatisfaction are not typically qualifying conditions, since the file is delivered electronically and immediately upon purchase. The full refund policy is available at imaginelayout.com/refund-policy. Reviewing it before completing the purchase is recommended if refund terms are a factor in the buying decision.
Browse the full Asia Keynote Maps category for additional country-level coverage. Teams presenting the broader South and Southeast Asian context alongside India often pair this file with a continental Asia map set. For a second India-focused option at a different price point, the India Keynote Map Template (KM00081) offers an alternative layout approach.