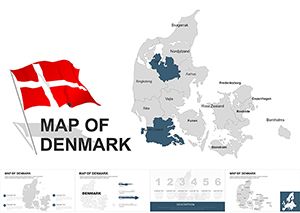
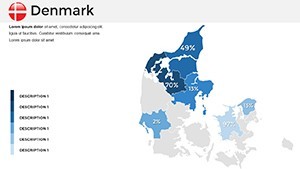
Editable Denmark Map Keynote Template: Transform Data into Danish Narratives


Type: Keynote Maps template
Category: Europe
Sources Available: .key
Product ID: KM00030
Template incl.: 37 editable slides
Imagine standing before a room full of stakeholders, unveiling a crystal-clear map of Denmark that not only highlights key regions but also tells a compelling story of market potential or historical insights. Our Denmark Keynote map template is your gateway to such impactful presentations. Designed specifically for professionals who need to convey geographical data with precision and flair, this 37-slide powerhouse is fully editable, allowing you to tweak colors, labels, and layouts to match your brand or narrative. Whether you're a business analyst plotting expansion strategies in Copenhagen or an educator illustrating Nordic geography, this template turns complex information into visually engaging slides that resonate.
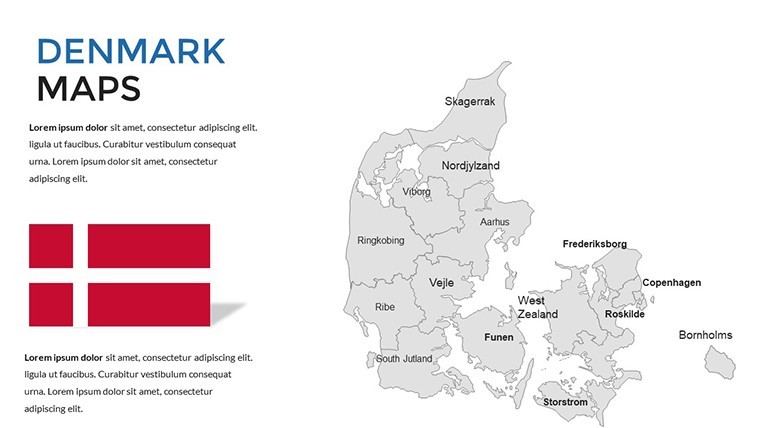
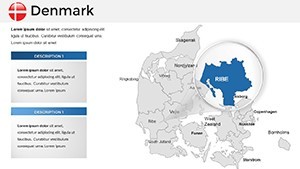
What sets this template apart is its handcrafted focus on Denmark's unique political and regional divisions. From the bustling capital to the serene fjords of Jutland, every element is vector-based, ensuring scalability without quality loss. Compatible with Apple Keynote, it's optimized for wide-screen displays and includes custom animations that bring your maps to life - watch regions highlight on cue during your talk. No more fumbling with generic tools; this template streamlines your workflow, saving hours on design so you can focus on delivering your message.
Unlocking the Core Features of the Denmark Map Template
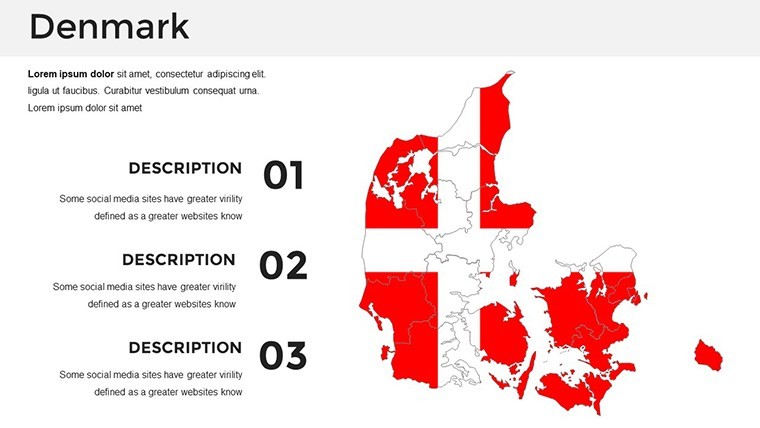
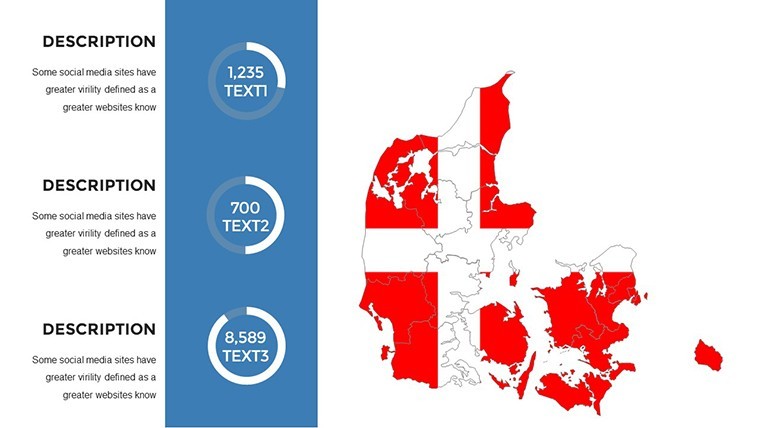
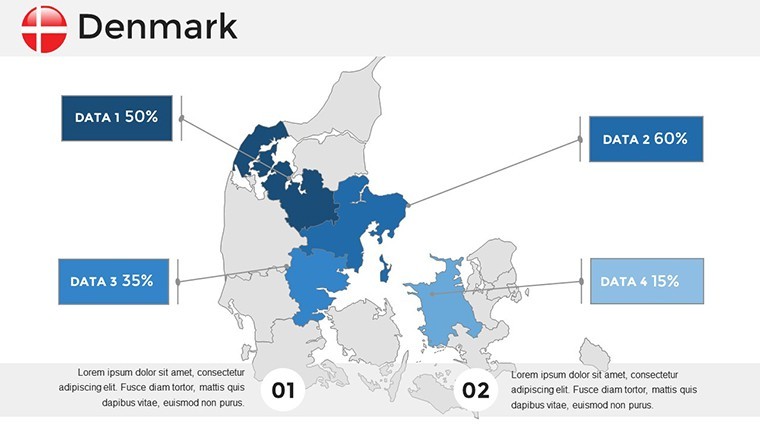
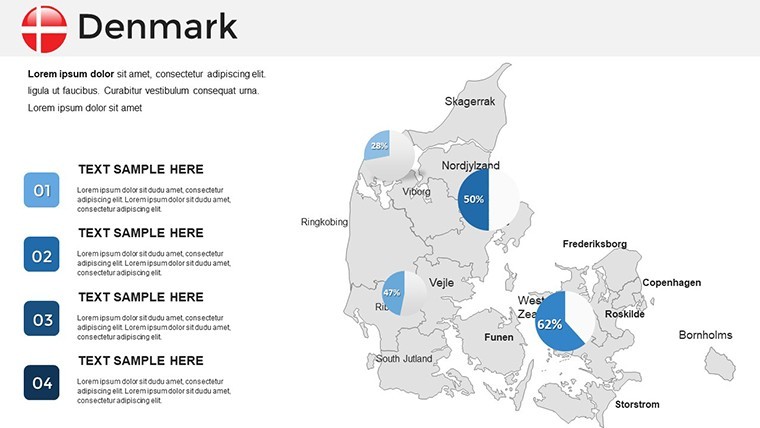
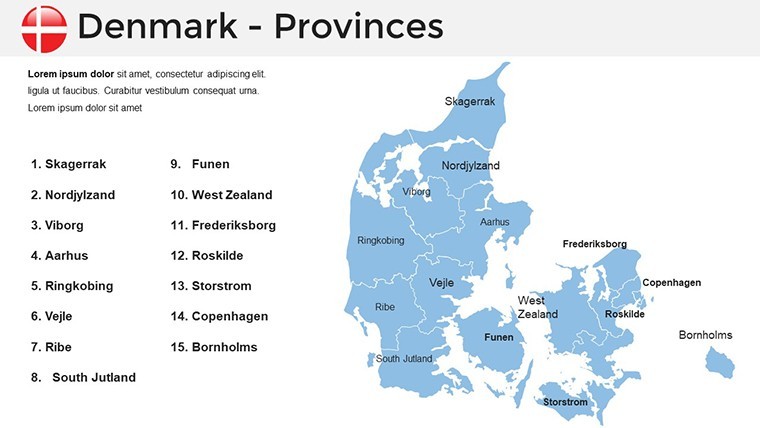
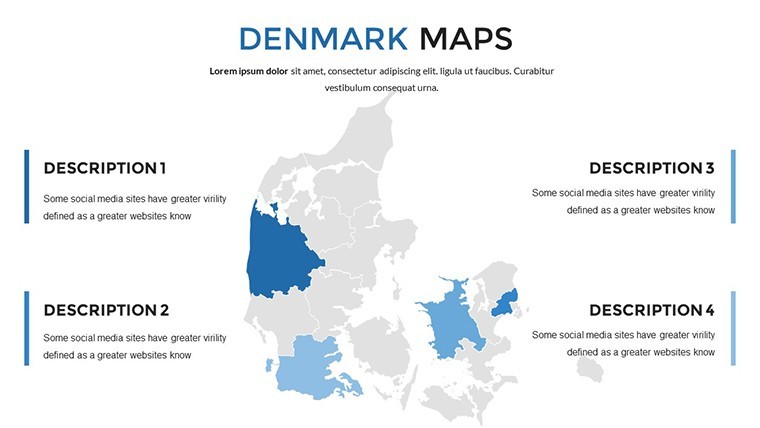
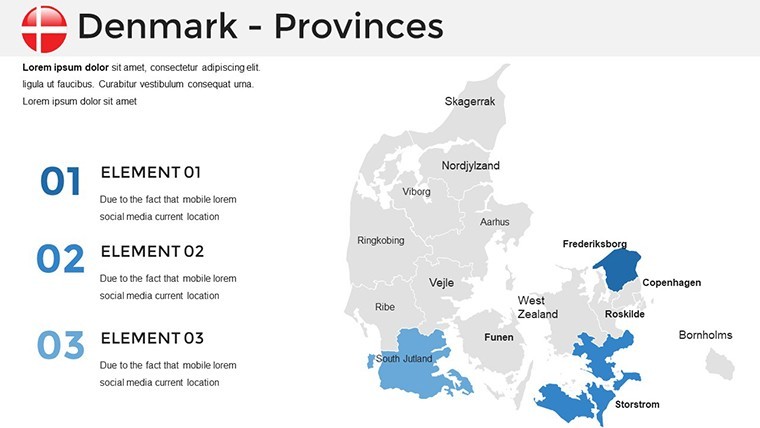
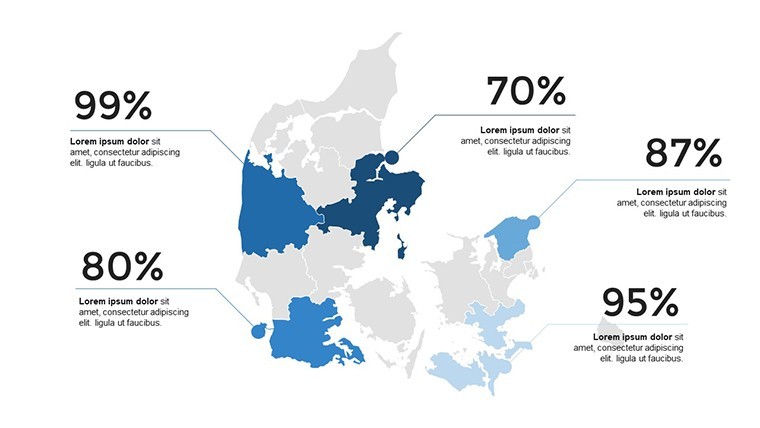
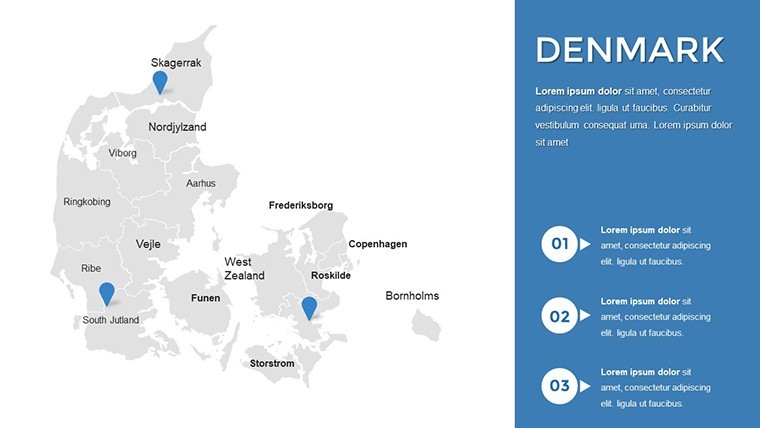
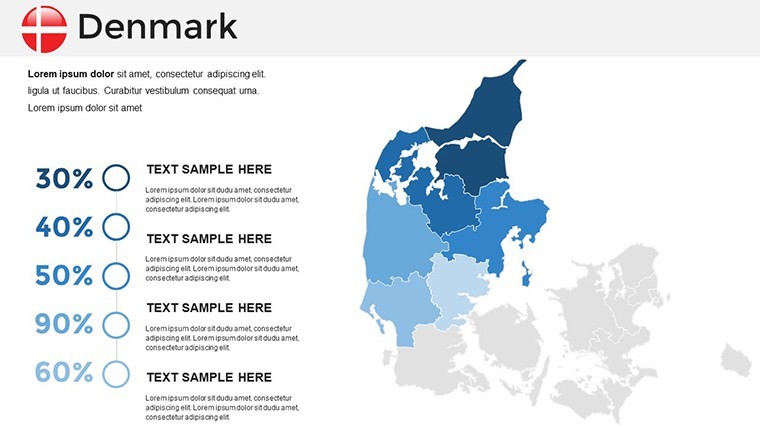
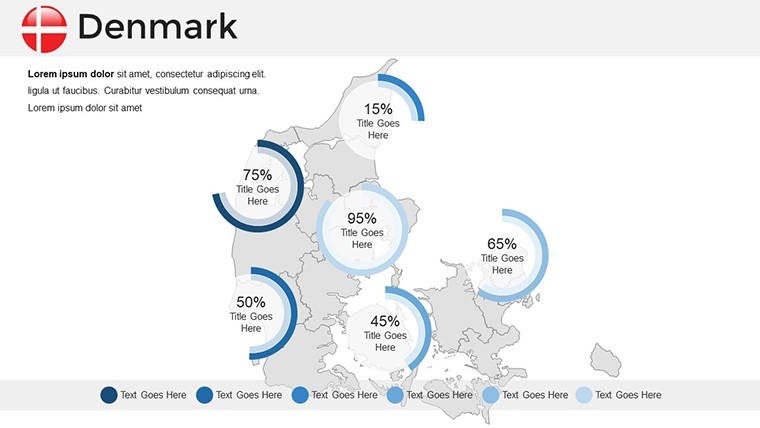
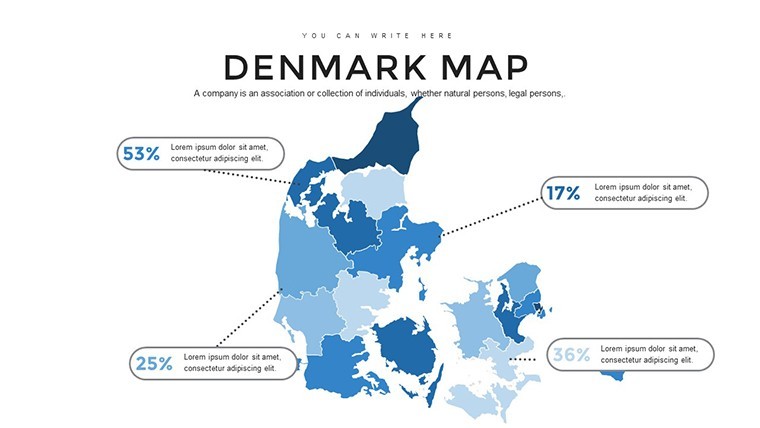
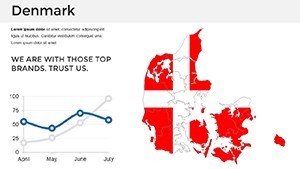
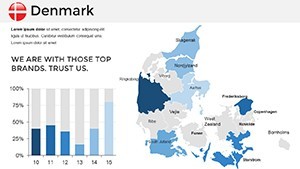
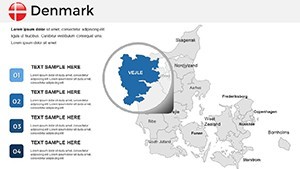
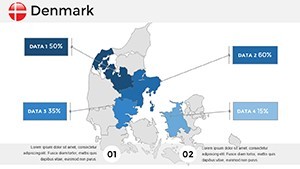
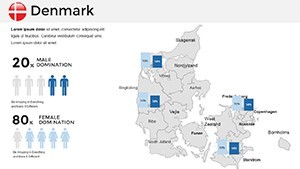
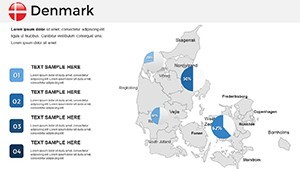
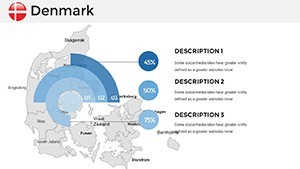
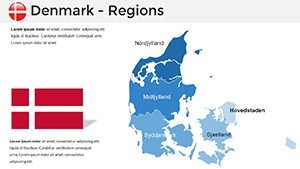
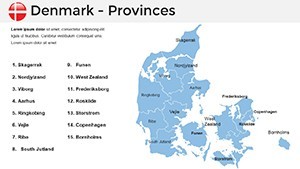
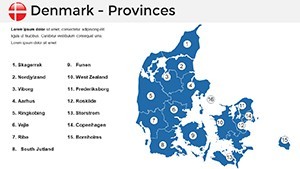
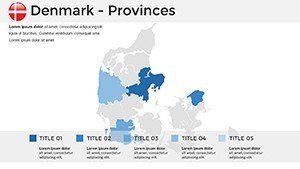
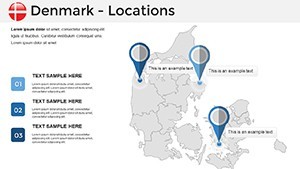
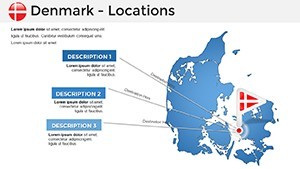
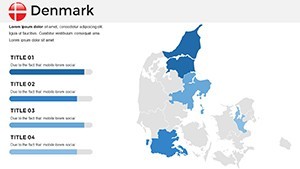
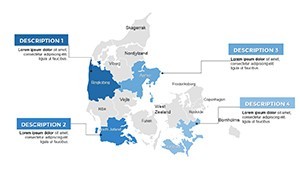
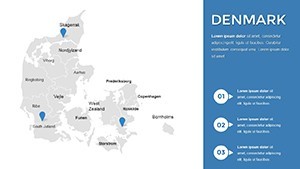
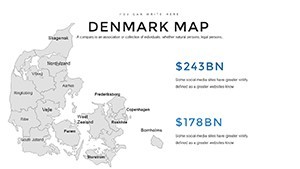
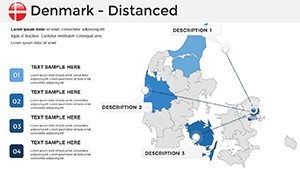
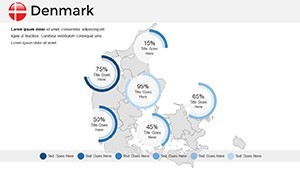
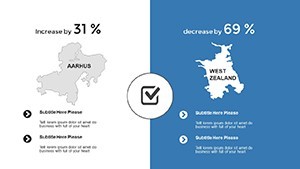
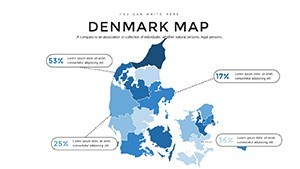
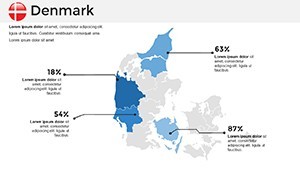
Dive deeper into what makes this template a must-have for presentation pros. Starting with the editable political map of Denmark, you can effortlessly adjust boundaries, add icons for cities like Aarhus or Odense, and integrate data overlays for population density or economic indicators. The 37 slides include a mix of full-country views, zoomed-in regional breakdowns, and infographic elements like timelines for historical events or pie charts for sectoral analysis.
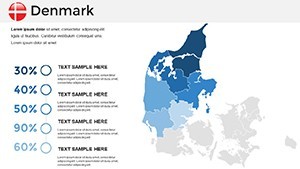
- Fully Customizable Elements: Change colors to represent sales territories - use cool blues for coastal areas and vibrant greens for agricultural heartlands.
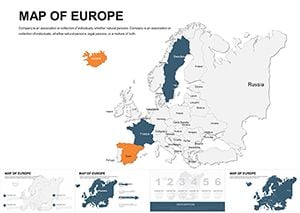
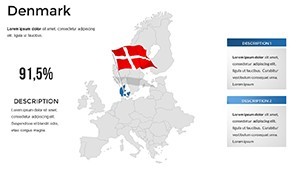
- Animation Mastery: Built-in transitions make paths from Denmark to Europe pop, ideal for trade route discussions.
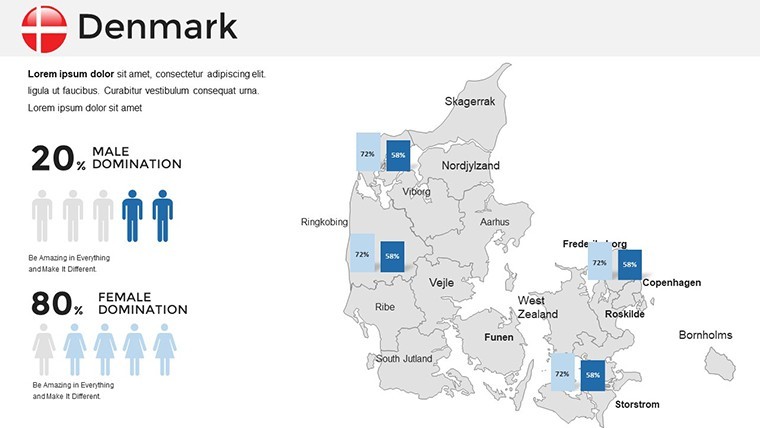
- Infographic Integration: Handmade icons for landmarks like the Little Mermaid statue or wind farms, enhancing thematic depth.
- Professional Aesthetics: Clean, modern style with free fonts, ensuring Retina-ready sharpness for any projector.
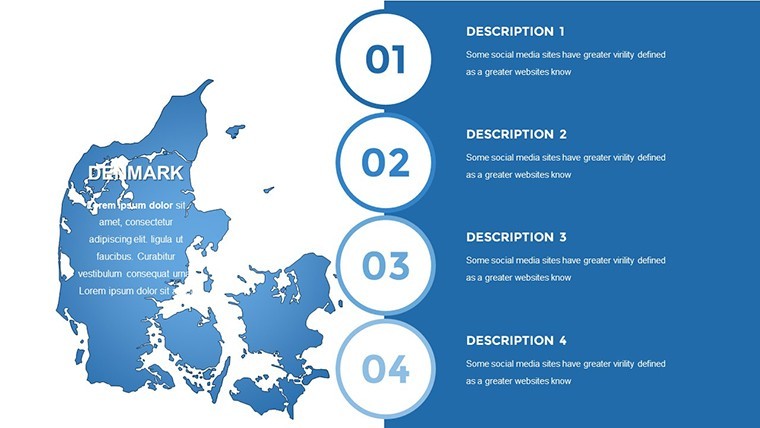
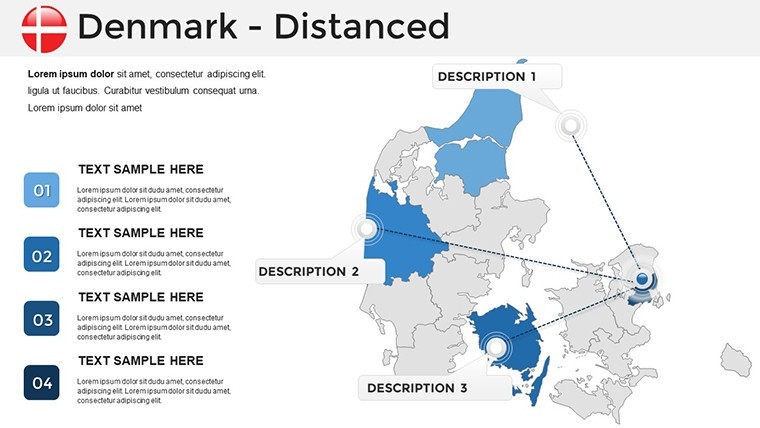
- Versatile Layouts: Section breaks and smart slides for easy navigation between overview and detail views.
These features aren't just bells and whistles; they're rooted in real-world presentation needs. For instance, in a scenario inspired by Scandinavian design principles - think minimalist yet informative like IKEA's catalogs - this template lets you layer data without clutter, adhering to best practices for visual communication as recommended by presentation experts.
Real-World Applications: Where Denmark Maps Shine
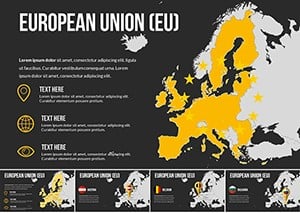
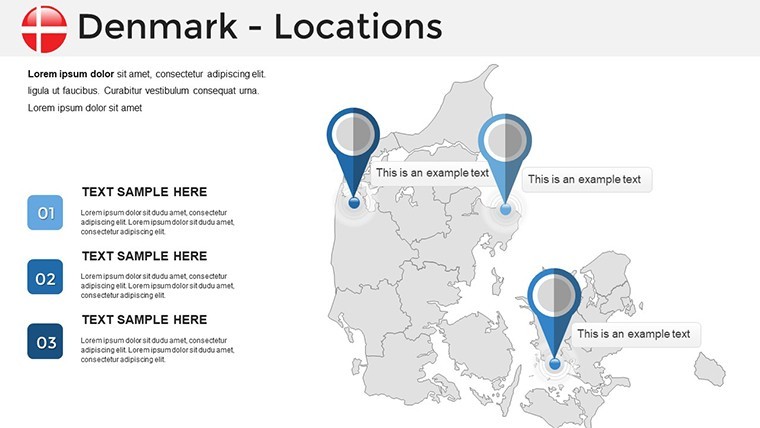
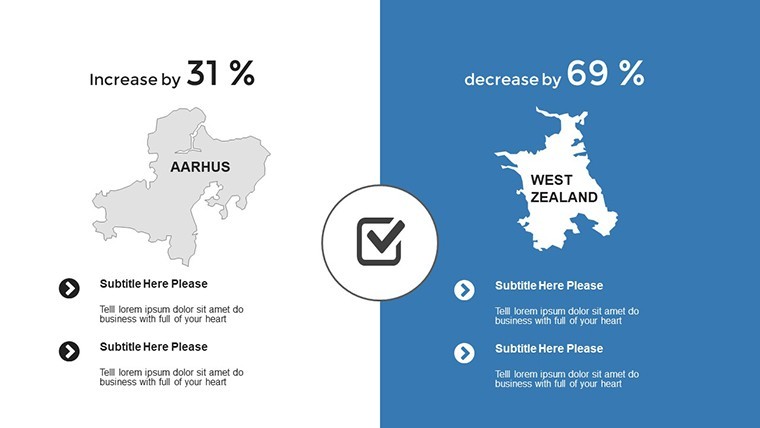
Picture this: You're pitching a renewable energy project to investors. With our template, slide 12's regional map lets you spotlight wind turbine hotspots in the North Sea, while slide 25's comparative chart contrasts Denmark's green initiatives against EU averages. Or, in an academic setting, use it to map Viking trade routes, animating paths from slide to slide for an immersive lesson.
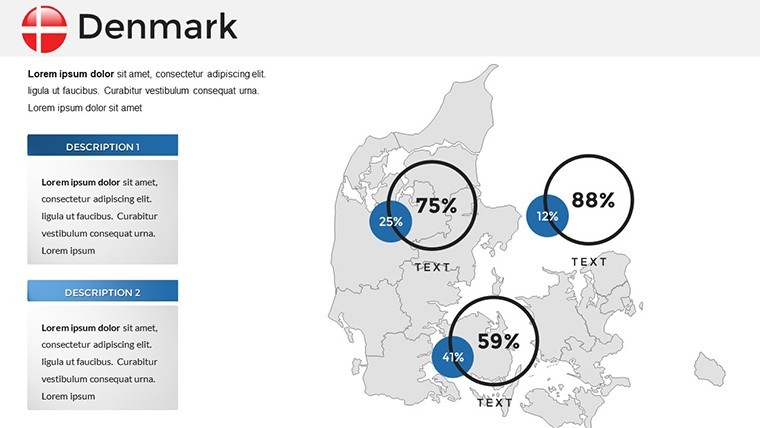
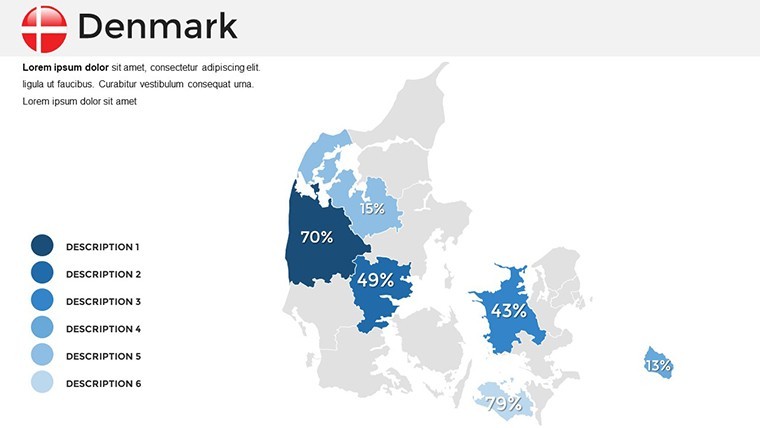
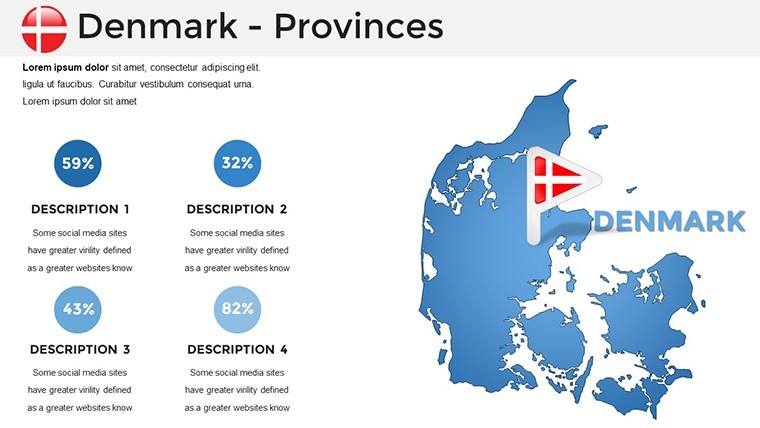
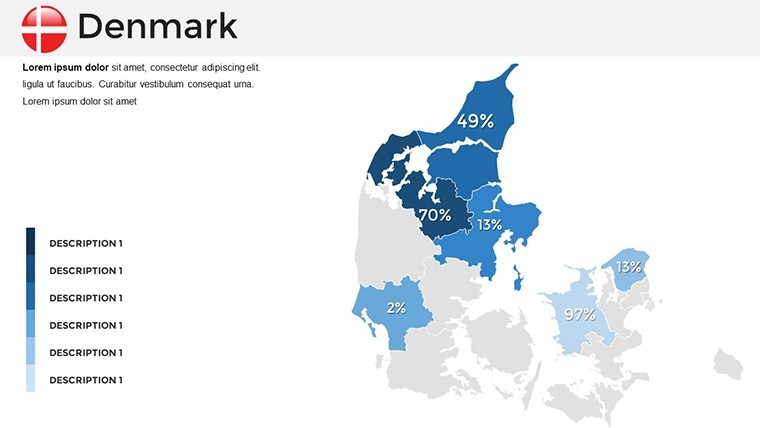
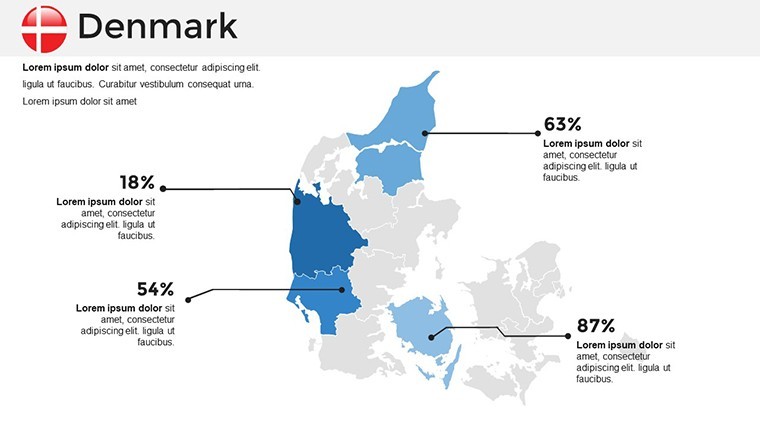
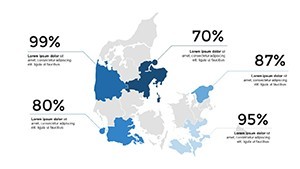
For business users, it's invaluable in market analysis. Customize slide 8 to overlay GDP data per region, turning abstract numbers into a persuasive visual story. Tourism professionals can leverage the template for itinerary planning - highlight ferry routes between islands on slide 19, complete with photo placeholders for scenic views. Even nonprofits benefit, mapping aid distribution across municipalities with color-coded intensity on editable layers.
- Step 1: Import Your Data � Drag and drop Excel stats into Keynote's charts, syncing seamlessly with map elements.
- Step 2: Customize Visually � Select regions, apply gradients for elevation or economic gradients, and add callouts for key stats.
- Step 3: Animate for Impact � Sequence reveals to guide the audience's eye, building suspense in your narrative.
- Step 4: Export and Present � Output to PDF or video for hybrid events, maintaining fidelity.
Compared to basic Keynote maps, this template offers 200% more customization options, reducing design time by up to 70% based on user feedback from similar tools. It's not just a map; it's a storytelling canvas tailored for Denmark's compact yet diverse landscape.
Expert Tips to Maximize Your Denmark Keynote Presentation
As a presentation specialist with years of experience in geographical visuals, I recommend starting with audience analysis. For Danish business audiences, emphasize data-driven slides; for international ones, add context like EU integrations. Pro tip: Use the template's grid system on slide 30 for precise alignments, ensuring compliance with accessibility standards like high-contrast modes for color-blind viewers.
Integrate it into your workflow by pairing with tools like Google Earth for 3D references, then flattening into Keynote. For urban planners, this template excels in zoning visualizations - edit slide 22 to delineate urban vs. rural divides, drawing from real projects like Copenhagen's sustainable city initiatives.
Don't overlook mobile compatibility; test animations on iPads for remote teams. With its multipurpose design, you'll find applications beyond geography, like metaphorically mapping project timelines across "regions" of your plan.
Elevate Your Next Presentation with Seamless Integration
Ready to make your Denmark-focused talks unforgettable? This template's quick guide ensures even beginners can master it in under 30 minutes. Download today and watch your engagement soar - customize now and turn every slide into a conversation starter.
Frequently Asked Questions
Is this Denmark map template compatible with PowerPoint?
While optimized for Keynote, you can export to PowerPoint via .pptx, though some animations may need tweaks for full compatibility.
How editable are the map regions?
Every state and region is fully vector-editable; resize, recolor, or add text without quality loss.
Does it include icons for Danish landmarks?
Yes, with 50+ handmade infographics, including symbols for major cities and cultural sites.
Can I use this for commercial presentations?
Absolutely - royalty-free for business, education, and nonprofit use.
What's the file size and resolution?
Full HD Retina-ready, under 50MB for smooth performance.
Are updates included?
Lifetime access with free updates for geopolitical changes.