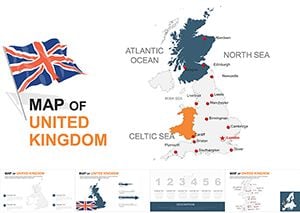
United Kingdom Maps Keynote Template - Customize Easily


Type: Keynote Maps template
Category: Europe
Sources Available: .key
Product ID: KM00006
Template incl.: 40 editable slides
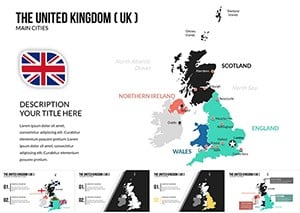
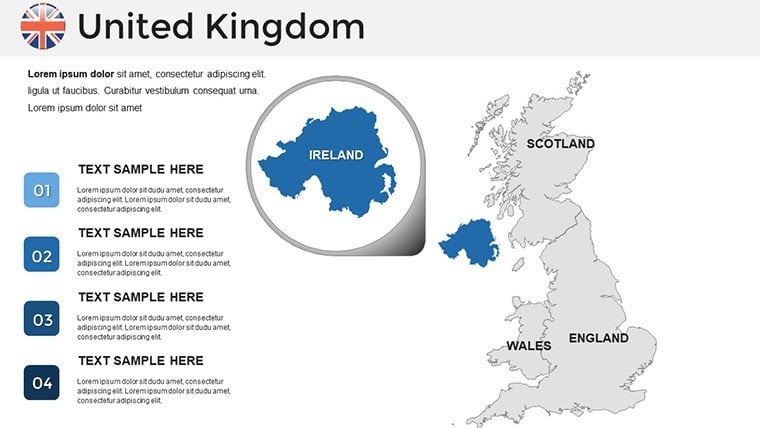
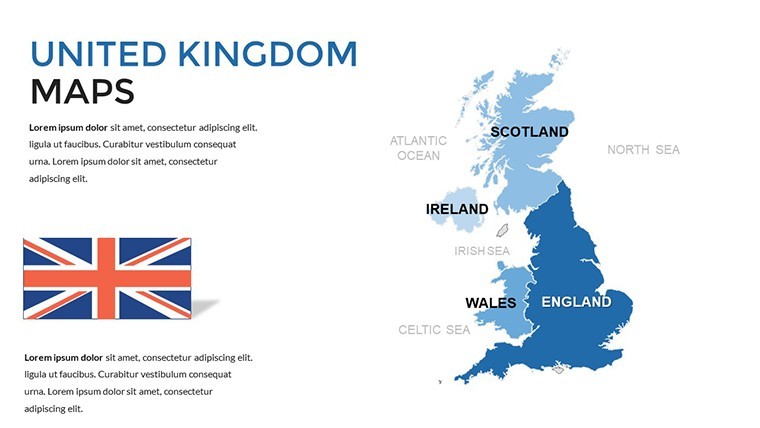
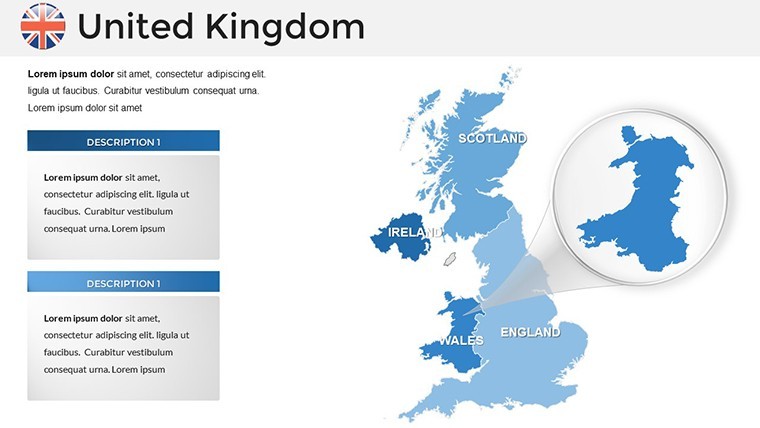
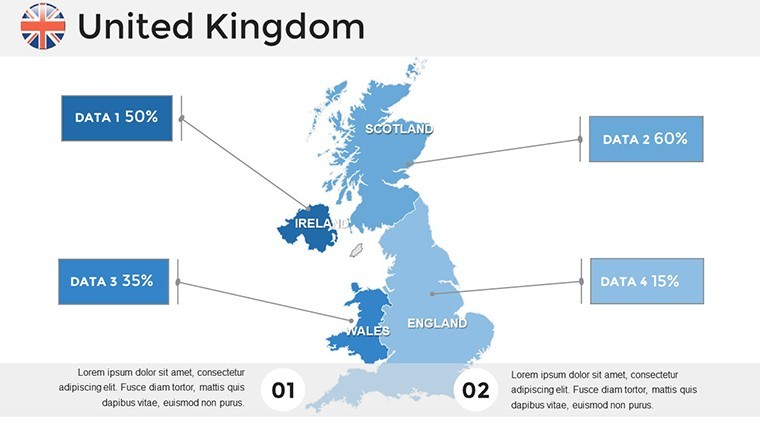
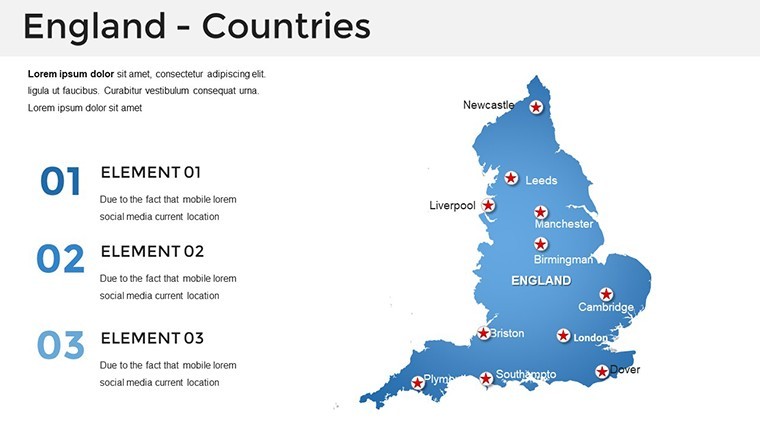
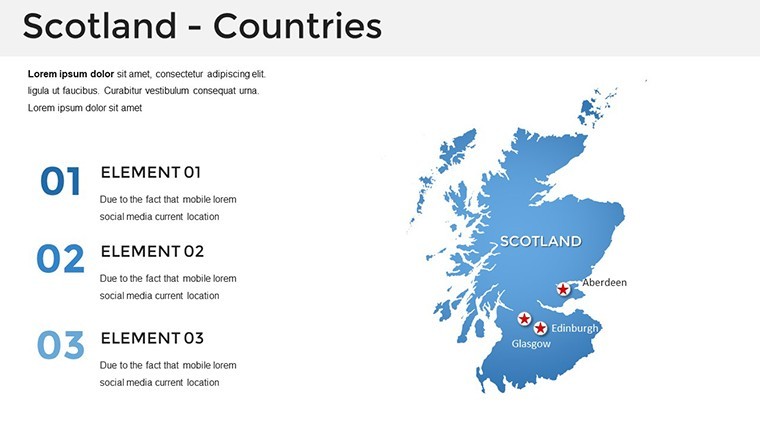
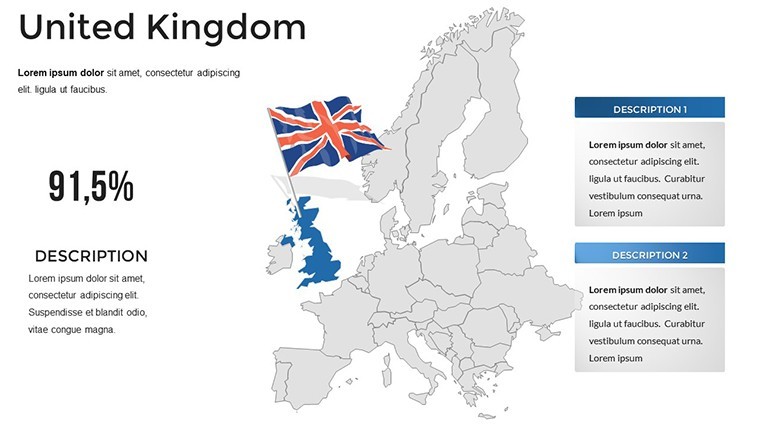
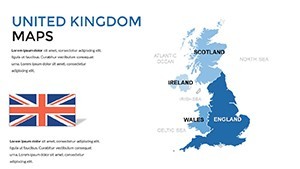
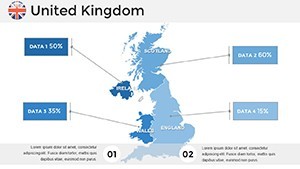
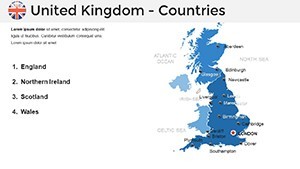
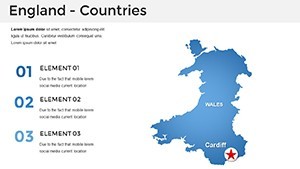
Delve into the intricate geography of the United Kingdom with a template that turns data into dialogue. Our United Kingdom Maps Keynote Template, boasting 40 editable slides, is crafted for those who need to present regional insights with precision and flair. From Brexit impact assessments to tourism strategies across England, Scotland, Wales, and Northern Ireland, this tool equips you to build compelling narratives. Vector-based maps ensure scalability, while intuitive edits let you focus on content, not creation. As a marketing analyst who's navigated countless regional reports, I appreciate how this template streamlines workflows, blending professional design with user-centric features for presentations that persuade and inform.
The UK's diverse landscapes - from bustling London to rugged Highlands - demand visuals that capture nuance. This template delivers with political maps that highlight boundaries and editable elements for custom overlays. Imagine animating trade flows post-EU or mapping cultural heritage sites with ease. Retina-ready and full HD, it's optimized for virtual meetings or boardrooms, using free fonts for accessibility.
Standout Features for Professional Presenters
What elevates this template? It's the fusion of functionality and aesthetics. Wide-screen slides accommodate detailed views, custom animations add engagement, and section breaks maintain flow.
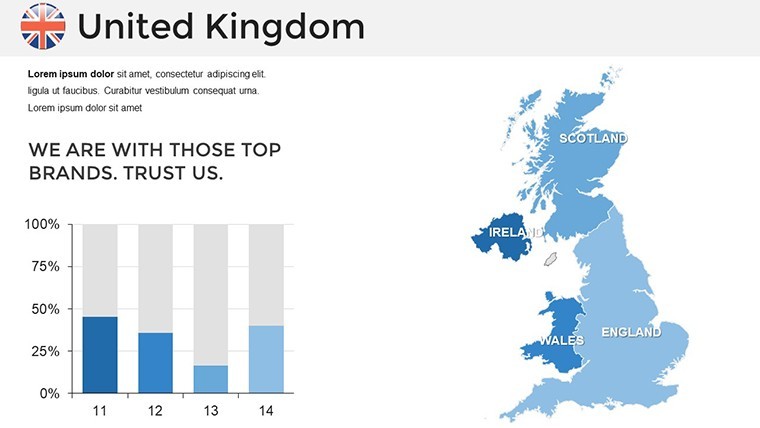
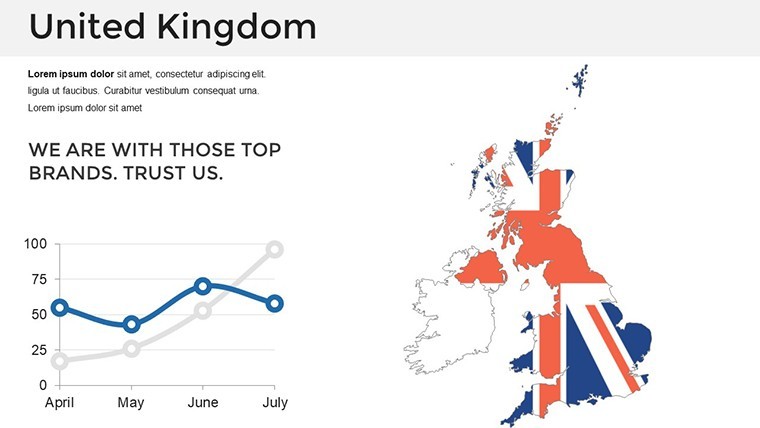
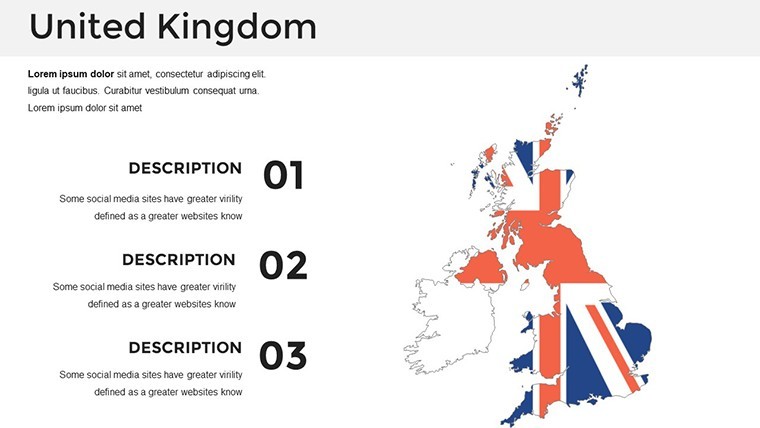
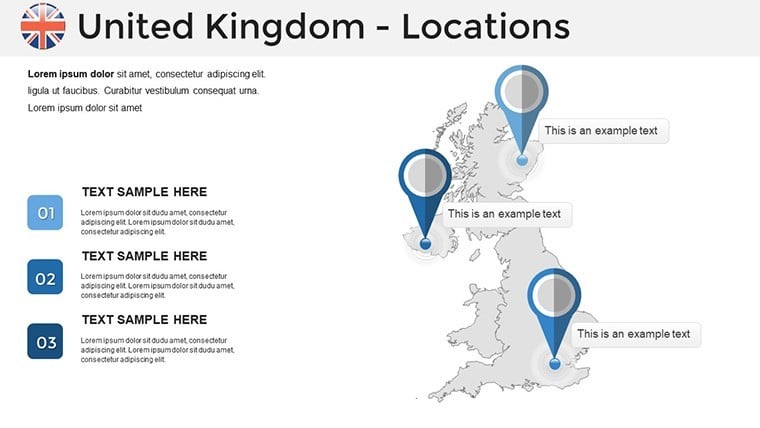
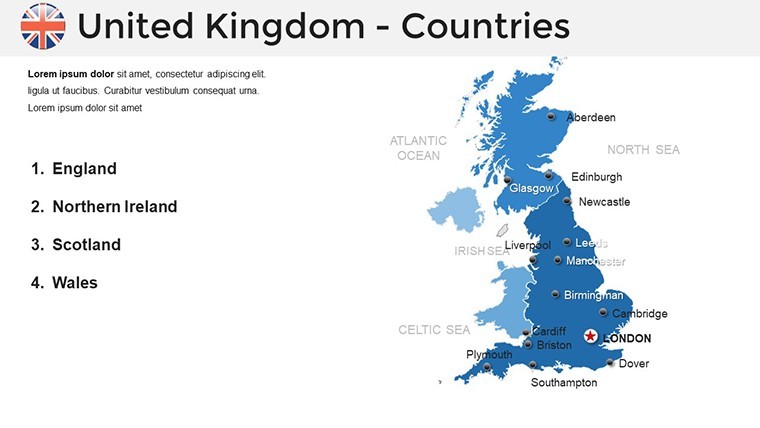
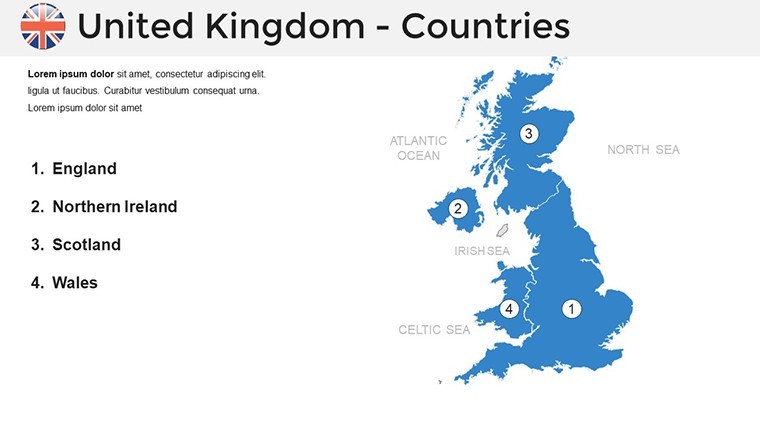
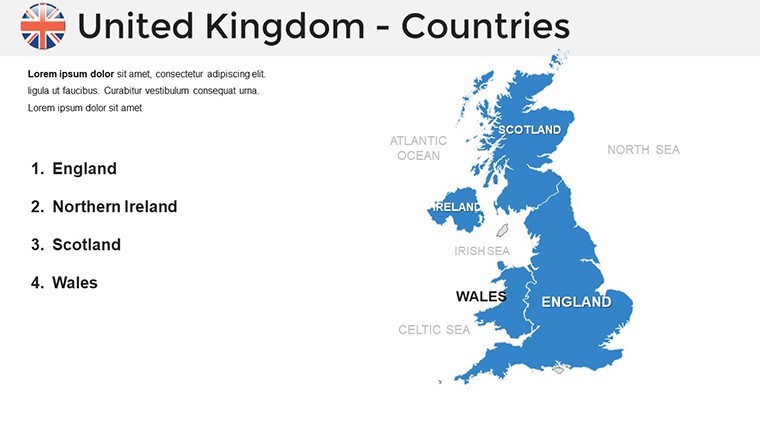
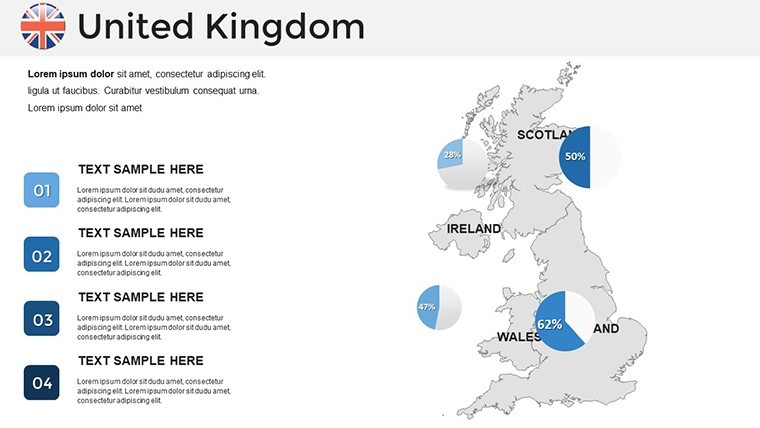
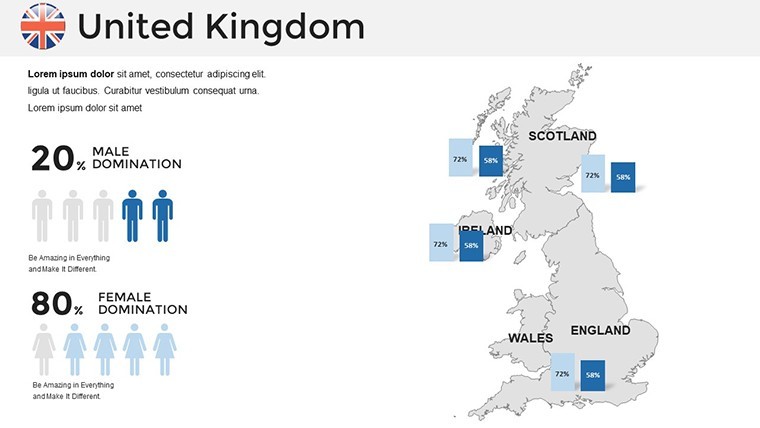
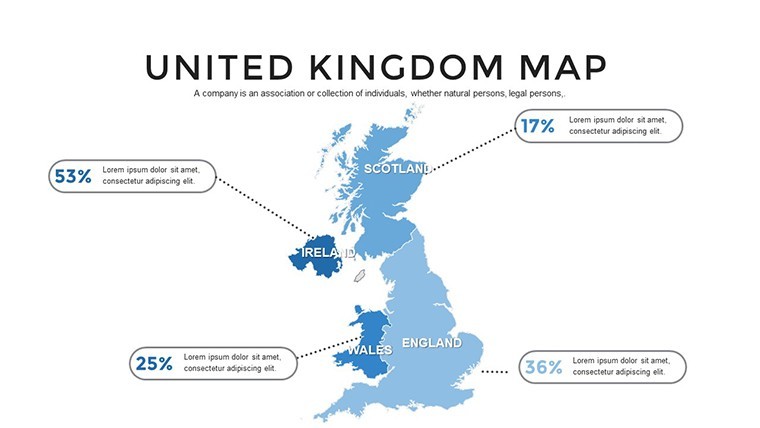
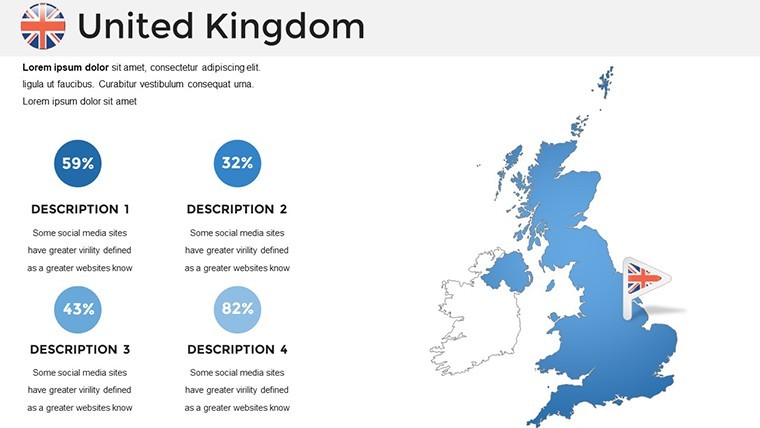
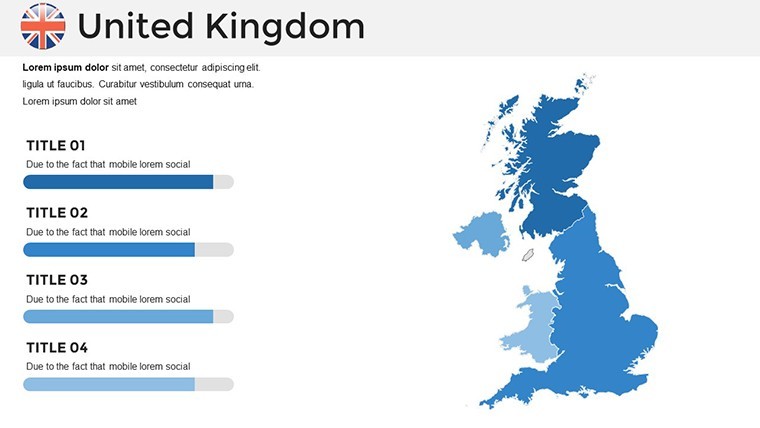
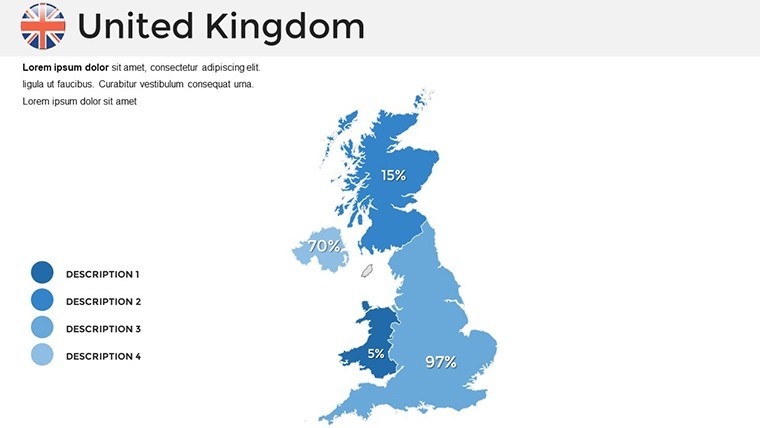
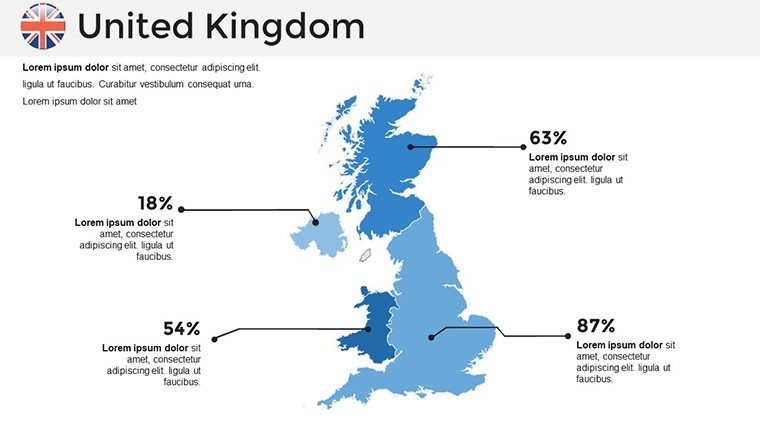
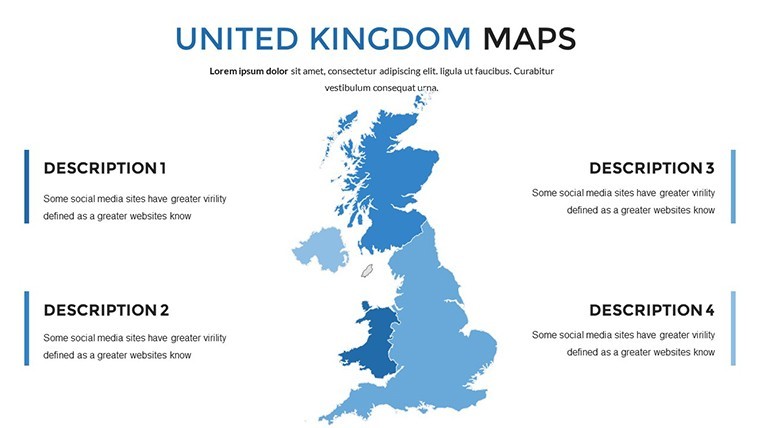
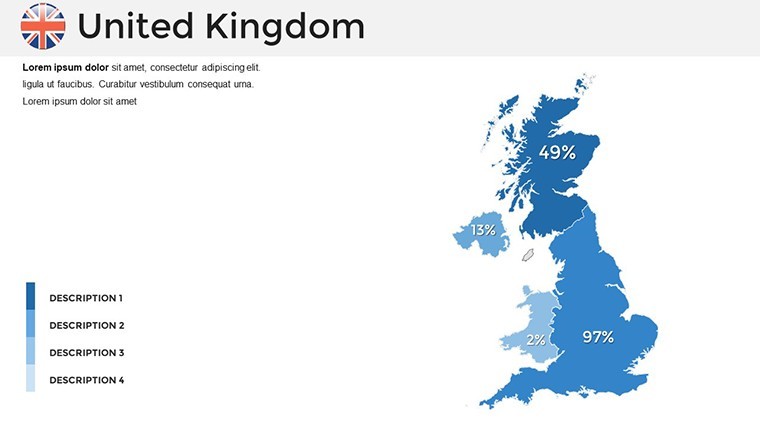
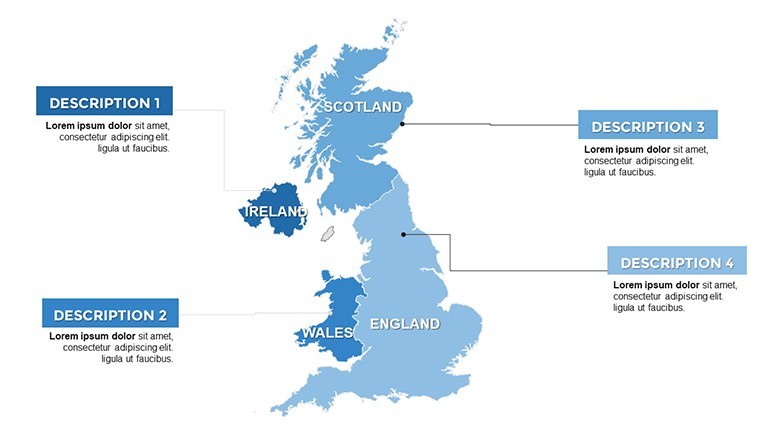
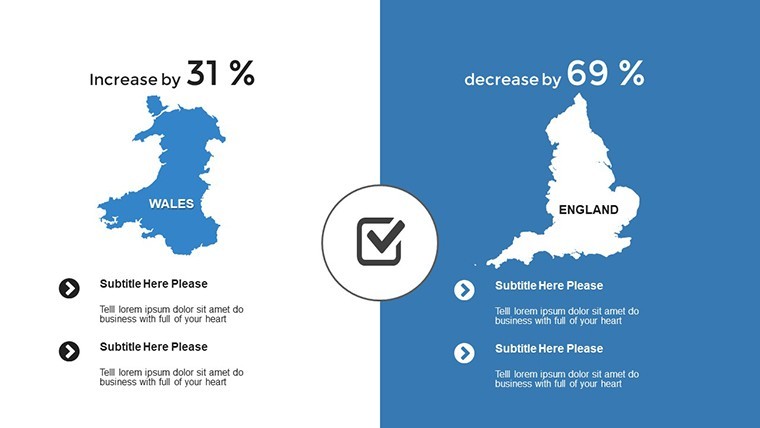
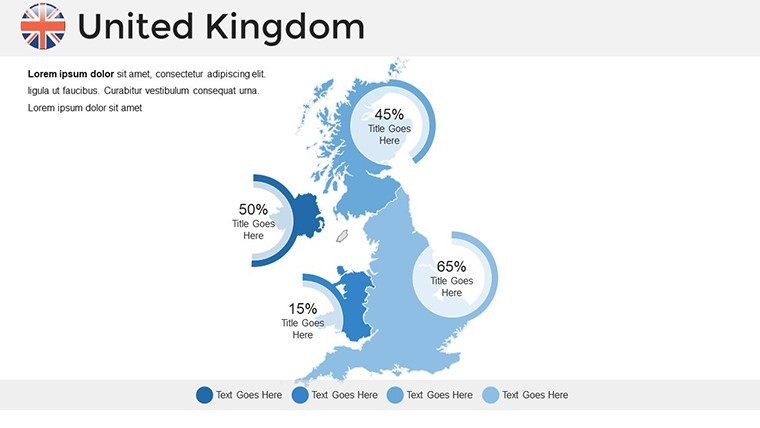
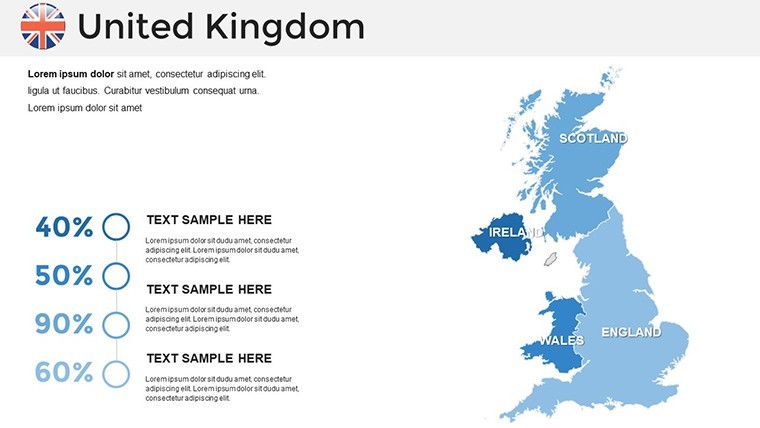
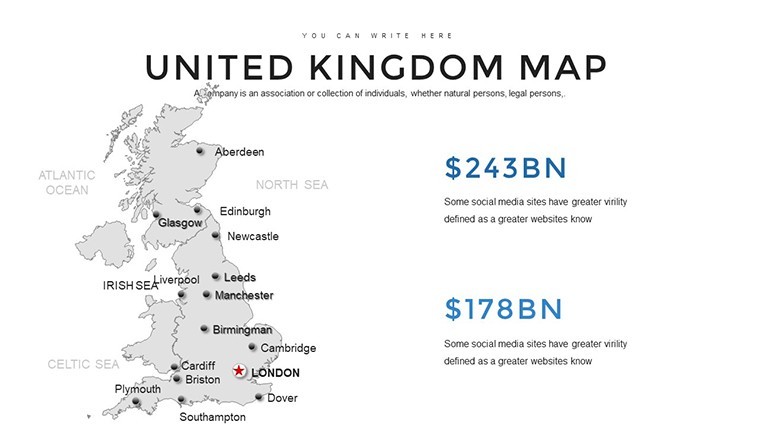
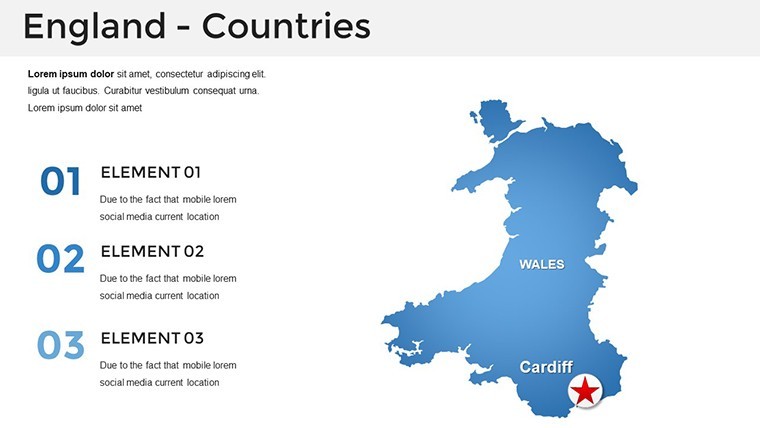
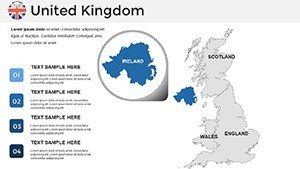
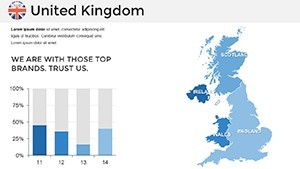
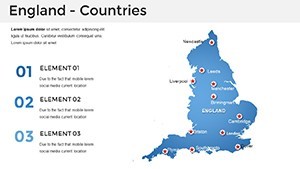
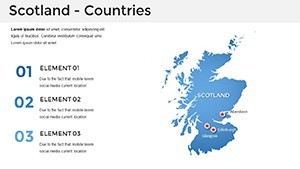
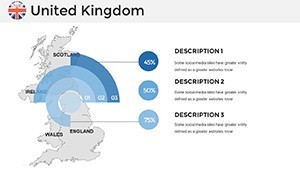
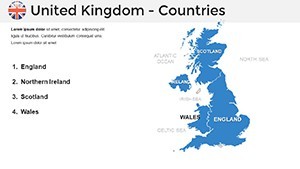
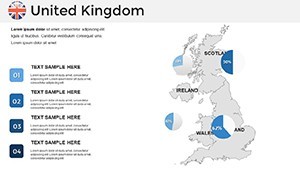
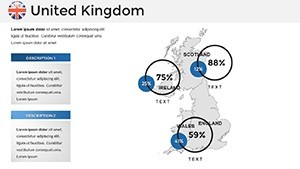
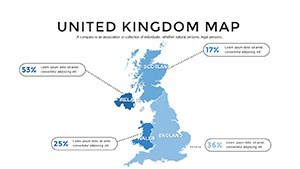
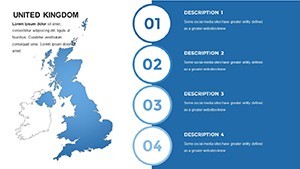
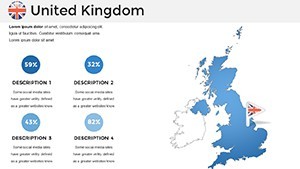
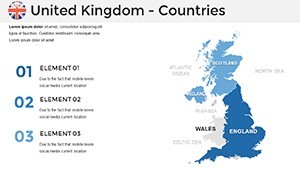
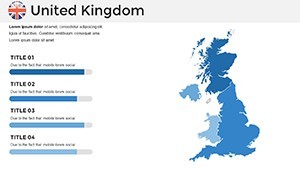
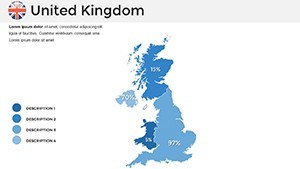
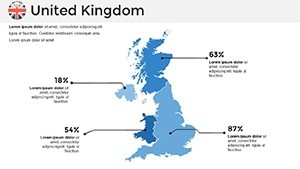
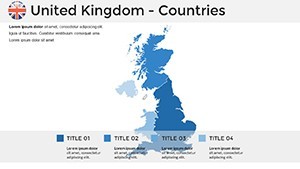
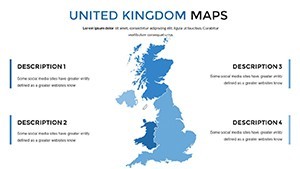
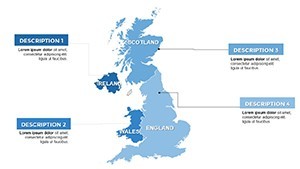
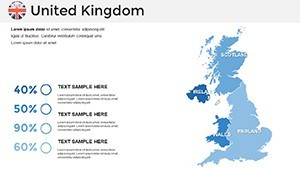
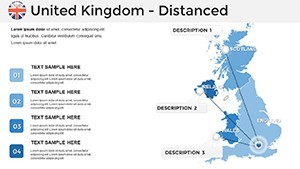
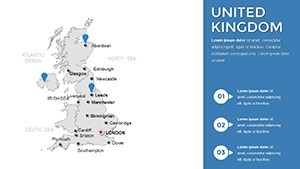
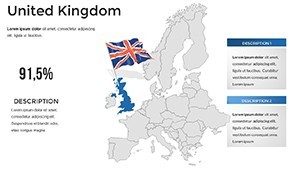
- Comprehensive Editable Maps: Control over UK regions - adjust colors for political affiliations or economic zones, add fonts matching your style.
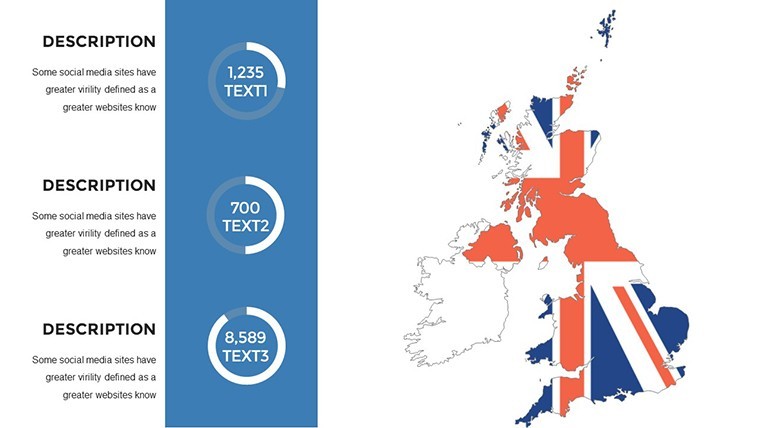
- Vector Symbols and Grids: Modify without quality dip, perfect for adding population density grids or export tick marks.
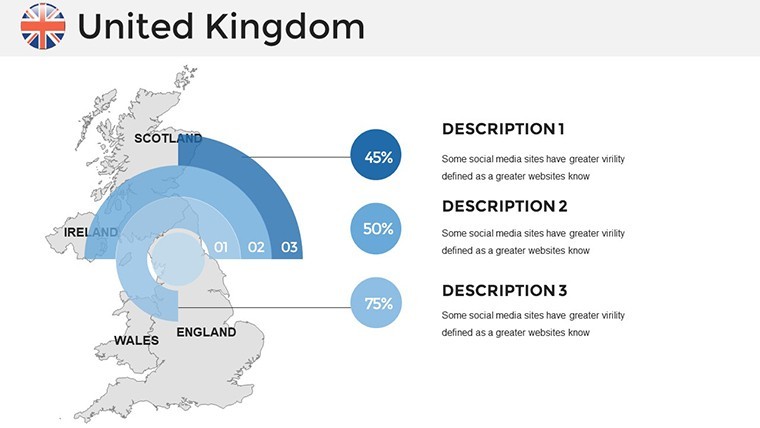
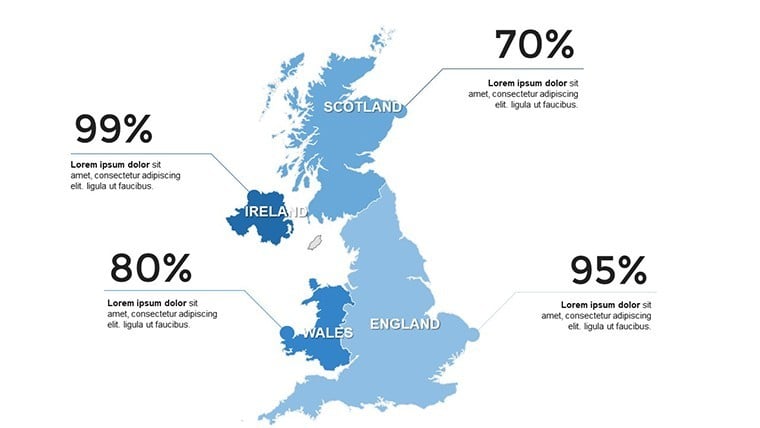
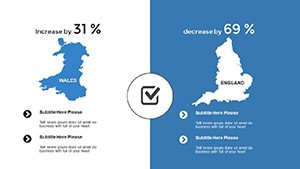
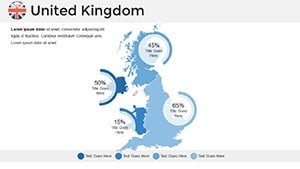
- Handmade Infographics: Integrate diagrams for GDP breakdowns or tourism stats, enhancing data storytelling.
- Innovative Slide Designs: Clean, modern layouts for everything from quick overviews to deep dives into devolved administrations.
- Documentation Included: Quick guides ensure even novices customize swiftly.
Unlike standard Keynote maps, this offers granular control, saving time on revisions and boosting through accurate representations.
Practical Use Cases Tailored to UK Contexts
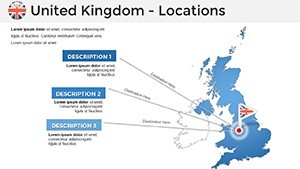
Envision a policy advisor using these maps to illustrate devolution effects: Color-code Scotland in green for renewable energy focus, overlay charts on independence polls. In business, pitch market entry strategies by mapping retail footprints in Manchester versus Belfast, drawing from real cases like post-pandemic recovery plans cited by the British Chambers of Commerce.
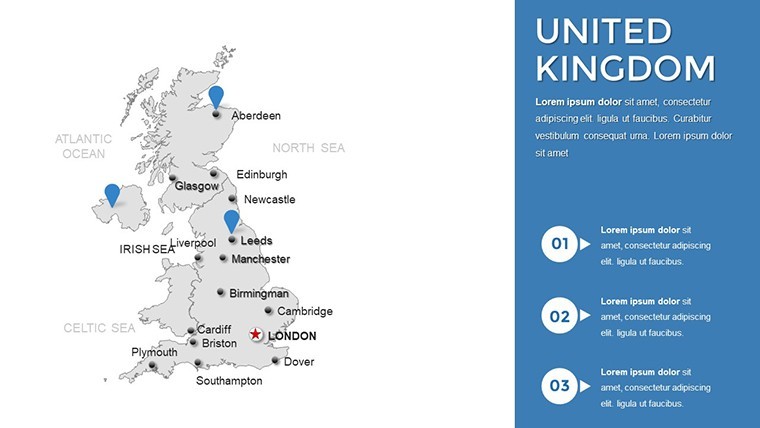
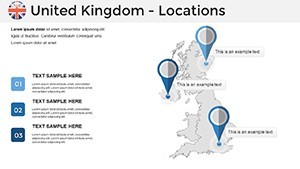
For travel agencies, customize slides with route animations from London to Edinburgh, incorporating icons for landmarks. Step-by-step: 1. Choose your UK base map. 2. Edit regions via double-click - e.g., shade Wales for cultural emphasis. 3. Layer infographics for data like visitor numbers. 4. Animate for narrative flow. 5. Present with confidence, knowing it's polished.
Integrate with Keynote's collaboration tools for team edits. Pro tip: Use subtle color theory - blues for coastal economies - to evoke trust and relevance.
Advanced Customization for Deeper Insights
Go beyond basics with thematic overlays, like economic heat maps inspired by ONS data. This adds authority, as seen in presentations for think tanks analyzing regional disparities.
A user from a London firm noted how it transformed a routine report into an award-winning pitch, highlighting Northern Powerhouse initiatives vividly.
Elevate Your UK-Focused Presentations Now
This template isn't just maps - it's a gateway to influential communication. Trust in its expert design to convey authority, and start crafting stories that matter. Ready to map your success?
Frequently Asked Questions
- What regions are covered in this UK maps template?
- It includes England, Scotland, Wales, and Northern Ireland, with editable political boundaries.
- How do I change map colors in Keynote?
- Double-click the shape and select from the color tab for instant adjustments.
- Is it suitable for educational use?
- Yes, perfect for teaching geography or history with customizable infographics.
- Does it support animations?
- Custom animations are built-in for each object, enhancing engagement.
- What's the file format?
- .key files, compatible with Keynote on Apple devices.
- Can I add my own data?
- Easily integrate charts and grids for personalized data visualization.