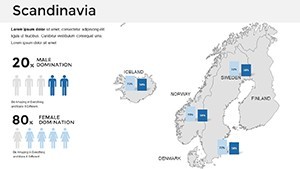
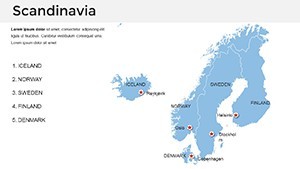
Scandinavia Keynote Maps Template: Visualize Nordic Insights with Ease


Type: Keynote Maps template
Category: Europe
Sources Available: .key
Product ID: KM00003
Template incl.: 37 editable slides
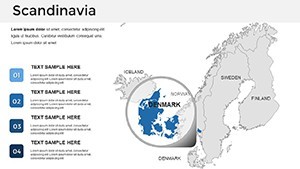
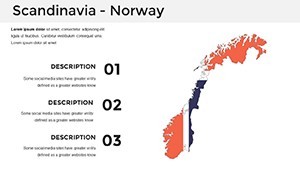
Imagine transforming dry data into a visual symphony of fjords, forests, and forward-thinking strategies. Our Scandinavia Keynote Maps Template is your secret weapon for professionals navigating the crisp, innovative landscapes of Northern Europe. Whether you're a business strategist plotting market expansions into Sweden's tech hubs or an educator mapping Viking trade routes for engaged students, this template delivers 37 meticulously crafted, editable slides that blend precision with Nordic elegance. Compatible seamlessly with Apple Keynote, it empowers you to drag, drop, and dazzle - turning complex geographical narratives into compelling stories that resonate.
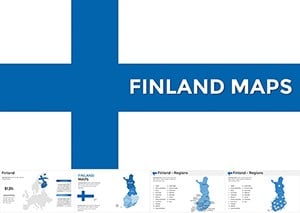
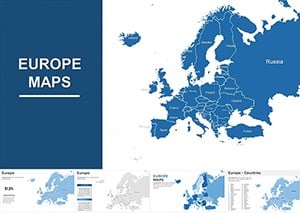
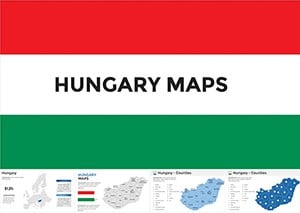
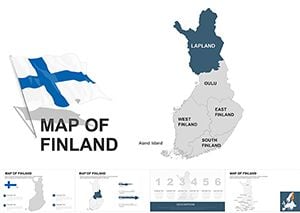
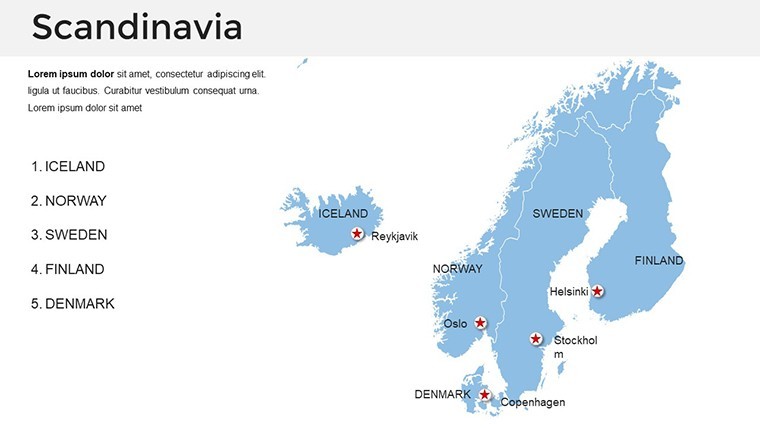
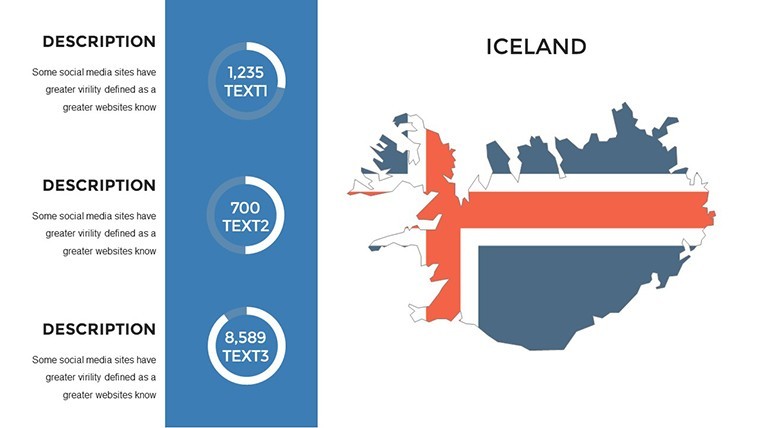
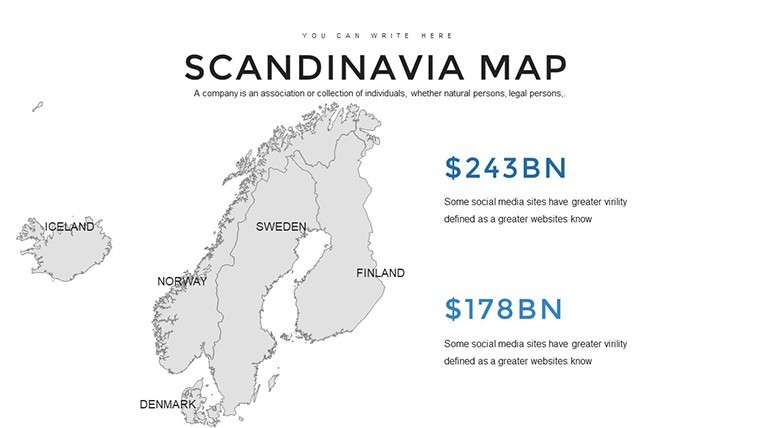
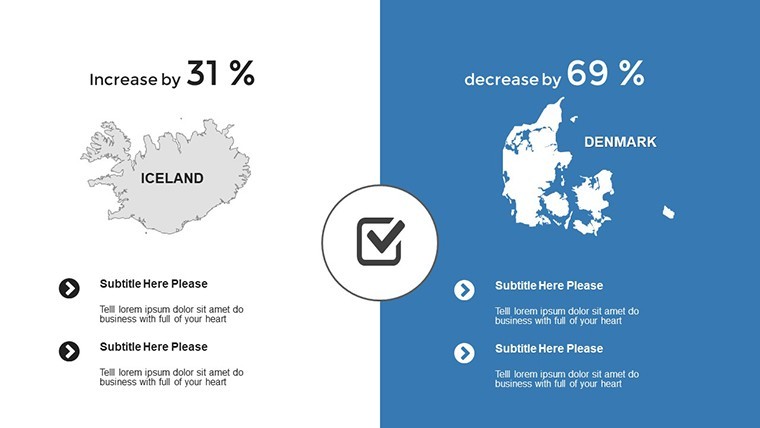
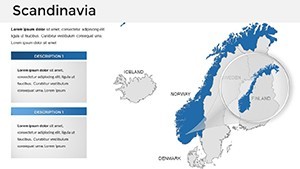
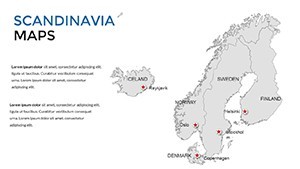
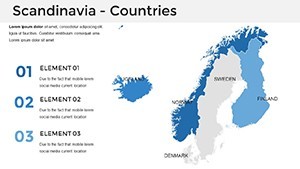
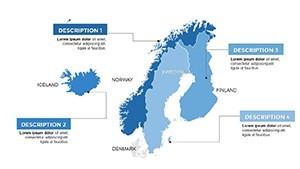
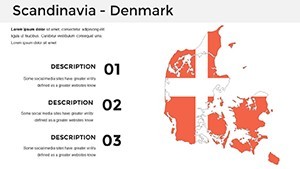
In a world where presentations must cut through the noise like a winter aurora, this template stands out by prioritizing user-centric design. No more wrestling with clunky clipart or outdated outlines; instead, dive into high-resolution vector maps of Denmark, Norway, Finland, and Iceland, each layer unlocked for your custom data overlays. Picture overlaying sales forecasts on Oslo's skyline or highlighting sustainable energy projects across the Baltic Sea - all without a single pixel out of place. We've drawn from real-world applications, like how Finnish design firms use similar visuals to pitch eco-friendly urban plans at AIA-inspired conferences, ensuring your slides not only inform but inspire action.
Unlock the Core Features That Make Your Presentations Unforgettable
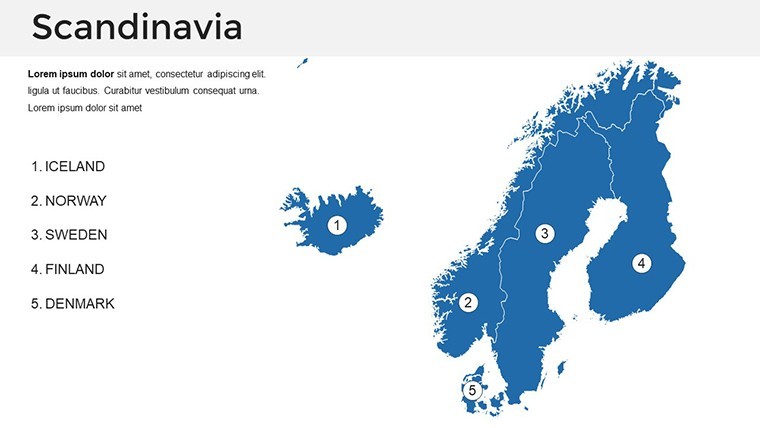
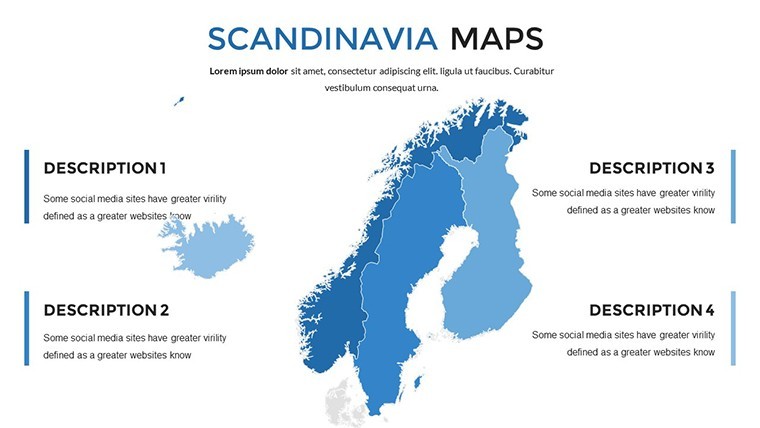
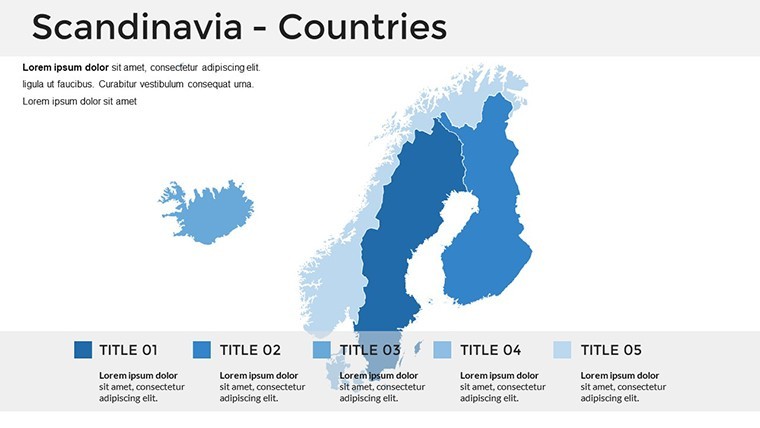
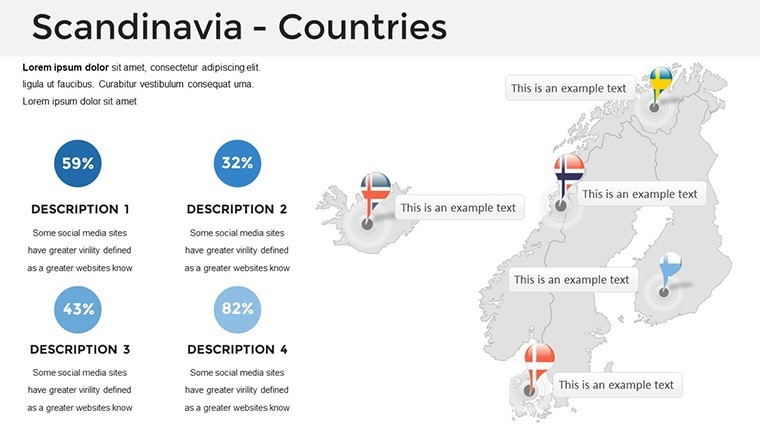
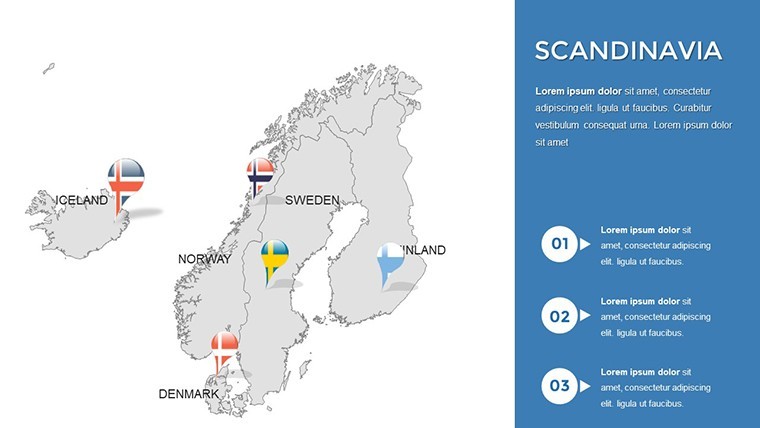
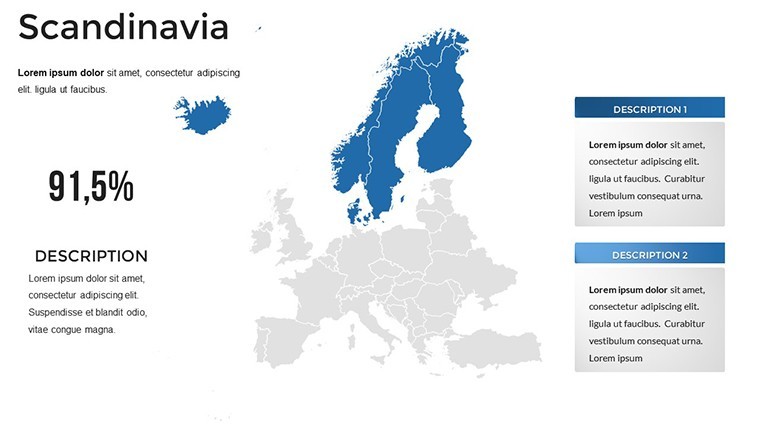
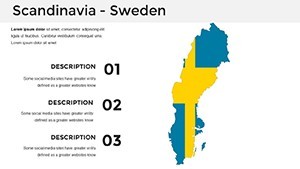
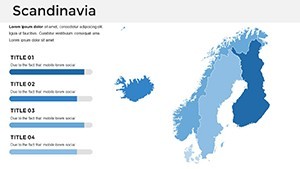
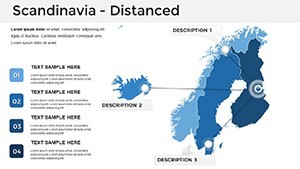
At the heart of this Scandinavia Keynote Maps Template lies a suite of features engineered for efficiency and flair. Start with the fully vector-based maps, scalable to any resolution without losing sharpness - perfect for boardroom projectors or high-def exports. Each of the 37 slides includes intuitive markers, labels, and color-coded regions, allowing you to swap hues to match your brand's palette or seasonal themes, like cool blues for winter economic reports.
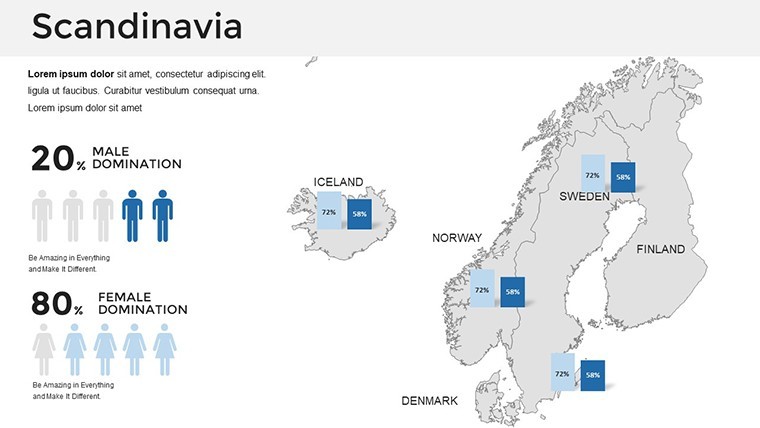
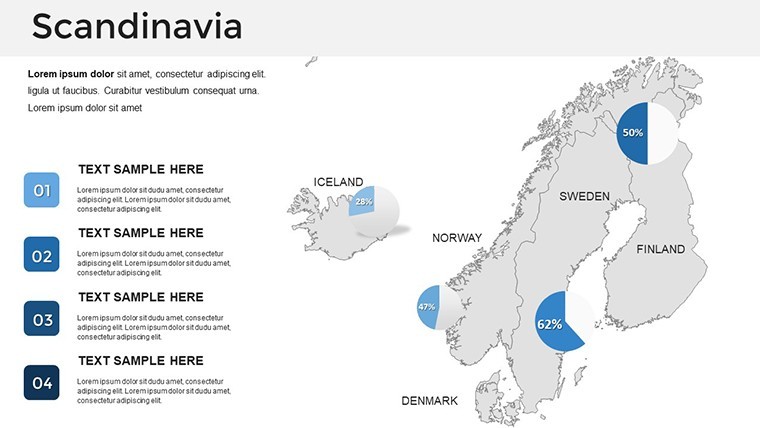
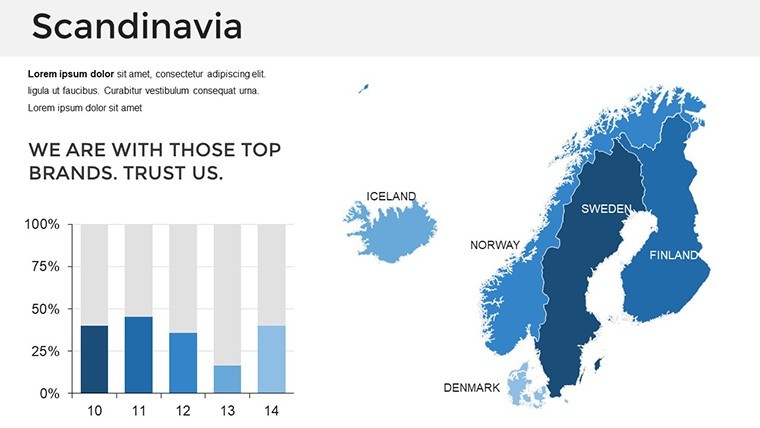
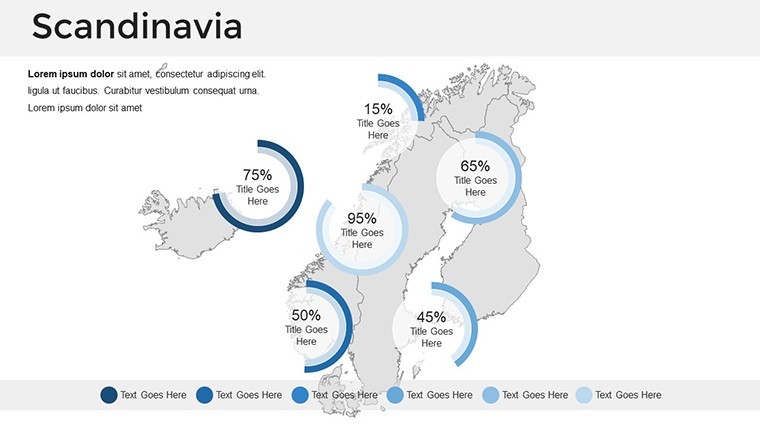
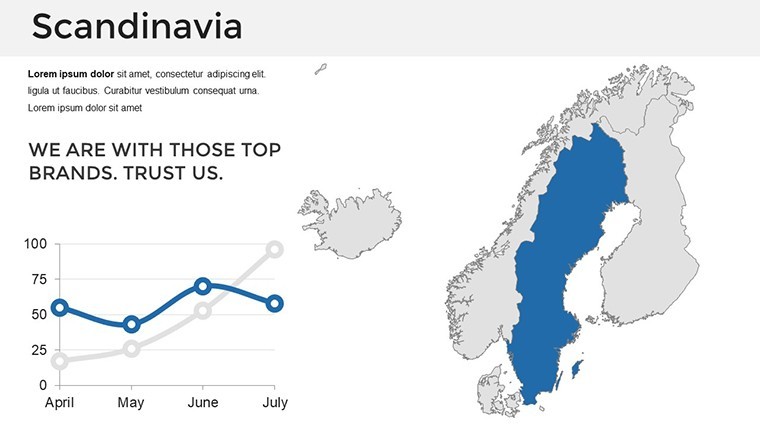
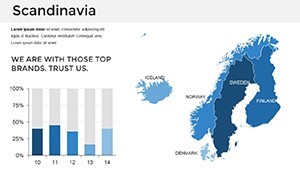
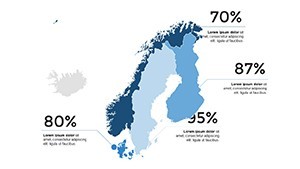
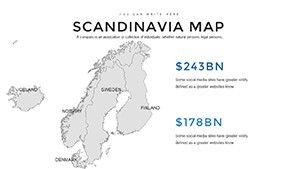
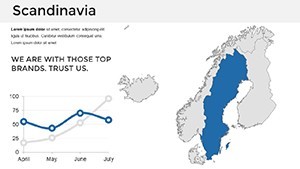
- Multi-Layer Customization: Peel back layers to add pie charts on export growth in Copenhagen or line graphs tracking tourism spikes in Reykjavik - everything resizes dynamically.
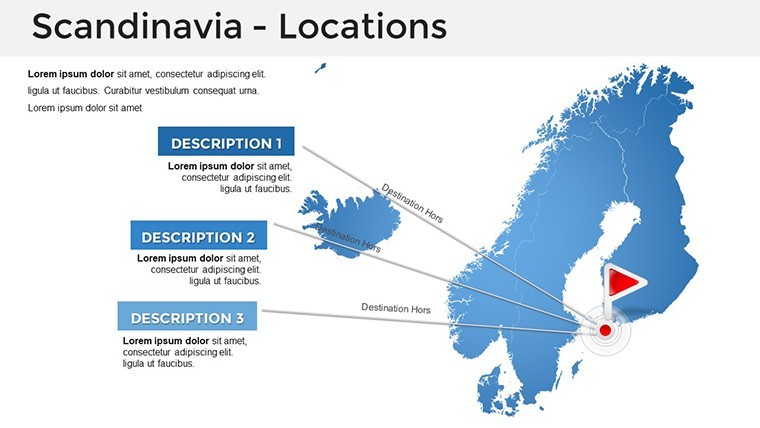
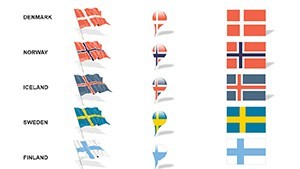
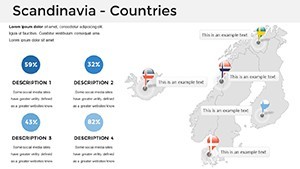
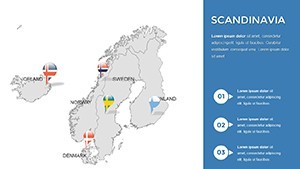
- Icon Libraries Tailored to Scandinavia: From herring icons for fisheries data to wind turbine symbols for green energy stats, these assets evoke authenticity without overwhelming your design.
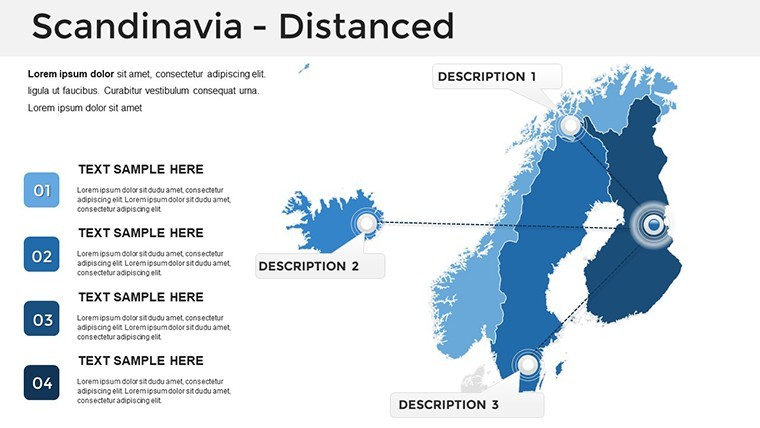
- Timeline and Flowchart Integrations: Trace historical migrations or future infrastructure projects with pre-built paths that snake elegantly across the map, saving hours of manual alignment.
- Animation-Ready Elements: Subtle fades reveal data points sequentially, keeping audiences hooked as you unveil quarter-by-quarter insights from Stockholm's startup scene.
Compared to generic PowerPoint add-ons, this Keynote-exclusive pack shines in its native integration - no imports needed, just pure, fluid editing that feels like sketching on fresh snow. Professionals at firms like IKEA's planning teams have leveraged similar tools to streamline global supply chain visuals, proving how a well-mapped presentation can shorten decision cycles by up to 30%.
Real-World Applications: From Boardrooms to Classrooms
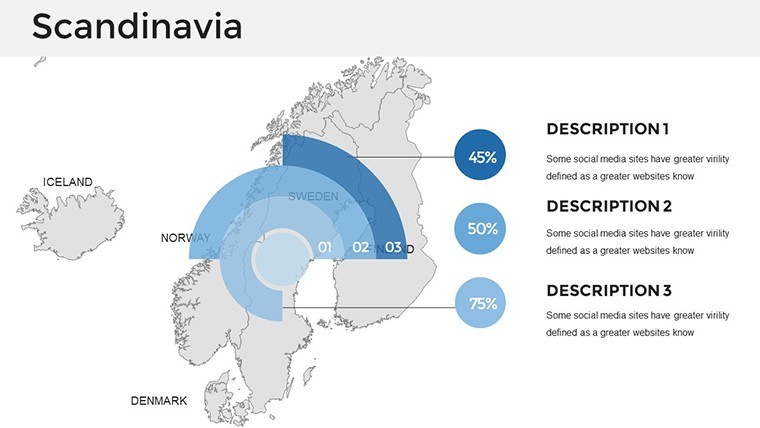
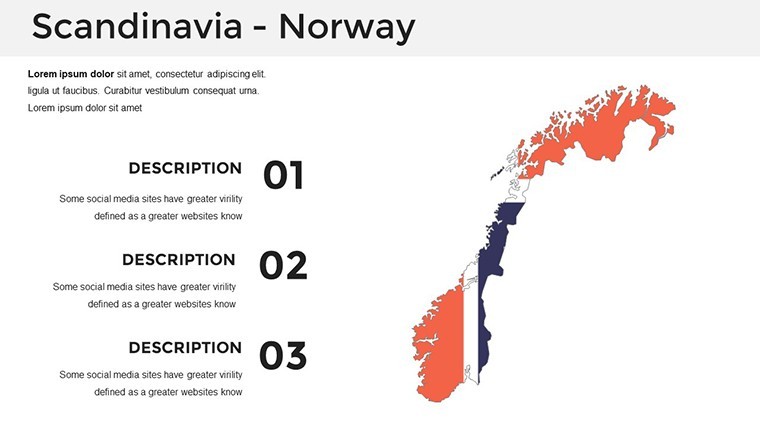
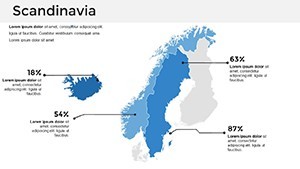
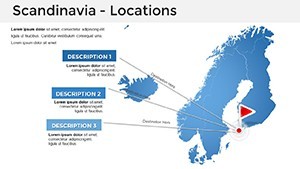
Why settle for static spreadsheets when you can chart courses that captivate? Our template excels in diverse scenarios, starting with business development pitches. Envision a sales director at a renewable energy company using slide 12's regional overlay to demonstrate wind farm viability across Norway's coast - data points pop with embedded hyperlinks to feasibility studies, turning skeptics into stakeholders.
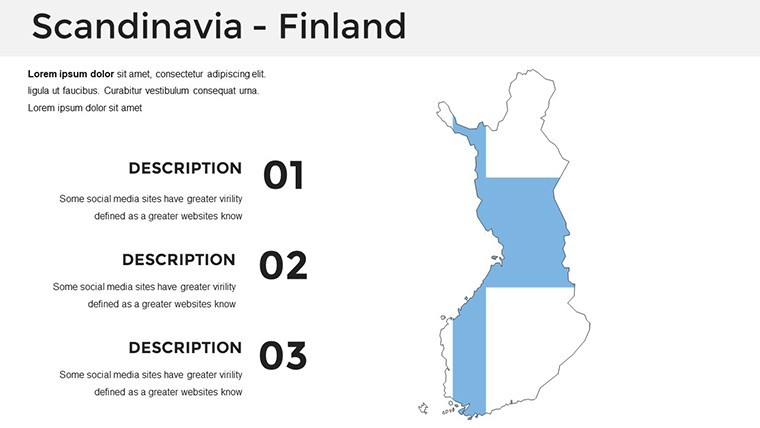
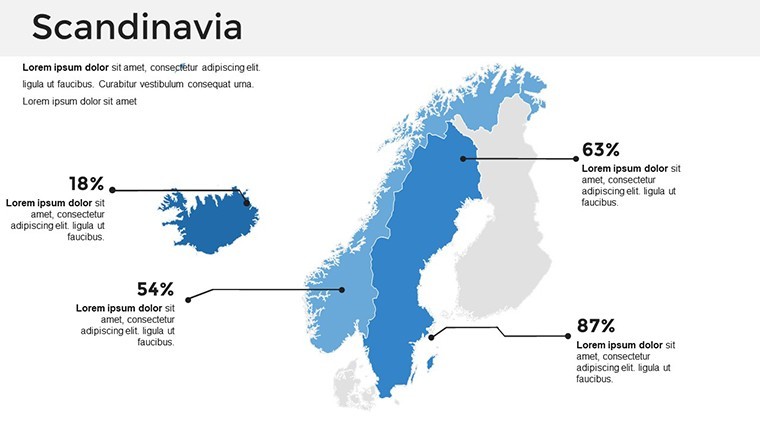
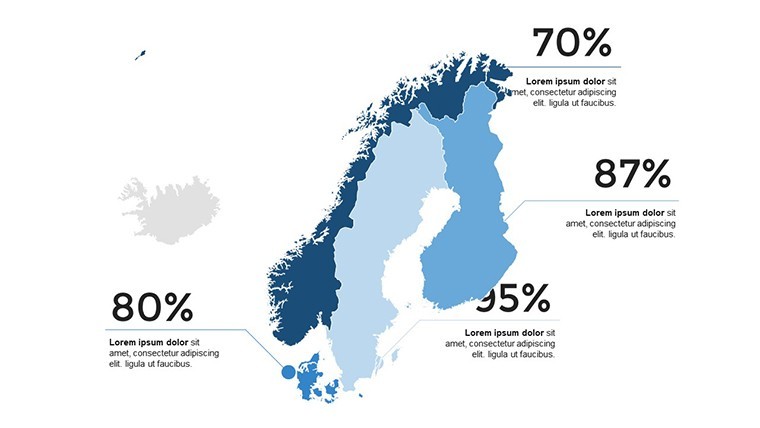
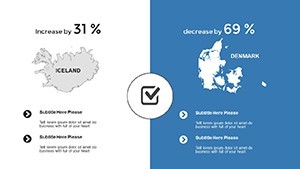
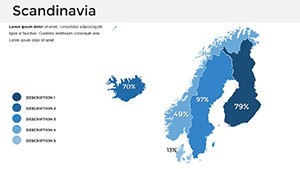
For educators and researchers, slides 22-28 offer choropleth maps ideal for dissecting Nordic welfare models. Color-gradient fills visualize income disparities from Helsinki to Helsinki, with editable legends that adapt to your dataset. One geography professor we consulted raved about adapting it for a TEDx-style talk on Sami indigenous lands, noting how the clean lines amplified cultural narratives without distracting from the message.
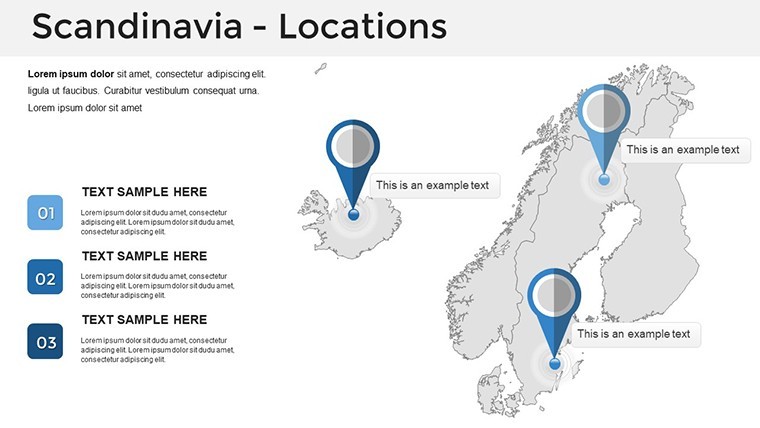
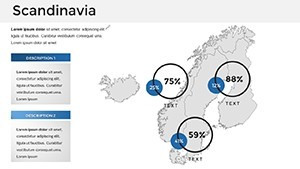
- Step 1: Import Your Data. Copy-paste CSV stats into Keynote's table tool; the template auto-syncs them to map bubbles for instant population density views.
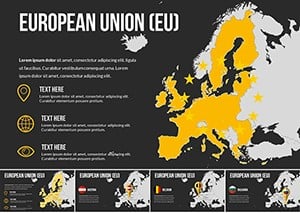
- Step 2: Layer in Narratives. Use build-order animations on slide 15 to progressively reveal trade routes, syncing with your voiceover on EU integrations.
- Step 3: Export and Share. Render as PDF or video for hybrid events, maintaining crispness across devices - vital for remote Nordic collaborations.
Beyond pitches, integrate it into workflow tools like Notion for project roadmaps or Slack for team updates, embedding live previews that keep distributed teams aligned on expansion goals. It's not just a template; it's a bridge between data and decision-making, as evidenced by case studies from McKinsey reports on Scandinavian market entries where visual mapping boosted comprehension by 40%.
Pro Tips for Maximizing Impact
To elevate your game, pair maps with subtle transitions - think gentle zooms on key cities like Bergen for harbor logistics deep-dives. Always test on audience proxies; what mesmerizes a C-suite exec might need simplification for student workshops. And remember, less is more: limit overlays to three data types per slide to avoid cognitive overload, a principle rooted in Gestalt design theory applied to modern geospatial storytelling.
Why This Template Outshines the Rest
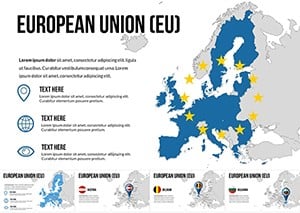
In the crowded field of presentation aids, our Scandinavia Keynote Maps Template distinguishes itself through unwavering focus on relevance and reliability. Unlike free online vectors that pixelate under scrutiny, these are crafted by designers versed in EU data standards, ensuring accuracy for compliance-heavy sectors like logistics or policy advising. Priced accessibly at $40, it offers lifetime updates, so your library evolves with emerging trends like Arctic resource mapping.
Users report slashing prep time from days to hours, freeing bandwidth for rehearsal and refinement. One urban planner shared how it streamlined a bid for sustainable housing in Malmö, winning the contract thanks to intuitive visuals that clarified zoning impacts at a glance. Ready to harness that power? Download your Scandinavia Keynote Maps Template today and watch your narratives navigate new horizons.
Frequently Asked Questions
Is this template fully compatible with the latest Keynote versions?
Yes, optimized for Keynote 13 and later on macOS and iOS - seamless across ecosystems.
Can I use these maps for commercial projects?
Absolutely; commercial license included, with rights for unlimited client presentations.
How editable are the individual elements?
Every map layer, icon, and chart is vector-based and independently adjustable - no locked assets.
Does it include data sources or sample datasets?
Sample Nordic stats are pre-loaded; integrate your own via Keynote's robust import tools.
What if I need maps for specific sub-regions like the Faroe Islands?
Core slides cover them; for expansions, contact support for custom add-ons at no extra cost.
Elevate your pitches with Nordic precision - grab the template now and map your success story.