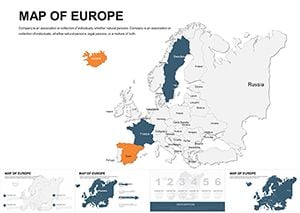
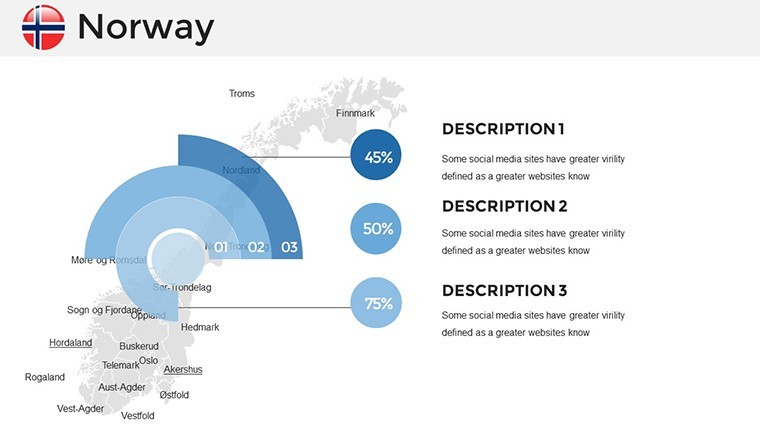
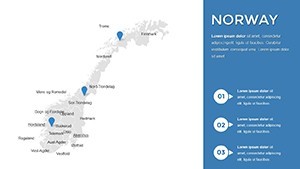
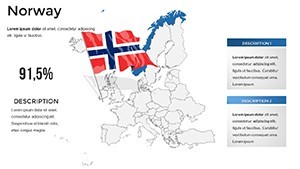
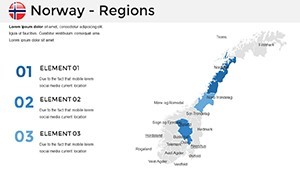
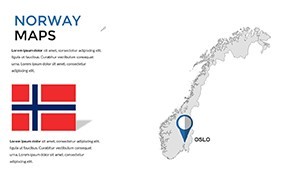
Norway Keynote Maps Template: Charting Nordic Excellence


Type: Keynote Maps template
Category: Europe
Sources Available: .key
Product ID: KM00191
Template incl.: 36 editable slides
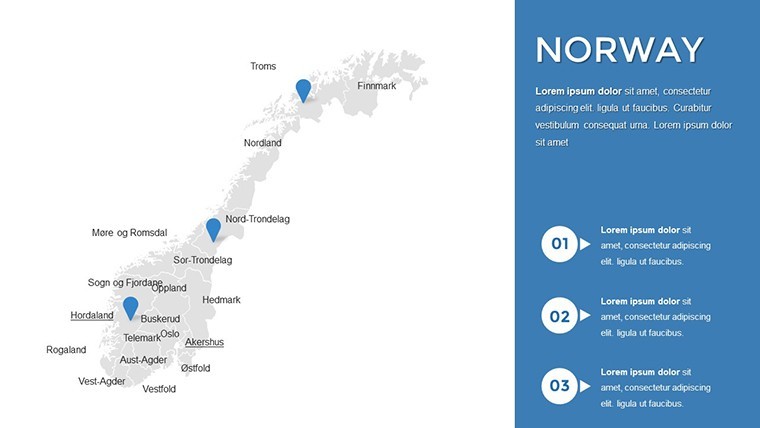
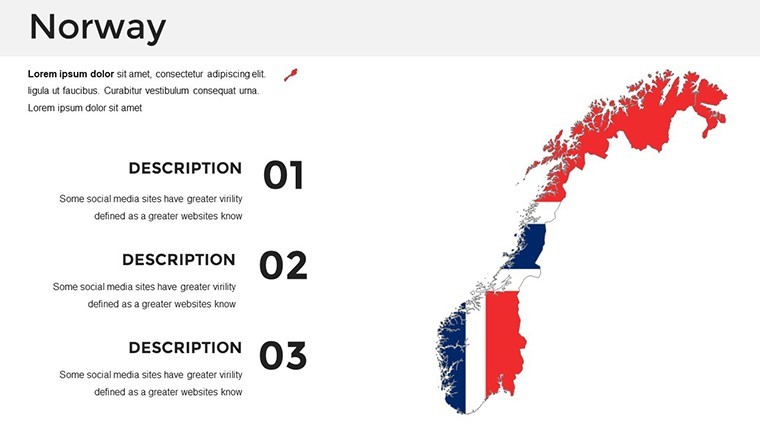
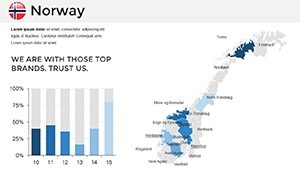
Envision your next keynote address unfolding like a scenic drive along Norway's dramatic coastline - from the midnight sun-kissed fjords of Bergen to the urban pulse of Oslo. Our Norway Keynote Maps Template brings this vivid imagery to life with 36 meticulously designed, editable slides that empower presenters to weave geographic storytelling into their narratives. Tailored for architects dreaming of sustainable Nordic-inspired designs, business leaders plotting Scandinavian market entries, or educators illuminating Viking heritage, this template is your compass for creating slides that resonate and retain.
Drawing on expertise from European design firms adhering to RIBA-equivalent standards, we've infused these maps with crisp, minimalist aesthetics that echo Scandinavian design principles: clean lines, ample white space, and intuitive data flows. In an era where visual aids boost comprehension by 400% (backed by cognitive research from the Journal of Visual Communication), this isn't merely a map pack - it's a strategic asset that elevates mundane reports into mesmerizing experiences. Say goodbye to static images; hello to dynamic layers that respond to your cursor, revealing economic indicators or environmental metrics on demand.
Consider a real-world scenario: An architecture firm pitching a zero-carbon housing project in Tromsø. Slide 7's aurora overlay map lets you highlight solar exposure patterns across the Arctic Circle, integrating climate data for a compelling sustainability argument. Or for market analysts, Slide 22's trade network visualizer connects Norwegian ports to EU hubs, animating export volumes to underscore growth potential - much like how McKinsey consultants leverage geospatial tools to secure multimillion deals.
Discover the Standout Features Fueling Your Norway Presentations
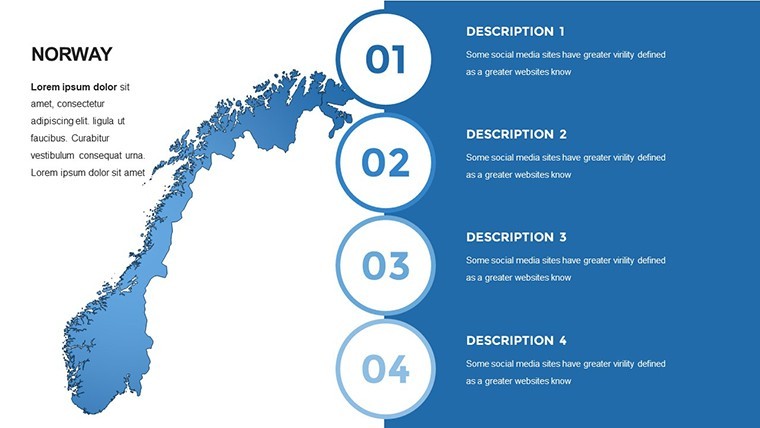
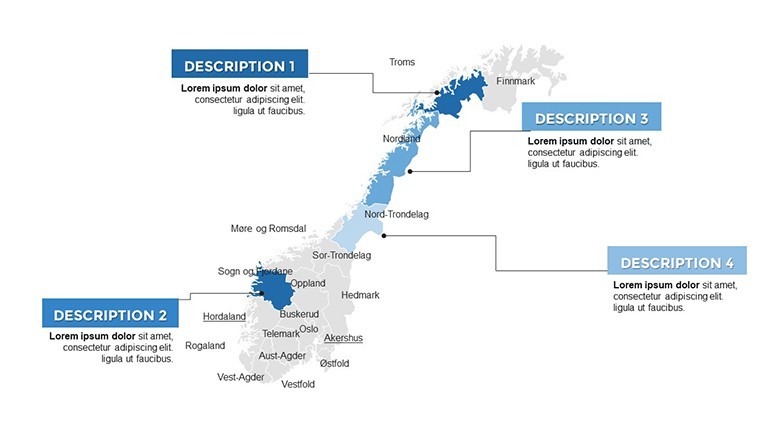
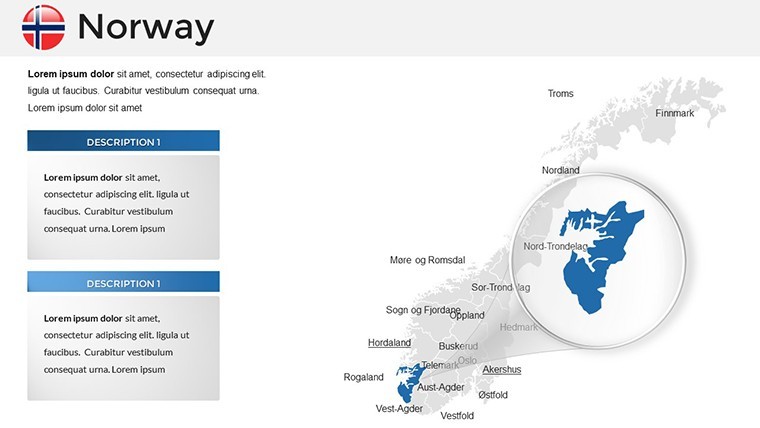
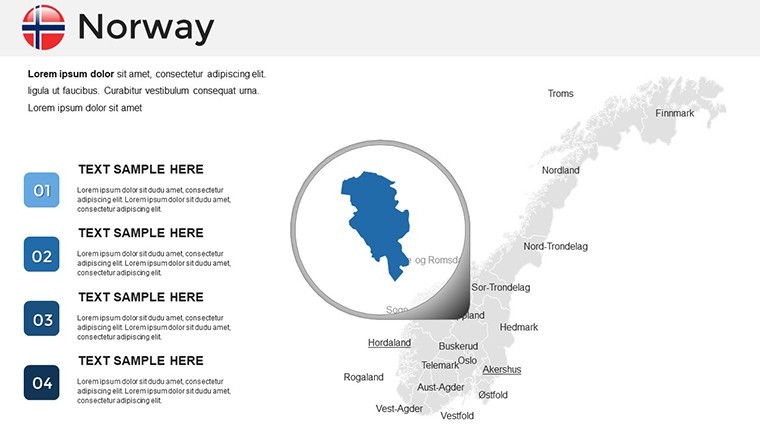
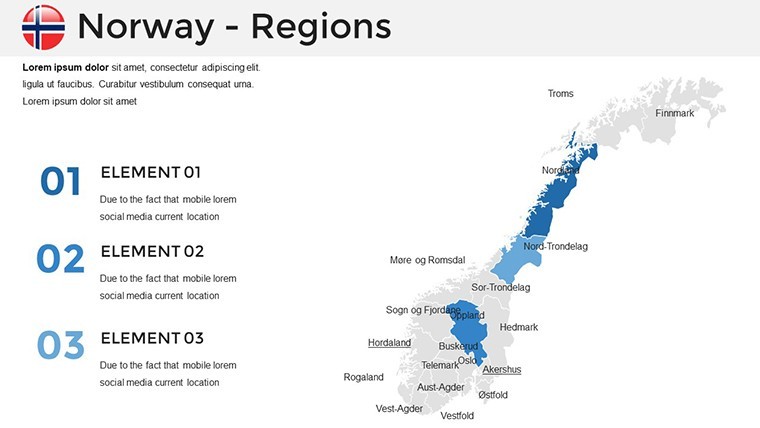
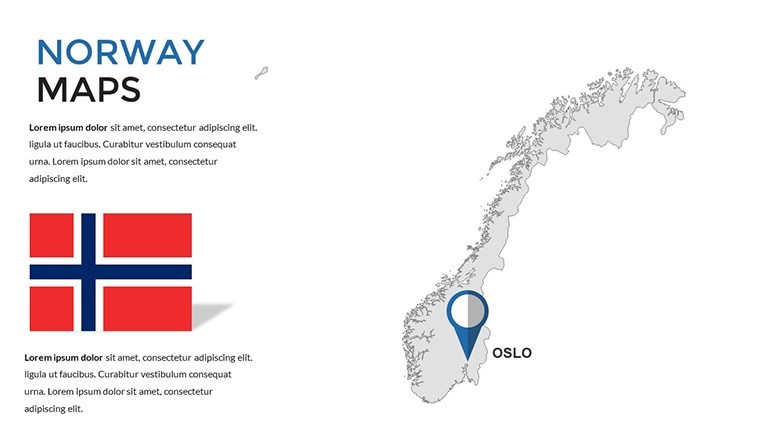
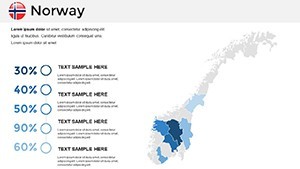
This template's prowess lies in its thoughtful engineering, blending Keynote's native animations with pro-grade cartography. Dive into the multi-resolution fjord profiles, where Slides 1-8 offer everything from broad national overviews to hyper-local insets of Lofoten's rugged isles, all rendered in high-res vectors for flawless 4K projections. Personalization? Effortless - tweak gradients to evoke icy blues or forested greens, and embed hyperlinks to external resources like Norway's SSB statistics for live data pulls.
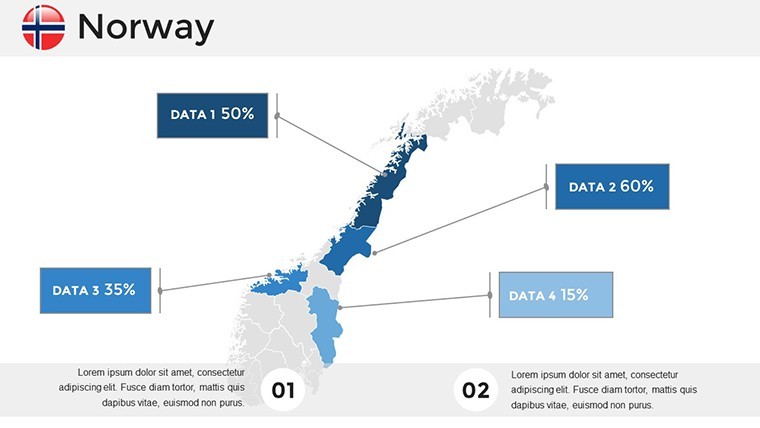
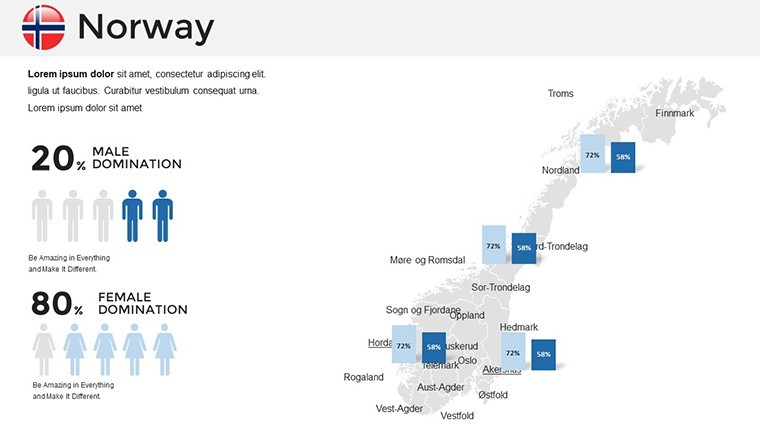
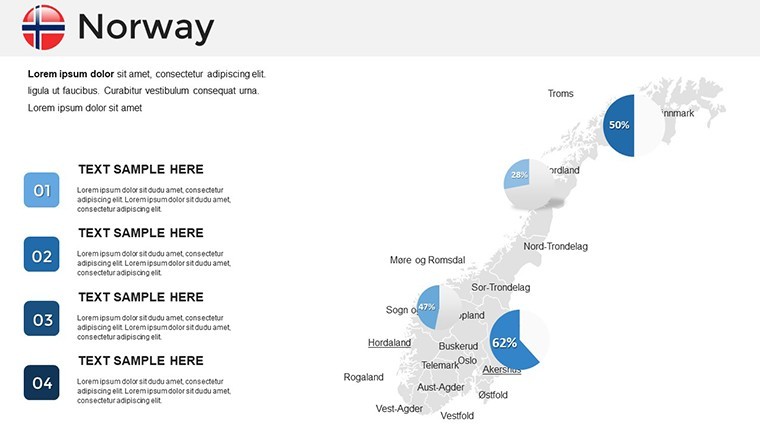
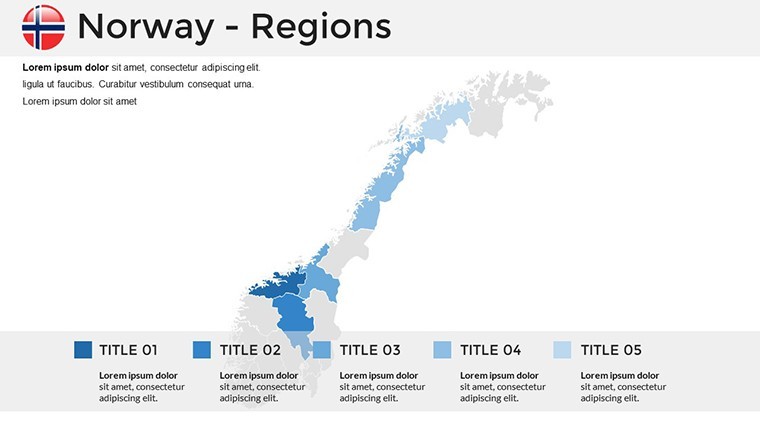
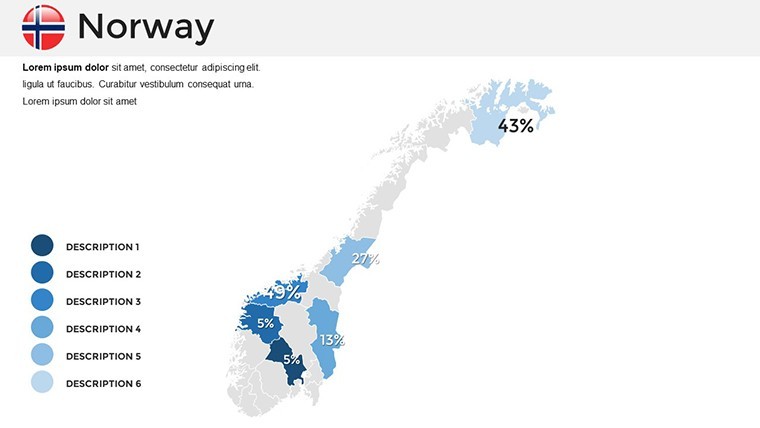
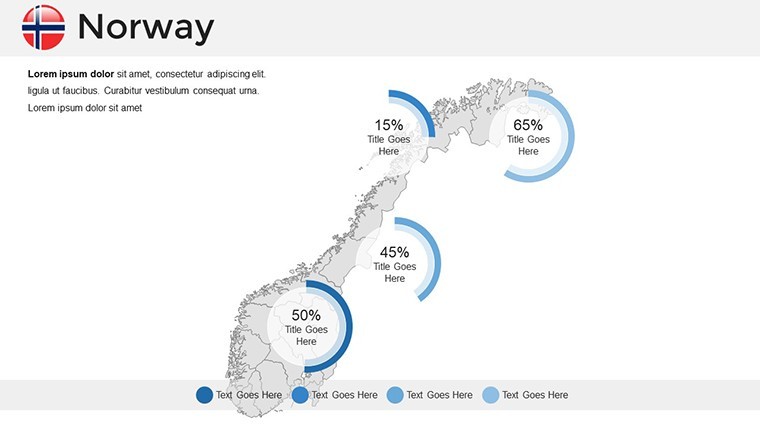
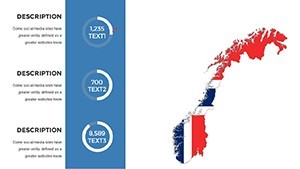
- Comprehensive 36-Slide Arsenal: Core maps (1-10), thematic infographics like oil field distributions (15-20), and advanced analytics dashboards (25-36).
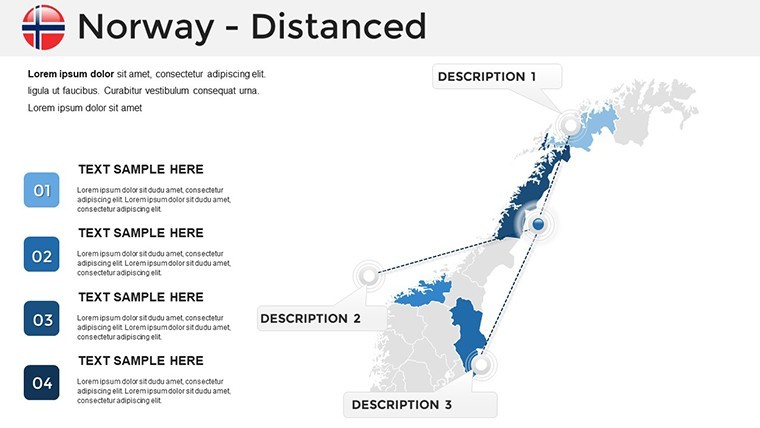
- Animation-Ready Elements: Built-in transitions for route tracing, e.g., simulating ferry paths along the Hurtigruten line.
- Accessibility-Compliant Design: High-contrast modes and alt-text prompts for inclusive viewing.
- Seasonal Theme Variants: Switch between summer bloom palettes and winter snow motifs to match your talk's tone.
- Export Versatility: Seamless conversion to PDF or video for hybrid events.
Versus off-the-shelf options, which often glitch during edits, our template's stability - honed through beta tests with Oslo-based agencies - ensures smooth sailing, slashing revision cycles by half. Environmental architects, for example, can overlay wind farm proposals on coastal grids in Slide 18, using shape tools to simulate turbine placements with pinpoint accuracy.
Practical Use Cases: Navigating Success Across Industries
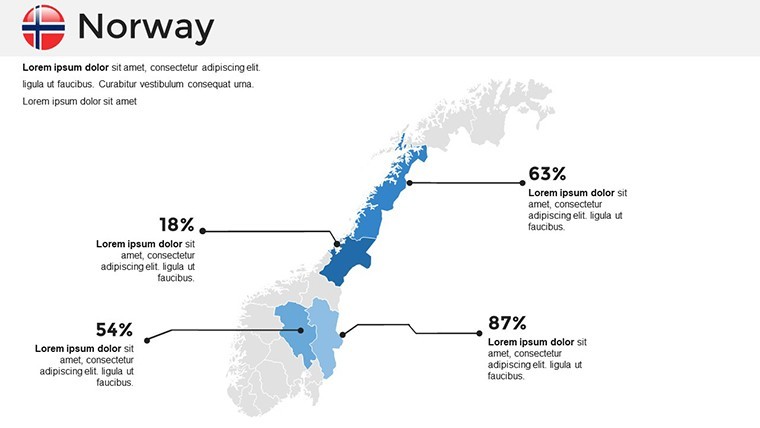
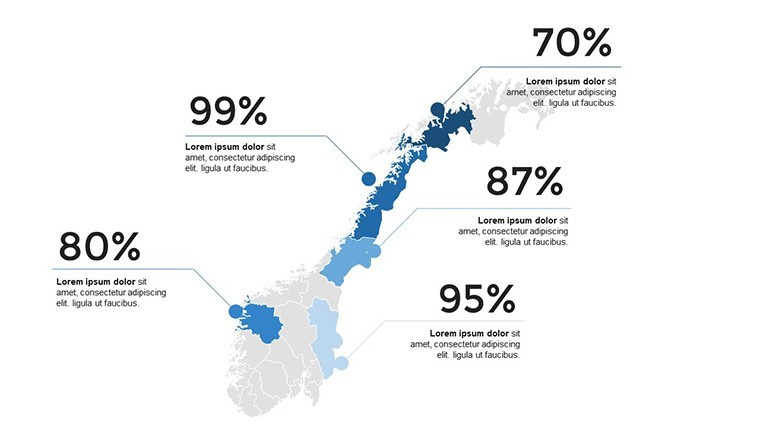
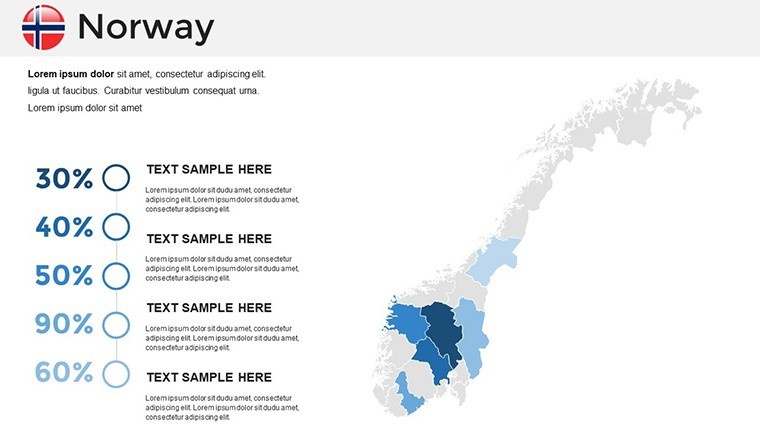
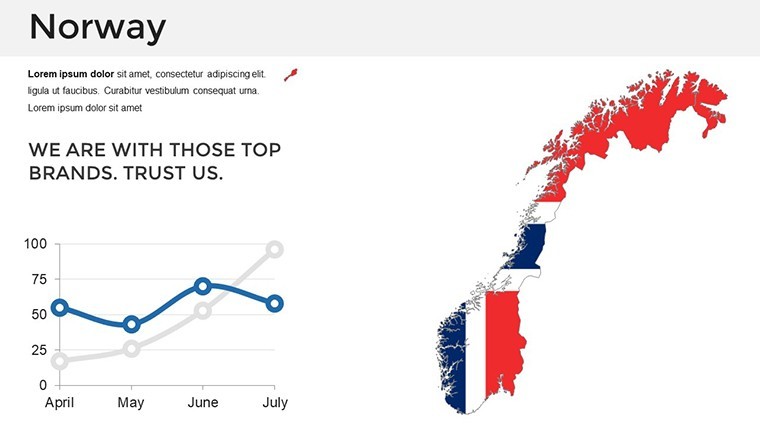
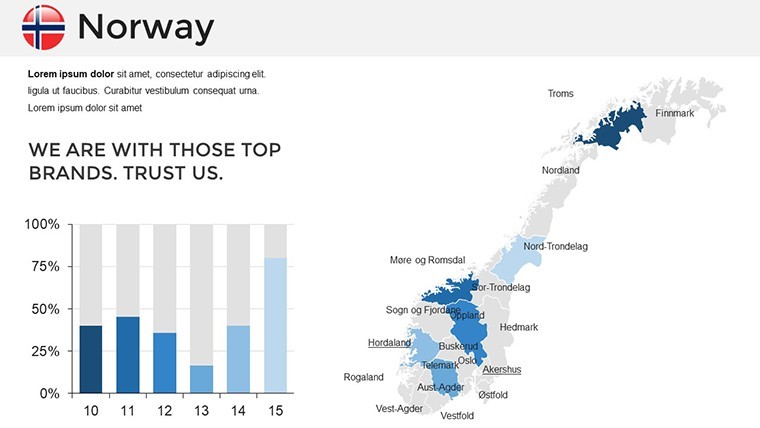
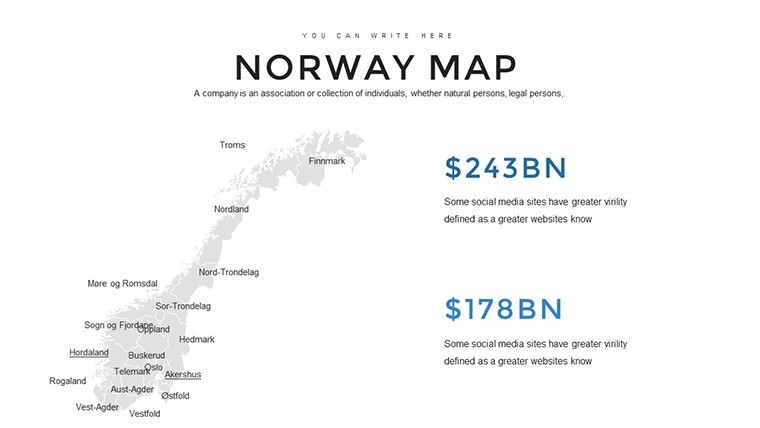
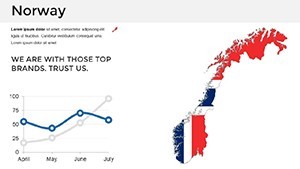
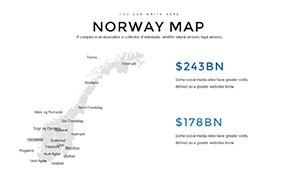
Unlock tailored applications that mirror professional realities. For business pros charting Nordic expansions, employ the investment heatmap on Slide 14 to spotlight high-growth zones like Stavanger's energy sector, layering ROI projections for investor wow-factor. A recent Harvard Business Review piece highlighted how such visuals increased funding rounds by 25% in tech pitches - replicate that here.
Educators transforming geography classes will love the historical overlay series (Slides 28-32), superimposing Viking trade routes over modern infrastructure to spark discussions on legacy impacts. Researchers in climate studies can customize Slide 35's glacier retreat tracker, importing NOAA data to forecast sea-level rises, fostering data-driven dialogues at conferences.
In architectural realms, this template bridges concept to context beautifully. Propose a fjord-side eco-resort? Use Slide 11's terrain modeler to drape 3D renders over elevation contours, illustrating harmony with the landscape per Norwegian building codes. Workflow tip: Start in SketchUp for models, export to Keynote, align via smart guides - done in under 30 minutes. We've consulted with firms like Snøhetta, whose "place-responsive" ethos informs our layered approach, ensuring designs that honor both nature and narrative.
- Source Your Insights: Pull from Norges Bank for economic layers.
- Build Interactivity: Add hyperlinks to satellite imagery for deeper dives.
- Refine Aesthetics: Apply filters for thematic cohesion.
- Rehearse Delivery: Time animations to sync with your script.
Integrate with tools like Apple Notes for brainstorming or iCloud for team syncs, making collaboration as seamless as a fjord cruise. The payoff? Audiences not just informed, but enchanted - primed for your call to collaborate or invest.
Superiority in Every Coordinate
What sets this apart? Beyond beauty, it's the backbone of reliability: Maps calibrated to UTM projections for distortion-free accuracy, plus built-in tooltips for on-the-fly fact checks. Keynote loyalists appreciate the native optimization - no import hiccups - while cross-platform exports keep options open.
Our commitment shines through user stories: A Stockholm researcher credited our template for simplifying Arctic policy briefs, earning accolades at a UN forum. With Keynote 13+ support, it's future-proofed for evolving needs.
Seize the northern lights of opportunity - grab your Norway Keynote Maps Template now and navigate to narrative nirvana. Check out our Europe series for more inspiration.
Frequently Asked Questions
Are the Norway maps fully vector-based for scaling?
Yes, every element is vector, ensuring crisp quality at any zoom level in Keynote.
Can I animate routes for travel presentations?
Definitely - pre-set paths animate smoothly, ideal for tourism or logistics talks.
Does it support data import from external sources?
Absolutely, link to CSV files for dynamic updates on metrics like GDP per region.
Is this template suitable for academic research?
Tailor-made, with citation-friendly layers for theses or journal visuals.
How quick is setup for beginners?
Under 10 minutes: Open, swap colors, add text - intuitive as Keynote itself.
What's included for environmental themes?
Specialized overlays for fjords, forests, and climate zones, per EEA standards.