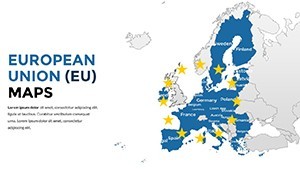
European Union Keynote Maps: Unlock Comprehensive Insights Across Borders


Type: Keynote Maps template
Category: Europe
Sources Available: .key
Product ID: KM00175
Template incl.: 61 editable slides
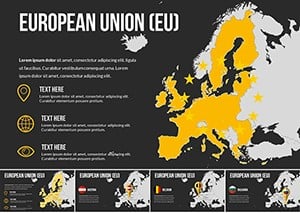
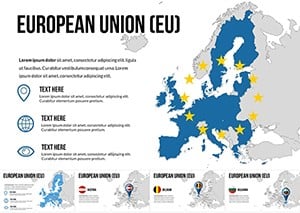
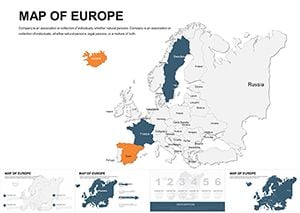
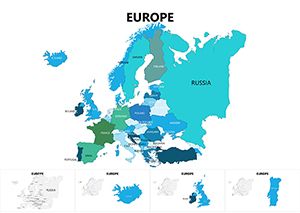
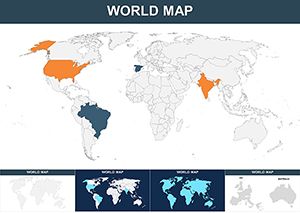
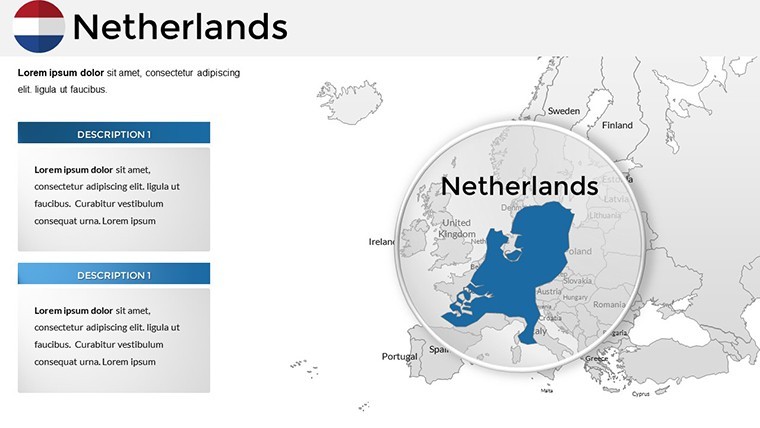
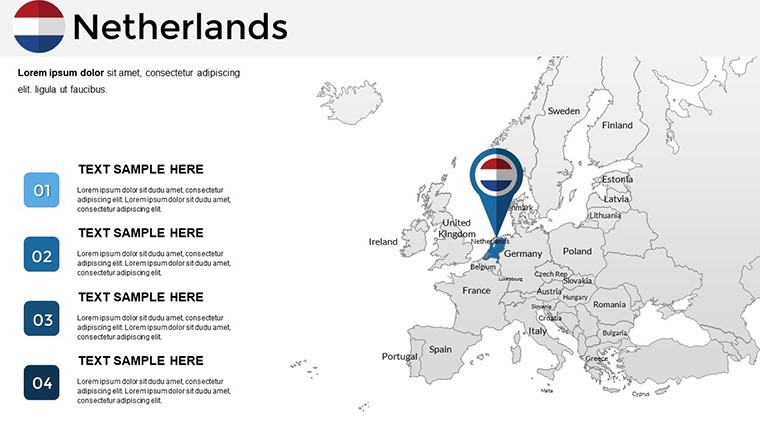
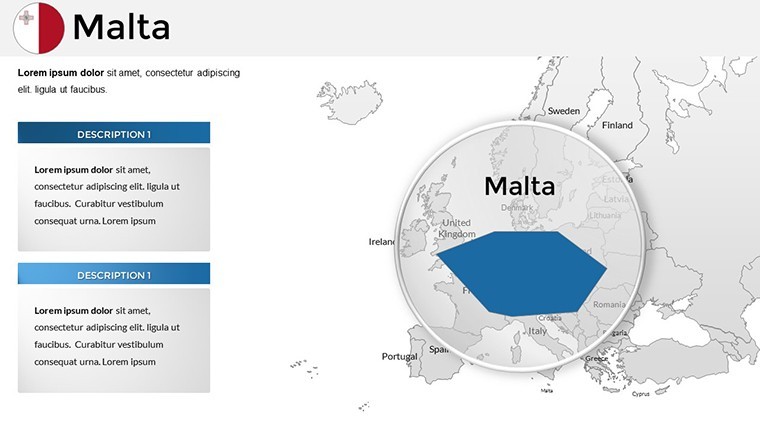
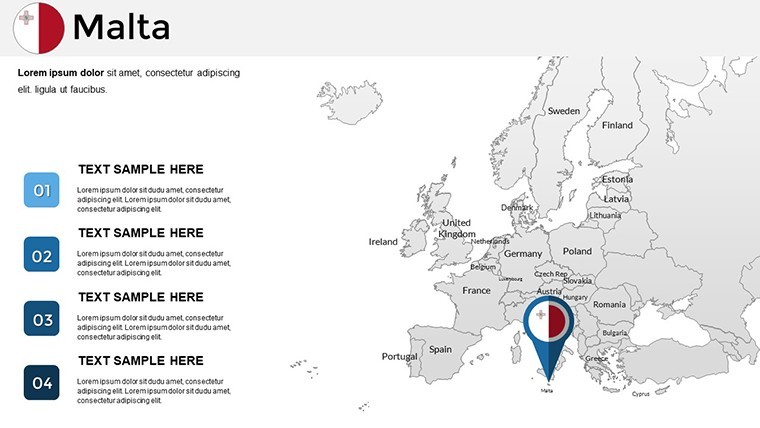
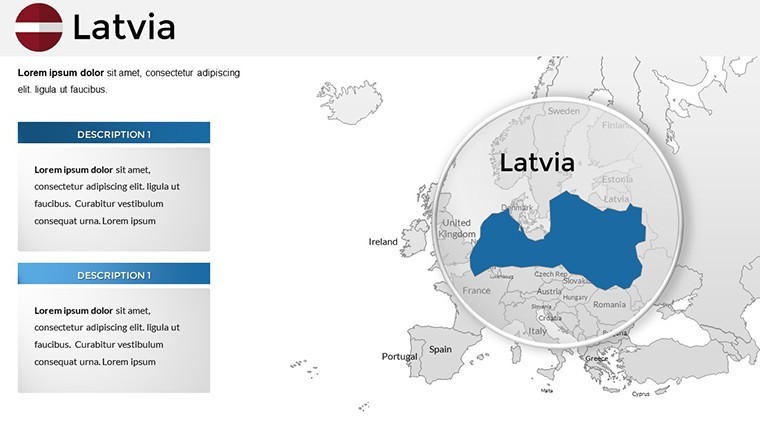
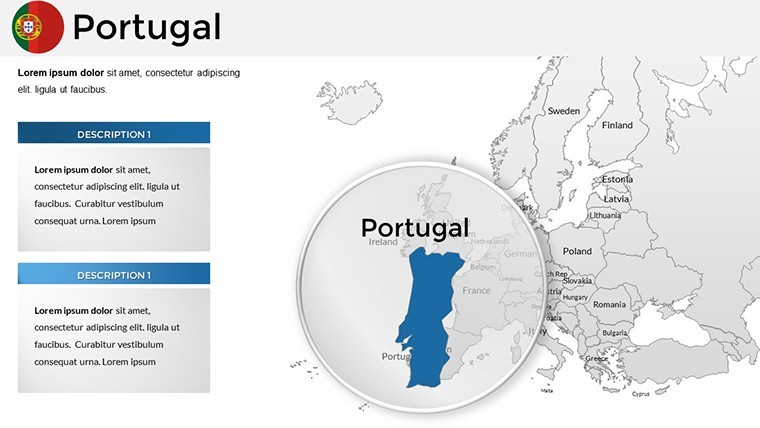
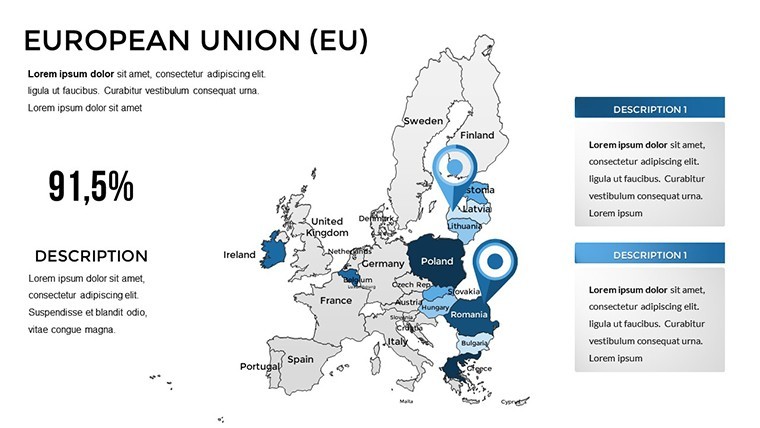
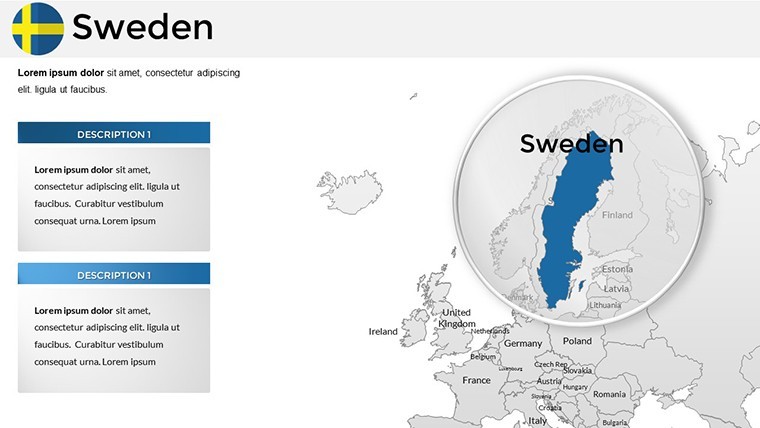
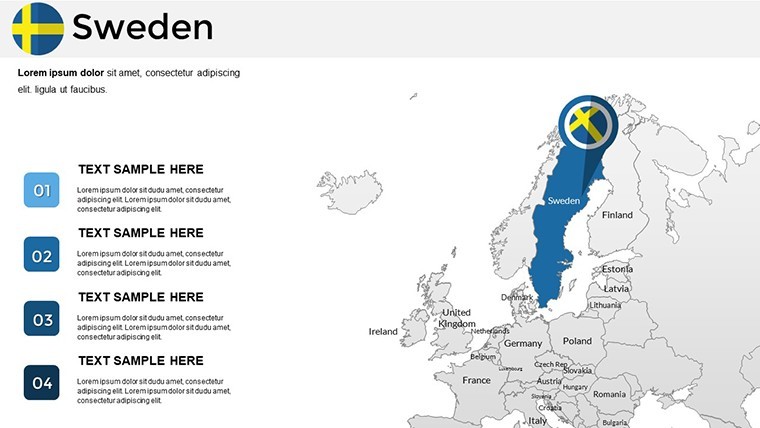
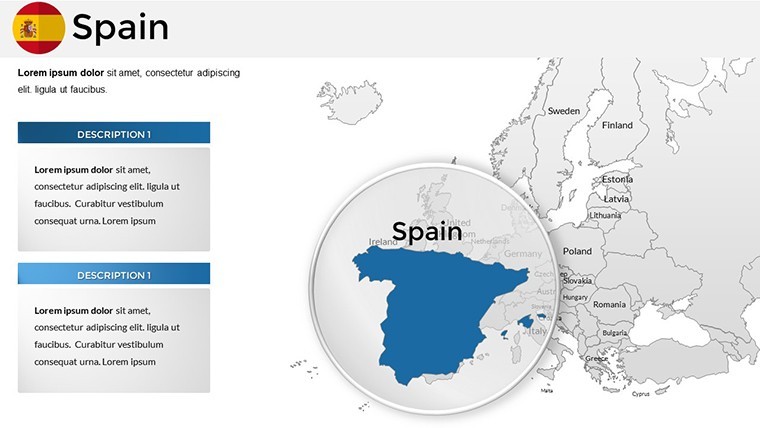
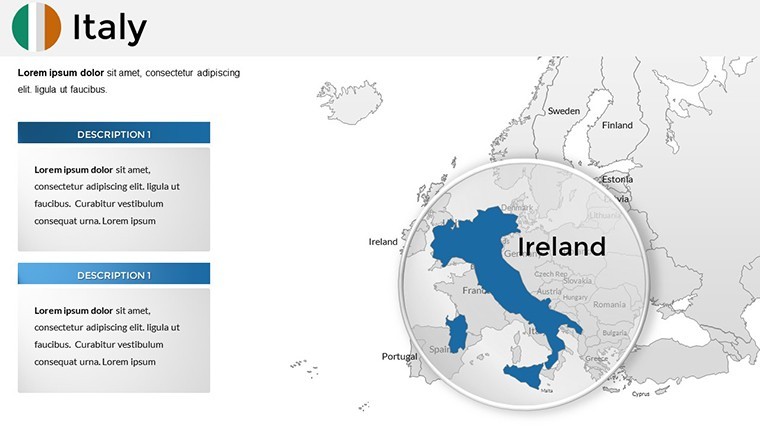
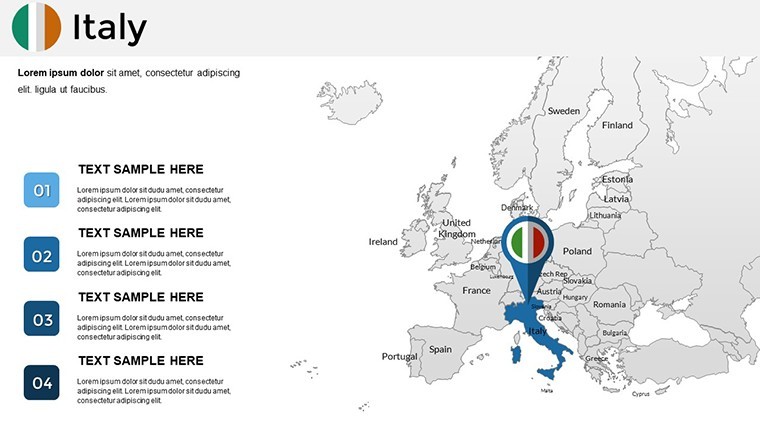
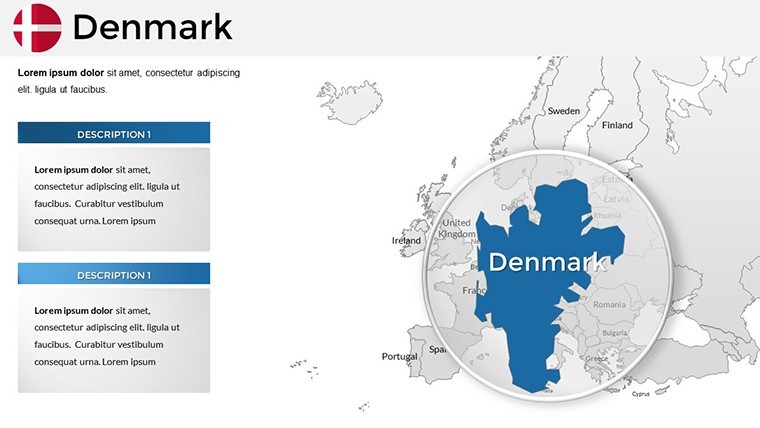
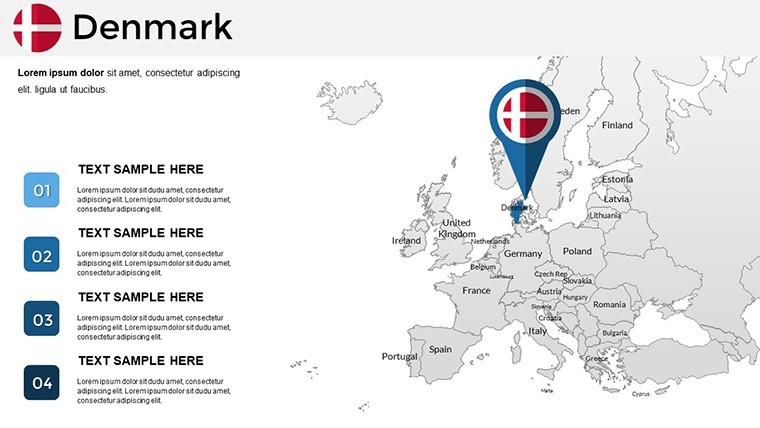
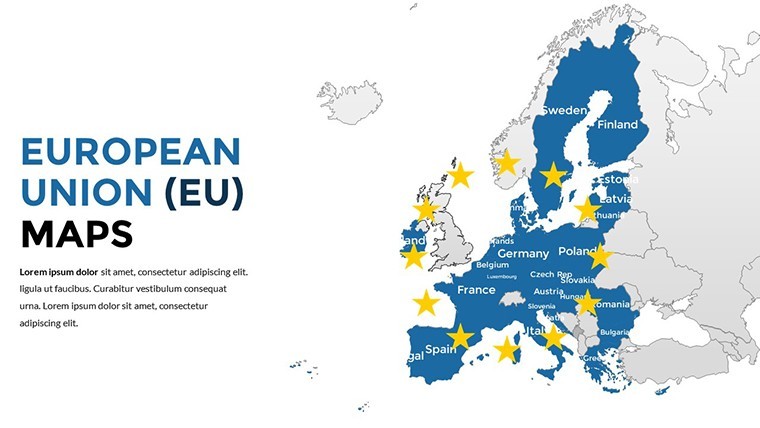
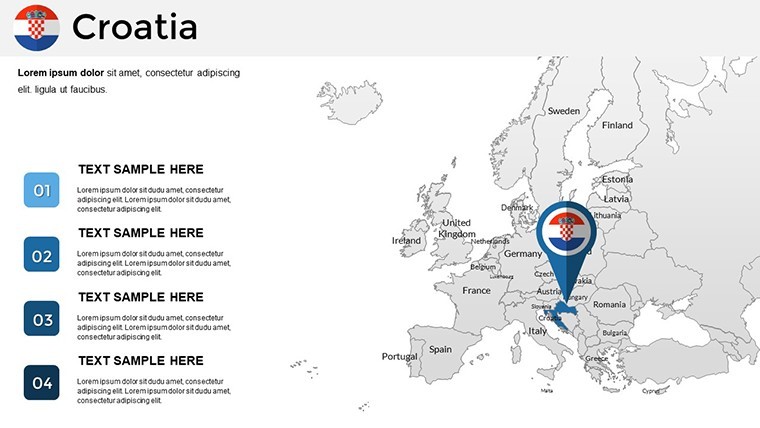
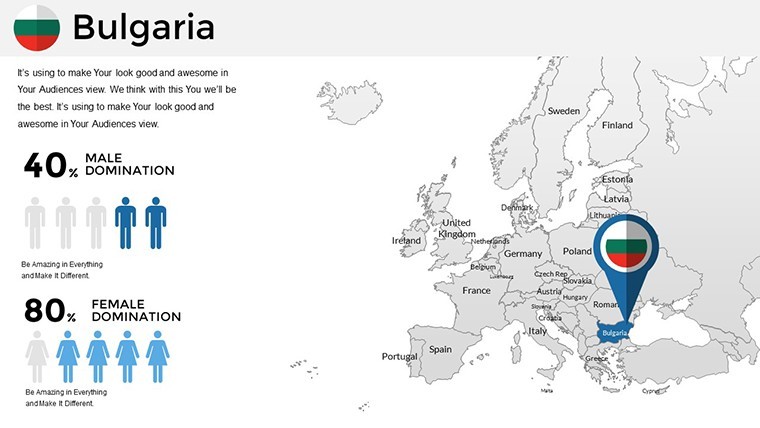
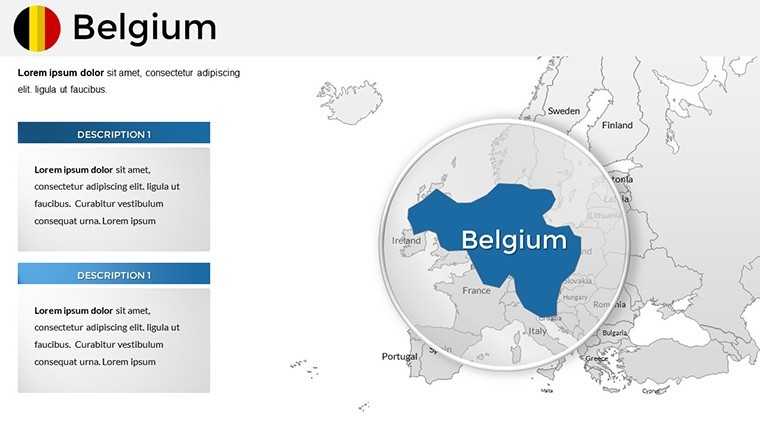
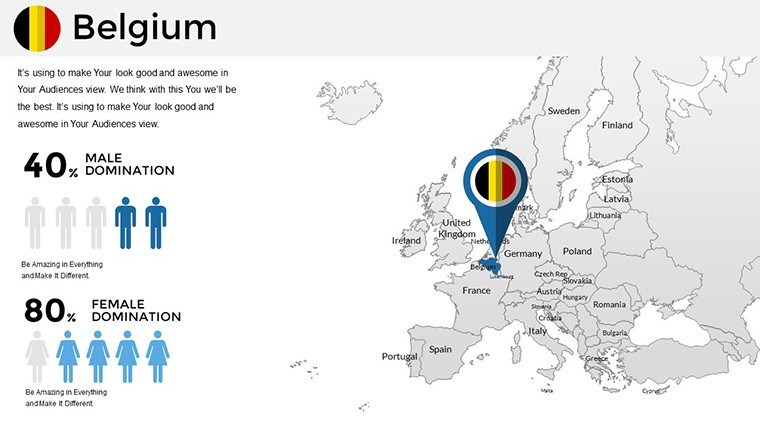
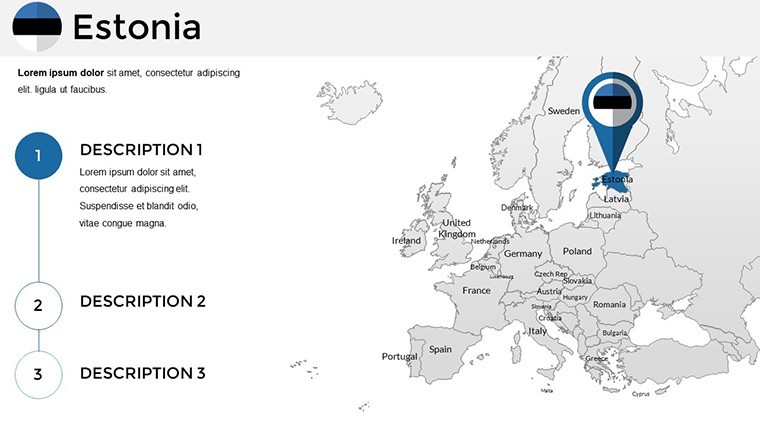
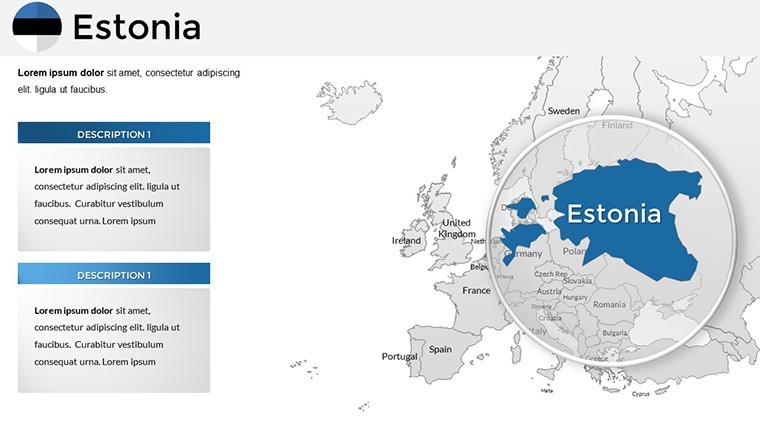
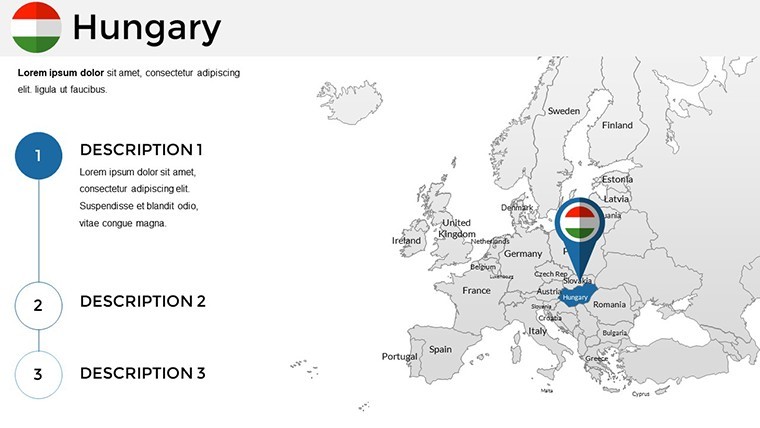
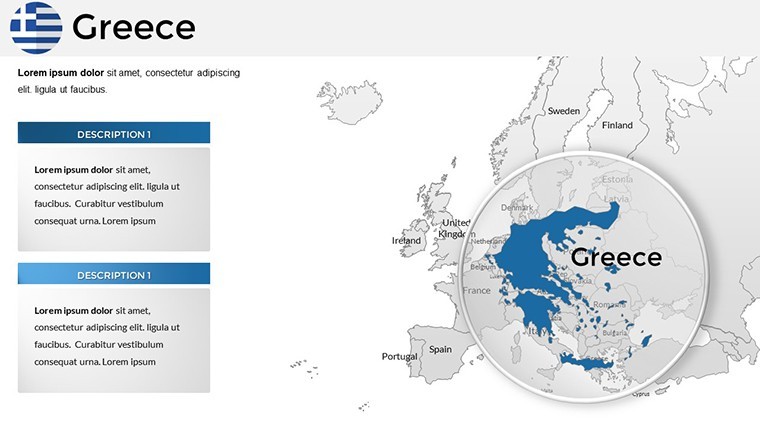
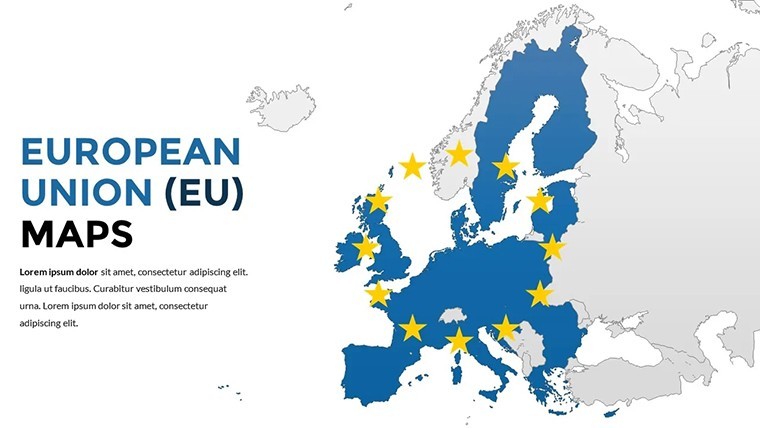
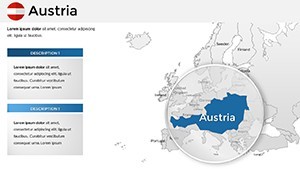
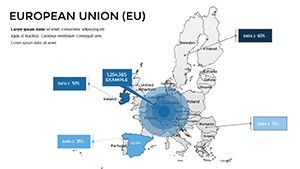
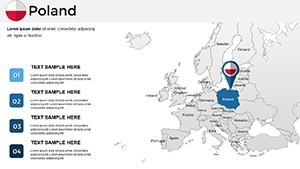
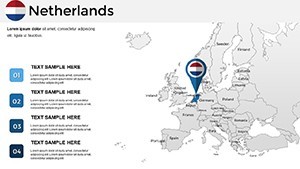
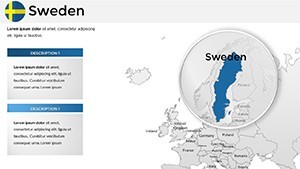
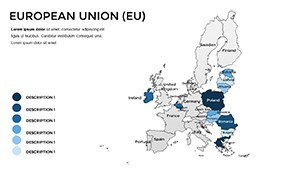
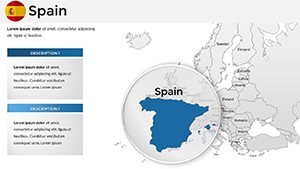
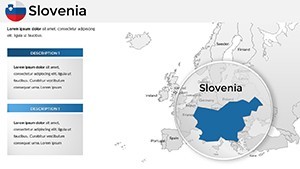
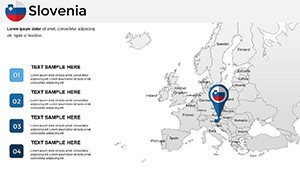
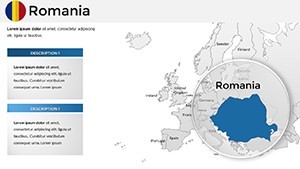
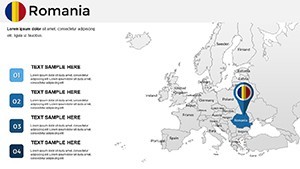
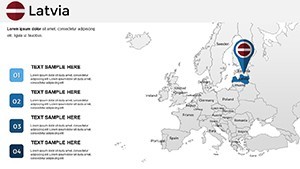
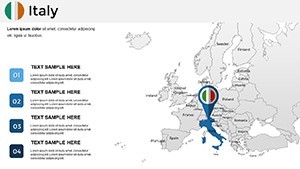
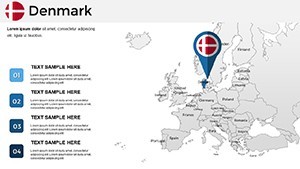
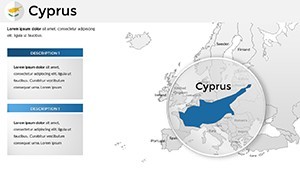
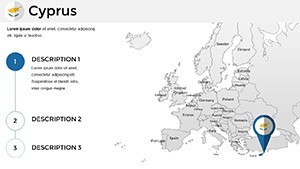
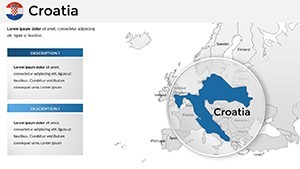
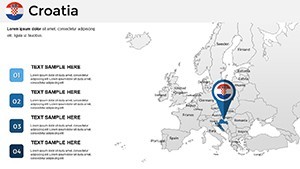
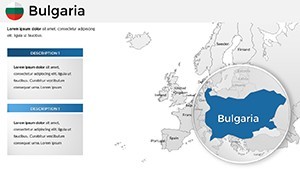
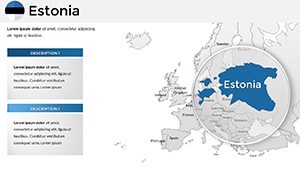
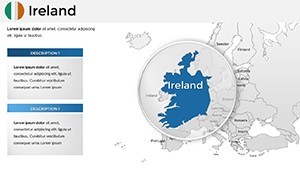
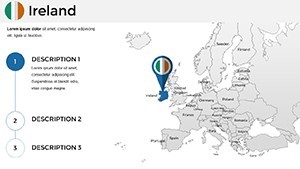
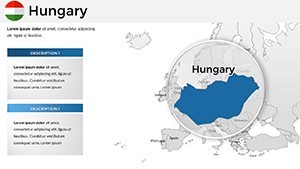
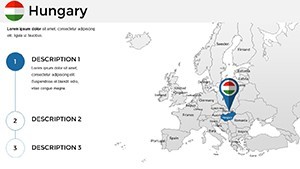
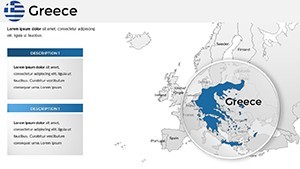
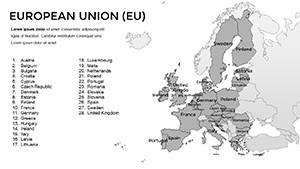
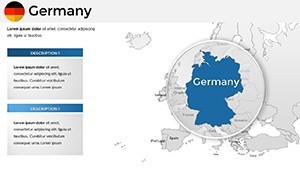
Envision transforming complex EU data into a symphony of visuals that guide decisions and spark discussions. Our European Union Countries Keynote Maps Template delivers just that, with 61 meticulously designed slides offering unmatched detail on borders, capitals, and major cities. Tailored for researchers dissecting trade policies, educators illuminating historical unions, or executives navigating market expansions post-Brexit, this collection turns abstract concepts into tangible narratives. From political overviews to economic heatmaps, these maps are your canvas for storytelling in a interconnected Europe.
Crafted with versatility at its core, the template spans political, physical, and economic views, all editable in Keynote for swift adaptations. Change colors to highlight GDP disparities, add annotations for policy impacts, or layer data on migration flows - it's all possible without design expertise. Compatible exclusively with Keynote (.key format), it ensures smooth performance on Apple devices, ideal for seamless team collaborations or solo refinements.
The Power of Detailed EU Mapping for Strategic Minds
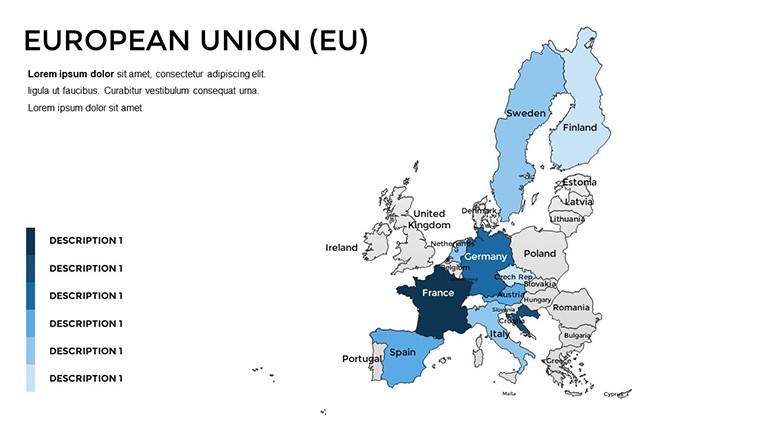
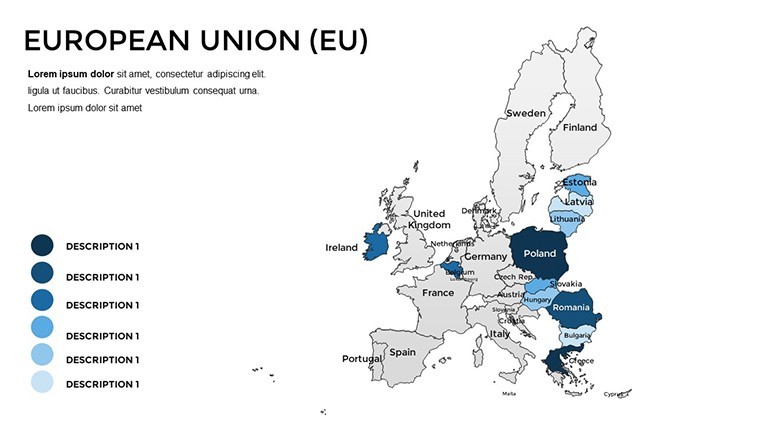
What sets this template apart is its foundation in accurate, up-to-date geographic data, aligning with standards from bodies like Eurostat for trustworthy visuals. Consider a policy analyst using these maps to visualize the Schengen Area's free movement, referencing real cases like the EU's response to the 2022 energy crisis. The variety of map types allows for nuanced presentations, far beyond generic outlines.
Essential Features for Dynamic Presentations
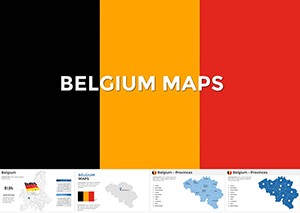
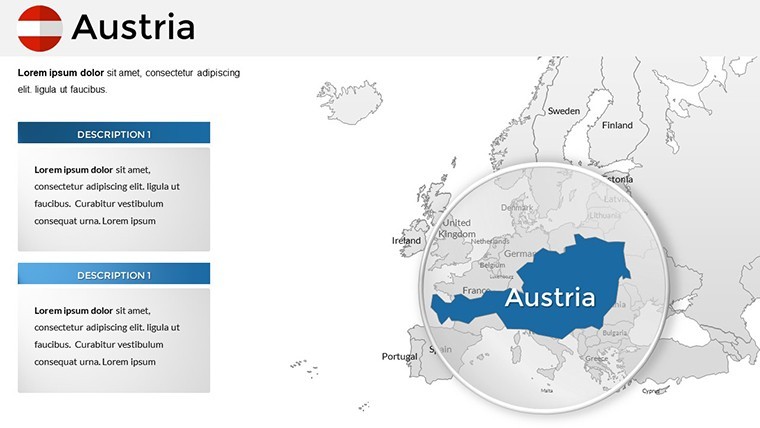
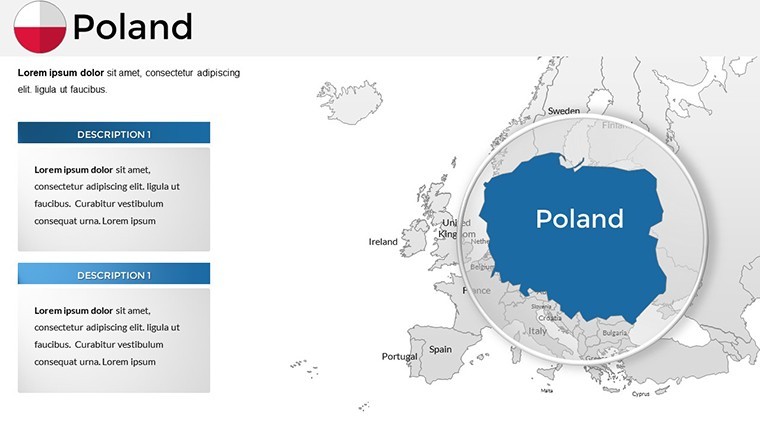
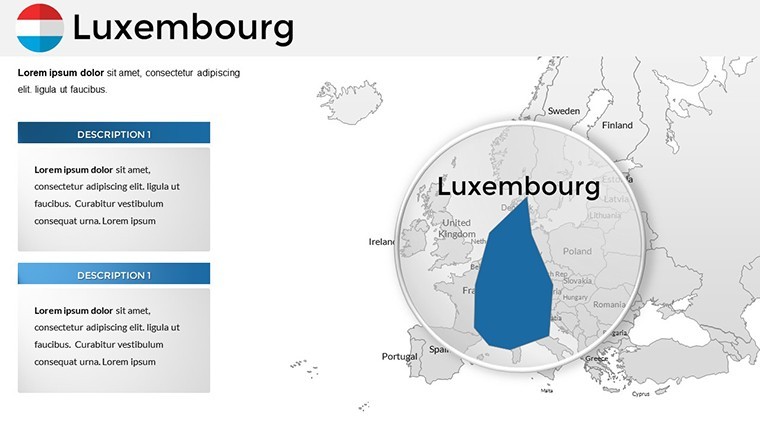
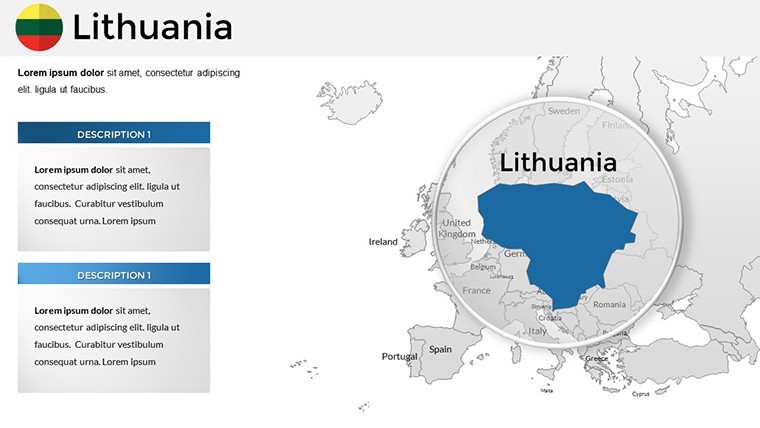
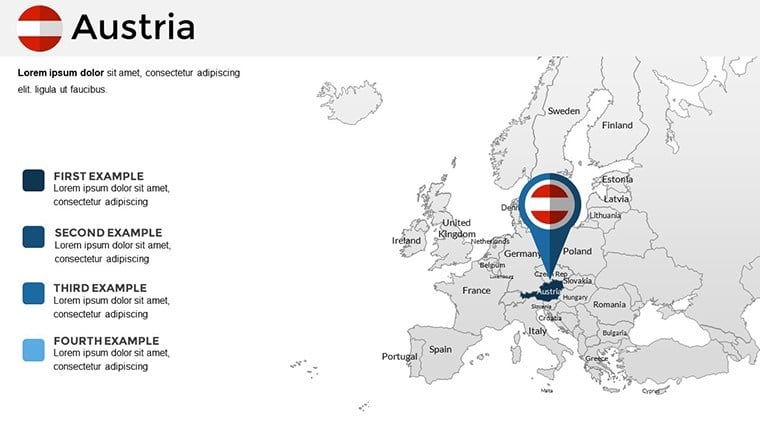
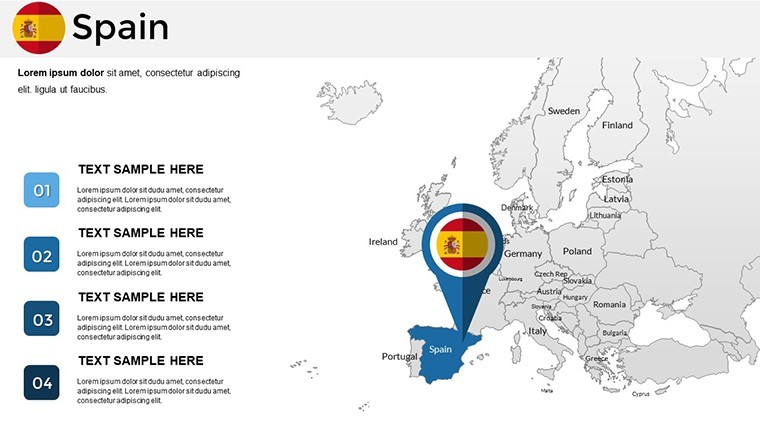
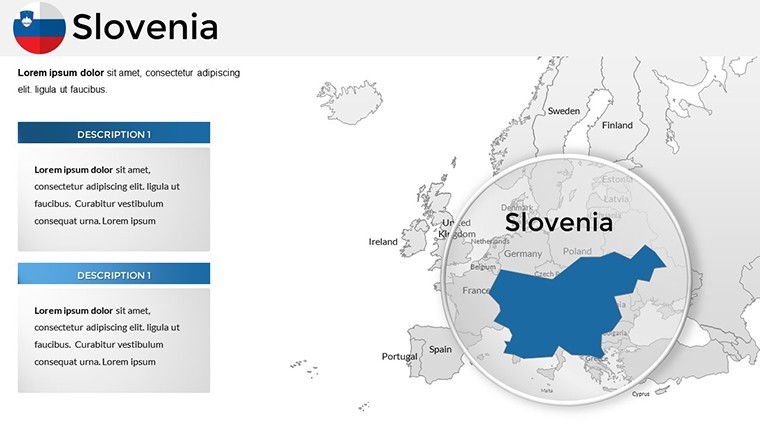
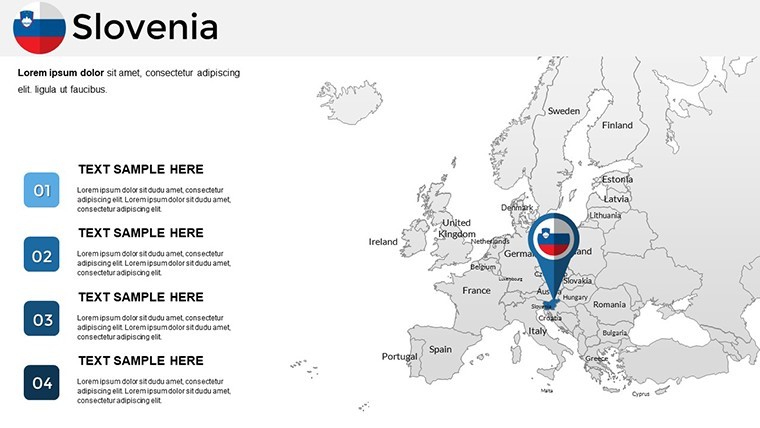
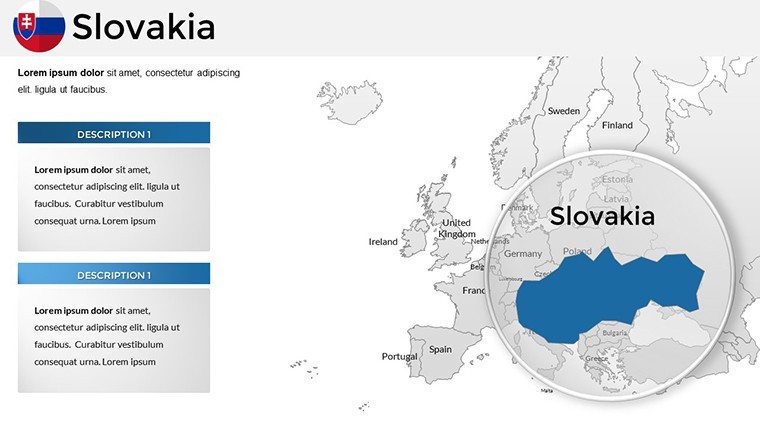
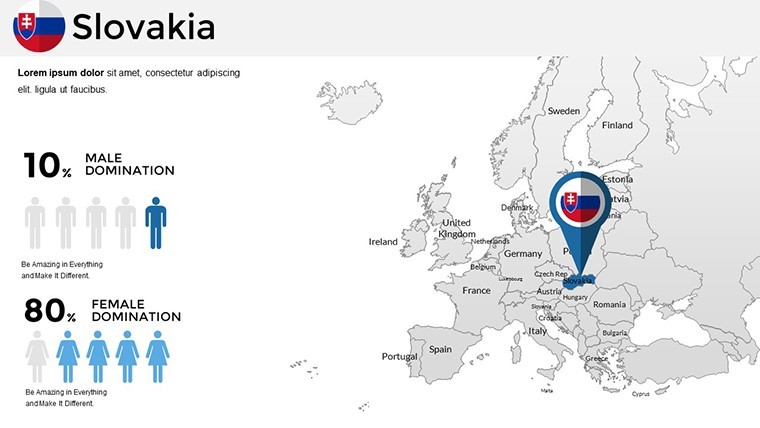
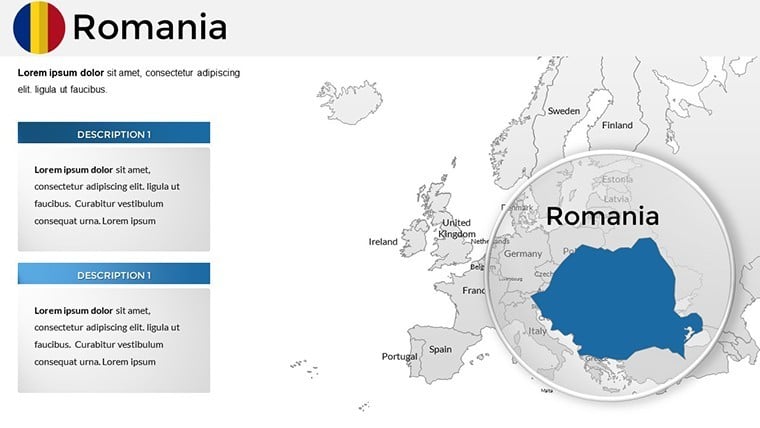
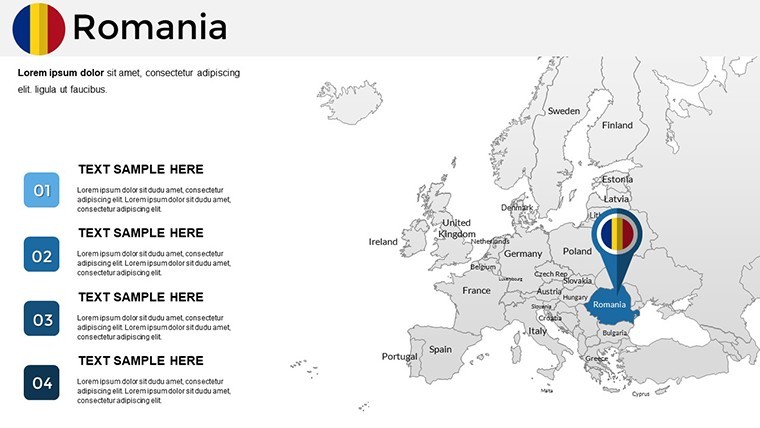
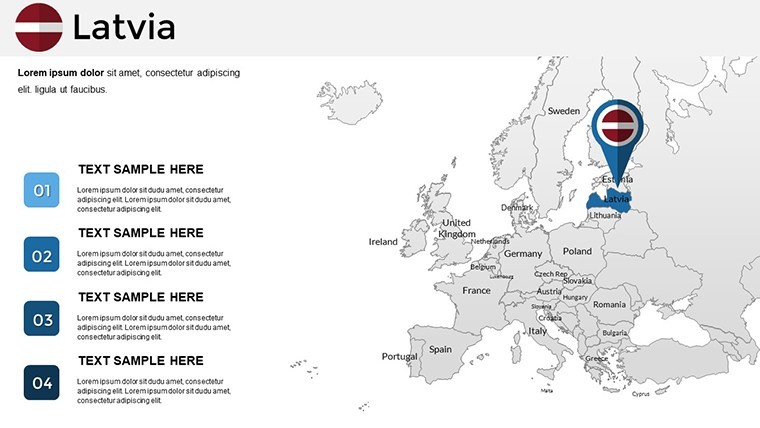
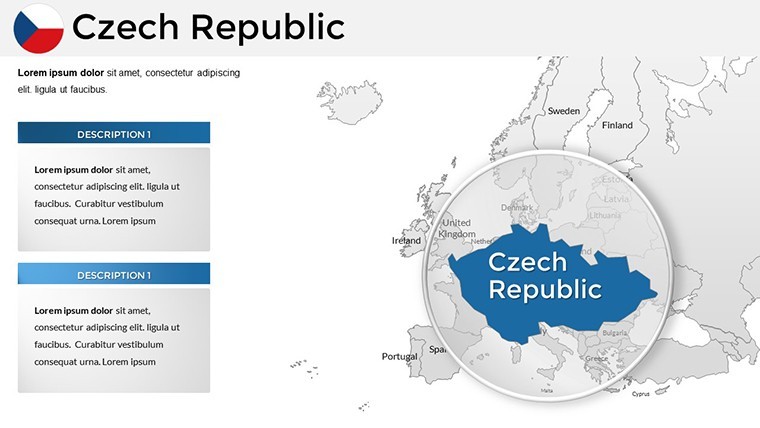
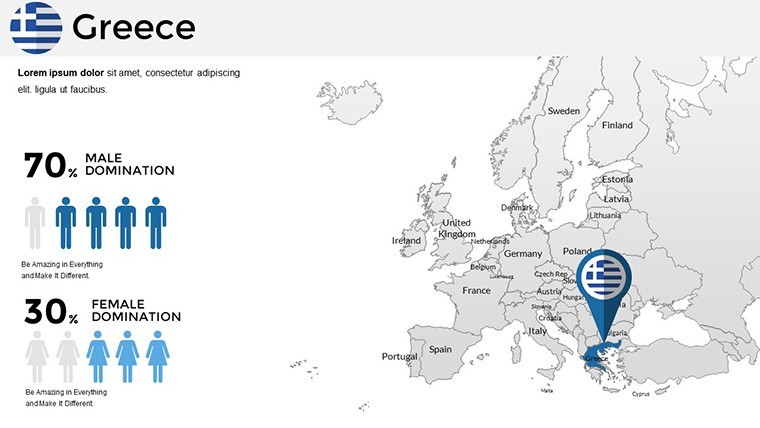
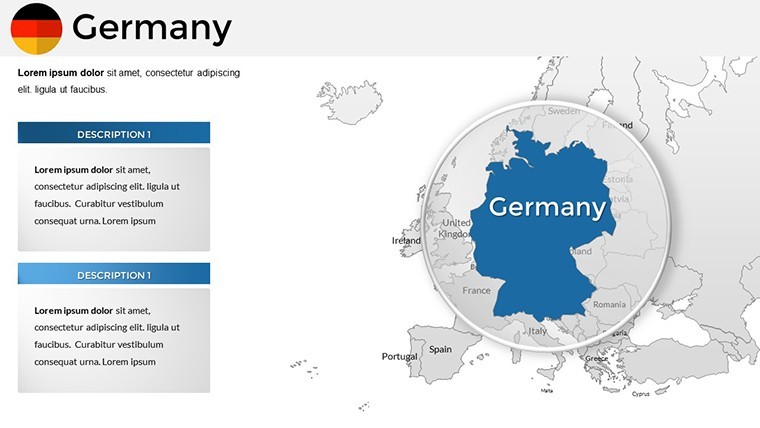
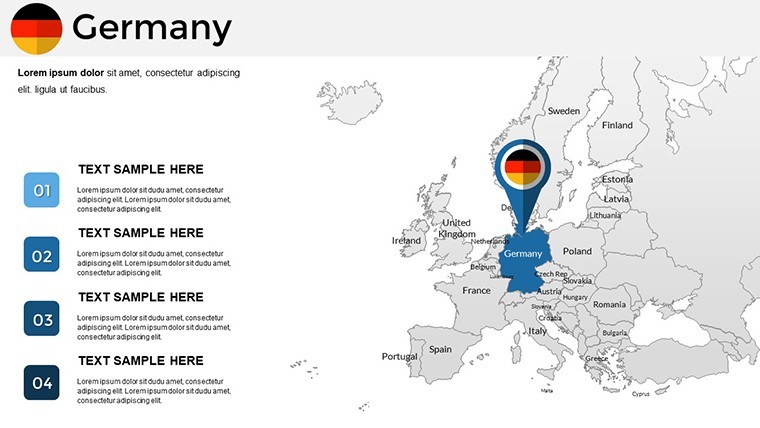
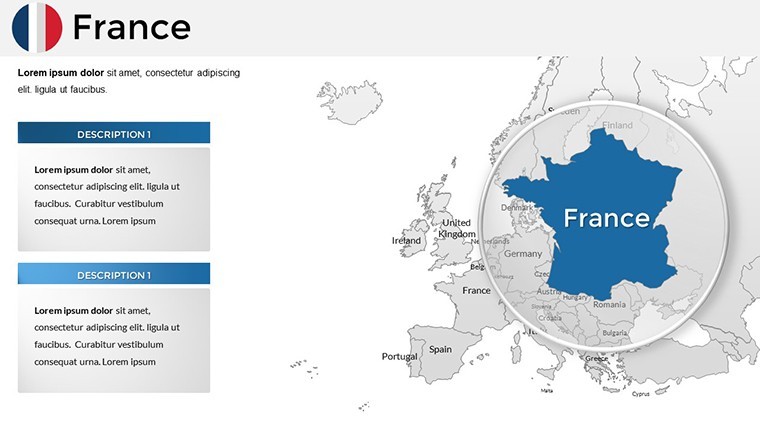
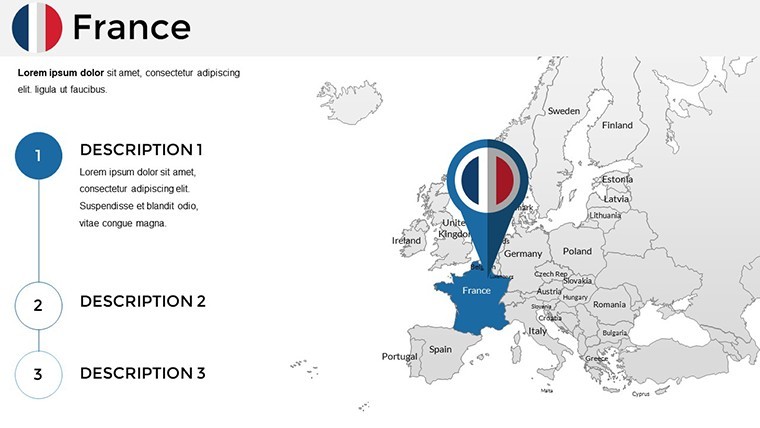
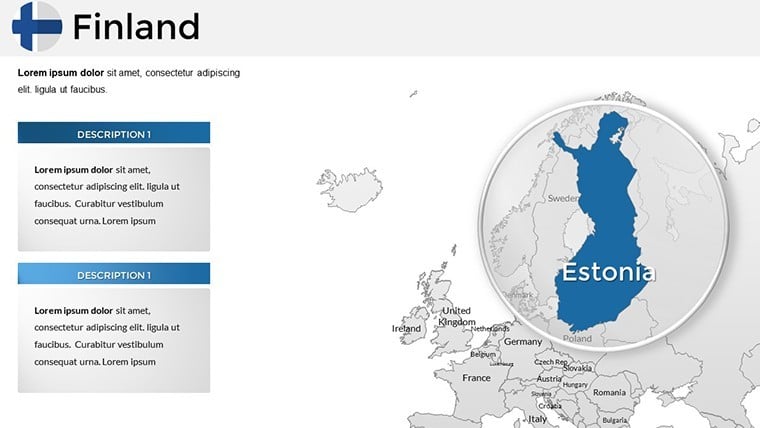
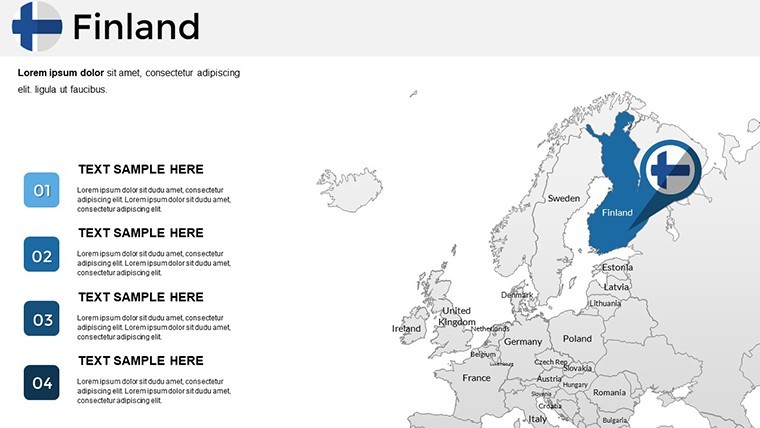
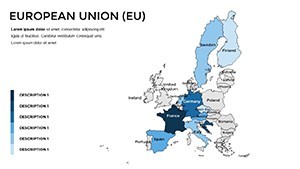
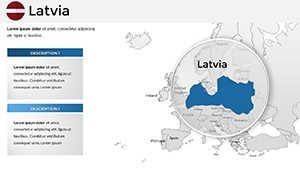
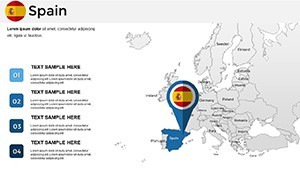
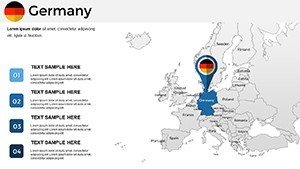
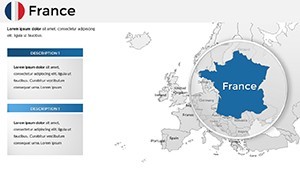
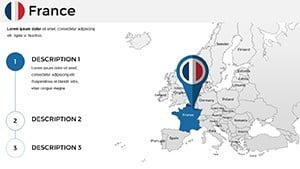
- Diverse Map Variations: Political boundaries, physical terrains, and economic zones for multifaceted analyses, like comparing urban densities in Berlin versus rural Spain.
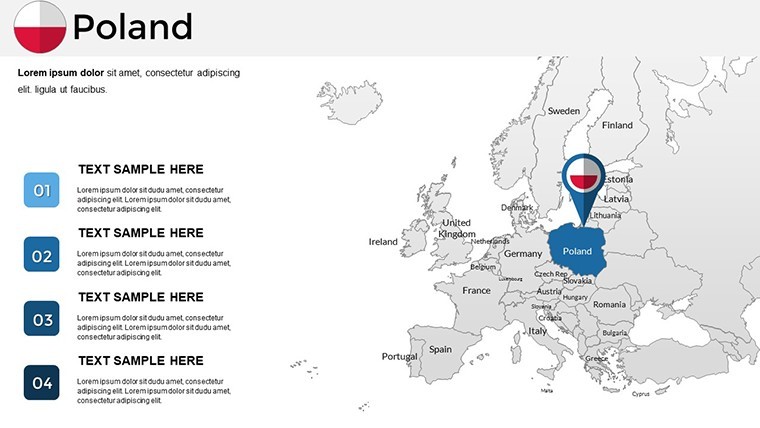
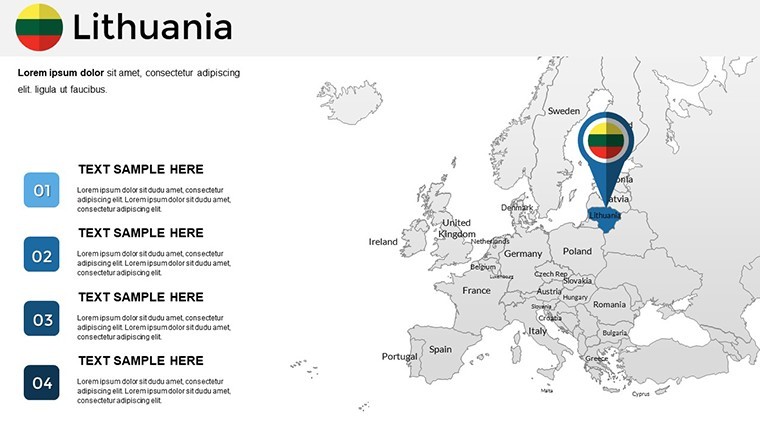
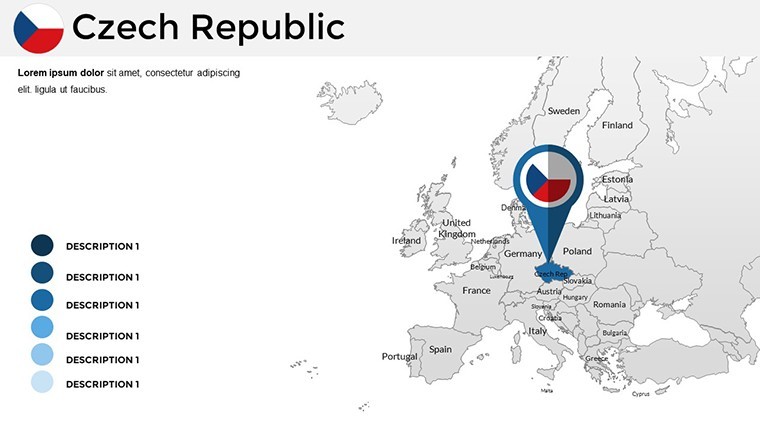
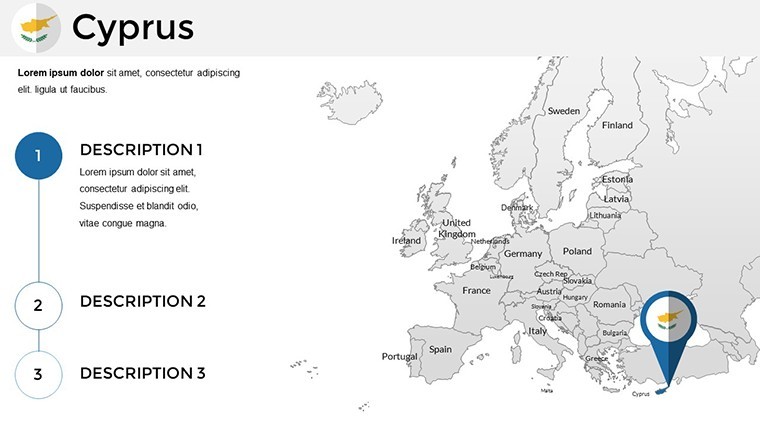
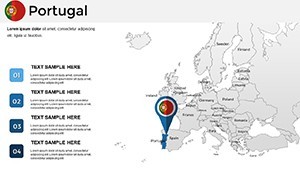
- Annotation Flexibility: Add labels, notes, or icons to emphasize points, such as EU funding distributions in Eastern member states.
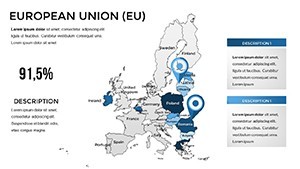
- Color Customization: Tailor palettes to themes, using blues for environmental policies or reds for fiscal alerts.
- High-Clarity Graphics: Vector-based for sharp scaling, perfect for large conference screens or detailed reports.
- Keynote-Optimized: Native .key files ensure fluid animations and transitions without compatibility hiccups.
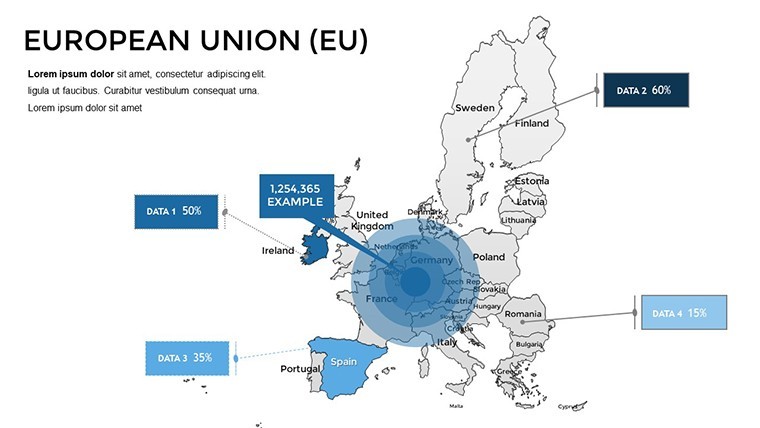
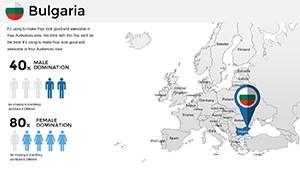
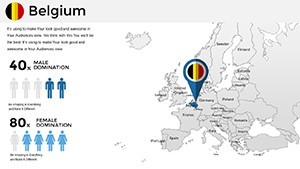
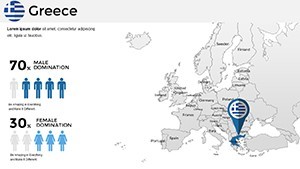
- Integrated Data Tools: Easily embed charts showing metrics like unemployment rates across the Eurozone.
These elements address the challenge of presenting multilayered EU information, making your slides not just informative but intuitively navigable.
Targeted Use Cases: Bridging Theory and Practice
In practice, this template excels in scenarios demanding precision. A diplomat might map trade routes affected by the EU-Green Deal, drawing on examples from the 2023 sustainability reports. Or a university lecturer could animate historical expansions from the original six nations to today's 27, engaging students with interactive elements.
- Market Research Briefings: Overlay consumer trends on economic maps to identify growth pockets in Scandinavia versus the Mediterranean.
- Academic Lectures: Illustrate geopolitical shifts, such as the impact of enlargement on Balkan integrations.
- Government Policy Sessions: Visualize budget allocations, highlighting disparities in cohesion funds for underdeveloped regions.
- Corporate Strategy Meetings: Chart supply chain vulnerabilities, informed by post-pandemic recovery data from the European Commission.
Unlike standard Keynote shapes, this offers pre-themed layers and annotations, slashing prep time while boosting visual sophistication. It's akin to a specialized toolkit for EU-focused communicators.
Pro Tips for EU Map Mastery
Begin by selecting map types that align with your objective - political for governance talks, economic for financial reviews. Use Keynote's magic move for smooth transitions between views, revealing data layers progressively. Incorporate hyperlinks to sources like the EU Parliament website for credibility. For collaborative edits, leverage iCloud sharing, and always test animations to avoid glitches in high-stakes settings.
Drawing from authoritative practices, such as those in EU statistical reporting, ensures your maps convey expertise, fostering trust in your insights.
Chart Your Course Through Europe's Complexities
Ultimately, these Keynote maps empower you to navigate the EU's intricate landscape with confidence. From forecasting unity challenges to celebrating shared achievements, they provide the visual backbone for compelling arguments.
Seize the opportunity to refine your EU narratives - download and customize this template now for presentations that truly connect.
Frequently Asked Questions (FAQ)
What types of EU maps are included?
The template features political, physical, and economic maps, all with detailed borders, capitals, and cities.
Can I edit annotations and labels?
Yes, all elements are fully customizable, including adding or modifying annotations directly in Keynote.
Is this compatible with other software?
It's optimized for Keynote (.key), but can be exported to PDF for broader use.
How accurate are the maps?
Based on current EU geographic standards, ensuring reliability for professional applications.
Can I integrate data visualizations?
Absolutely, embed charts and graphs seamlessly to enhance your maps with quantitative insights.
What's the best way to use for team projects?
Use iCloud for real-time collaboration, making edits efficient across devices.