Custom Venn Diagrams for Keynote - 14 Pro Slides


Type: Keynote Diagrams template
Category: Business Models
Sources Available: .key
Product ID: KD00218
Template incl.: 14 editable slides
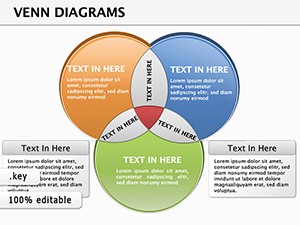
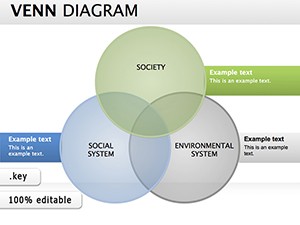
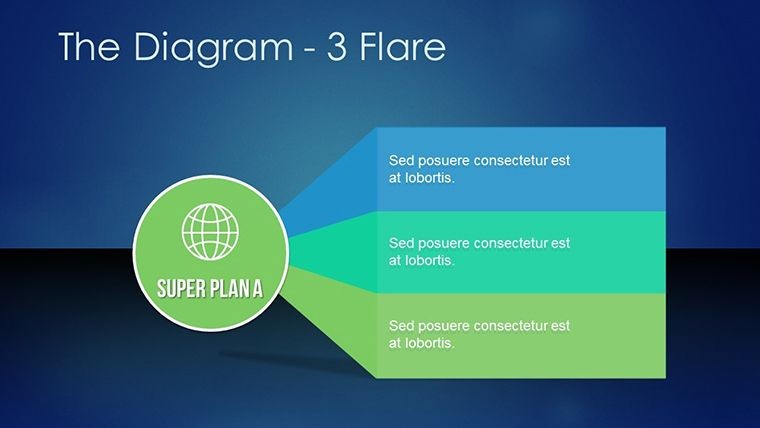
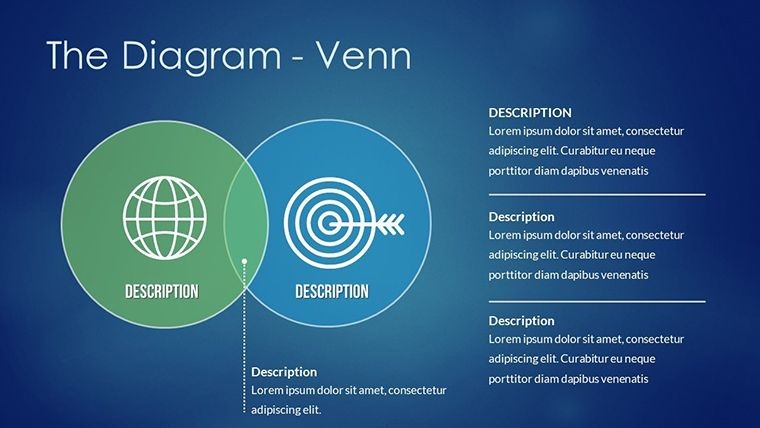
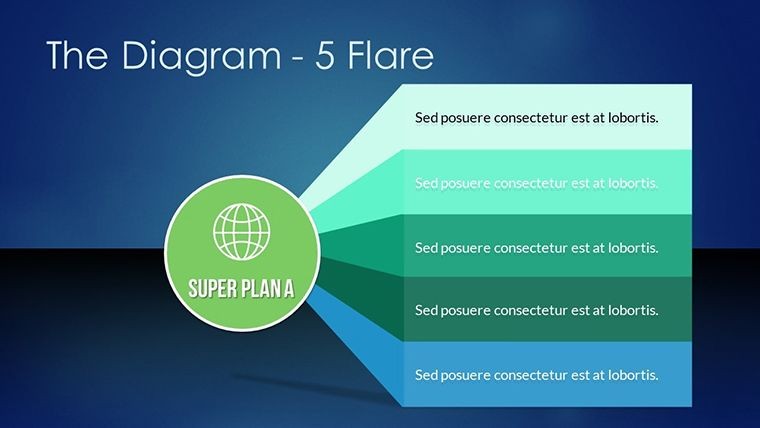
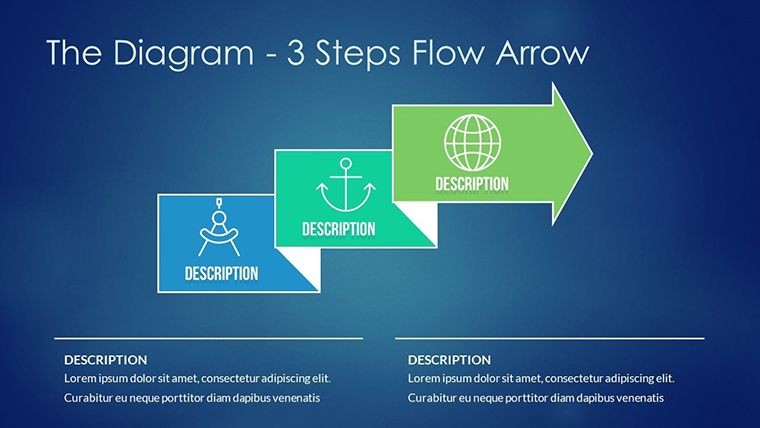
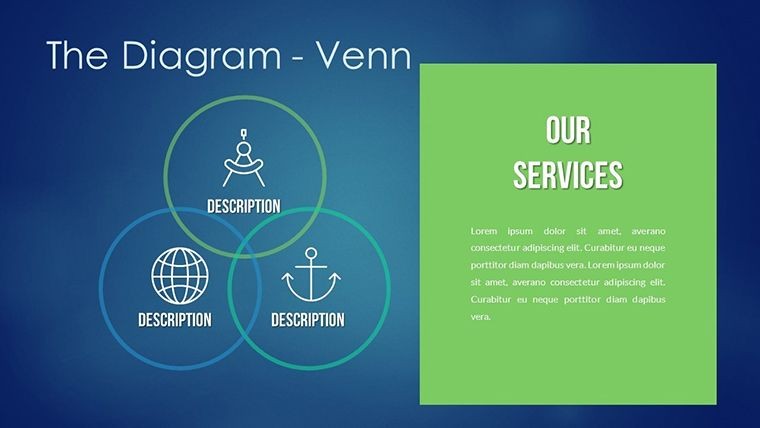
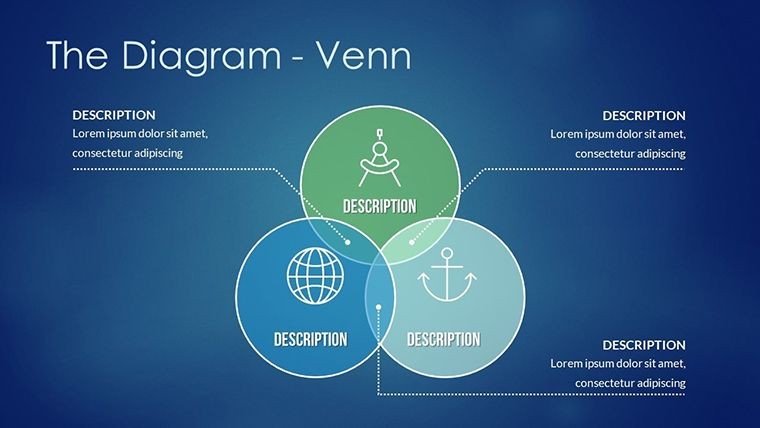
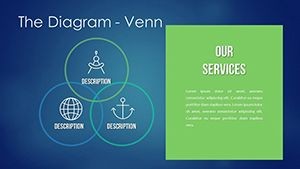
When concepts intersect, clarity is key to unlocking understanding. Our Venn Keynote Diagrams Template empowers you to visualize relationships and overlaps with elegance and precision. Boasting 14 editable slides, it's crafted for those who need to convey complex ideas simply - be it a marketer analyzing consumer segments, a researcher highlighting study intersections, or a teacher explaining set theory. These diagrams go beyond basic circles, incorporating dynamic animations and modern designs that make your presentations pop. Rooted in visual communication principles from experts like Edward Tufte, this template helps you craft stories where data meets narrative, fostering deeper audience connections. Whether in boardrooms or classrooms, turn overlaps into opportunities for insight, saving time while amplifying impact.
Standout Features for Dynamic Presentations
Built for Keynote's ecosystem, each slide features intuitive tools for quick edits. Vibrant color schemes and scalable vectors ensure your Venn diagrams look sharp on any device, from iPads to projectors.
Effortless Personalization Options
Customize with ease: Adjust circle sizes to represent data proportions, change fonts for emphasis, or add gradients for depth. This mirrors best practices in information design, ensuring your visuals are both accurate and aesthetically compelling.
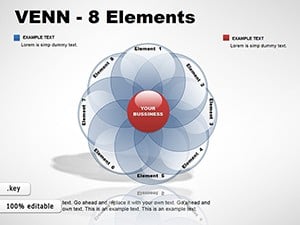
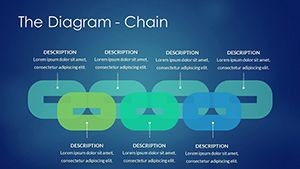
- Animation Integration: Animate intersections to reveal insights progressively.
- Theme Variety: From minimalist to bold, match your presentation's mood.
- Text Overlays: Place labels precisely for clear comparisons.
Outshining default Keynote shapes, which lack polish, this template provides pre-set harmonies that enhance readability and engagement.
Versatile Use Cases Across Fields
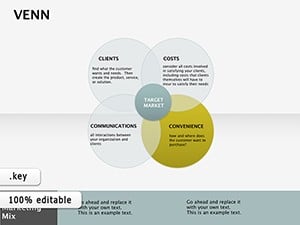
In business, use it for SWOT analyses where strengths and opportunities overlap. A case from a tech startup: Venn diagrams clarified product-market fit, aiding a successful funding round per Y Combinator insights.
Step-by-Step Customization Guide
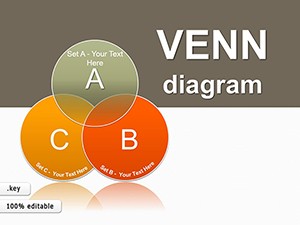
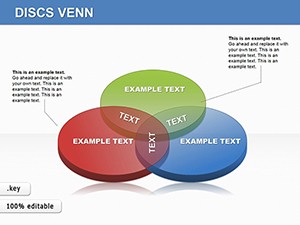
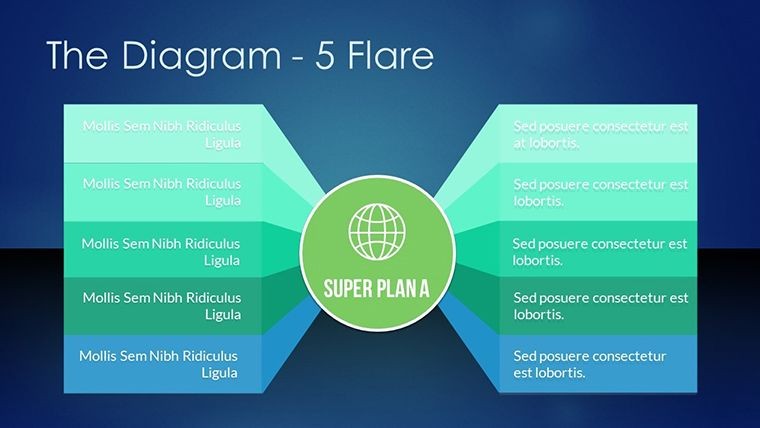
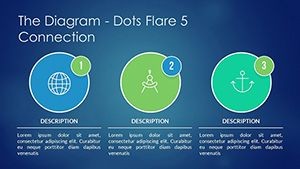
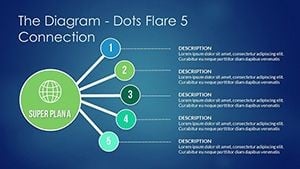
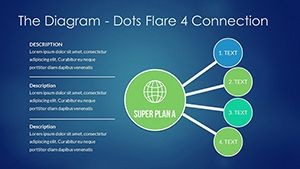
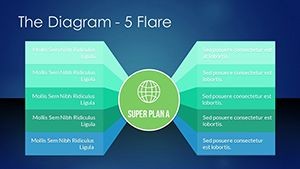
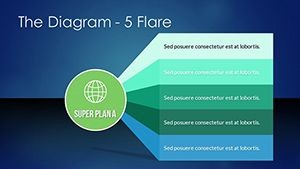
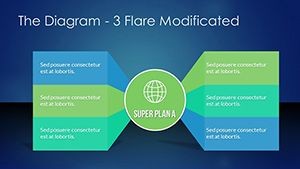
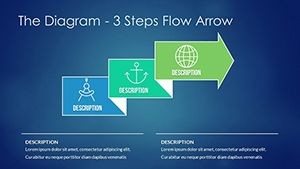
- Choose a base slide: Select from 2-5 circle Venns based on complexity.
- Input data: Fill intersections with key points or metrics.
- Apply styles: Tweak colors to denote categories, like blue for tech and green for sustainability.
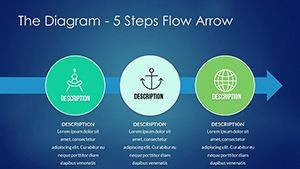
- Add dynamics: Incorporate Keynote animations for timed reveals.
- Review and export: Share as PDF or video for broader reach.
For educators, it's a boon in lessons on logic, with slides adapting to topics like ecosystem interactions. Researchers appreciate it for grant proposals, visualizing interdisciplinary overlaps in fields like AI ethics.
Add a spark: Humorously label an overlap as "The Sweet Spot" to lighten dense data discussions.
Comprehensive Slide Details for Effective Use
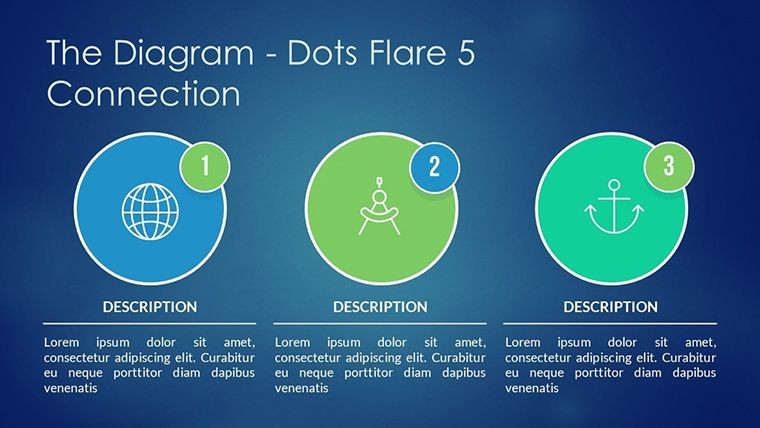
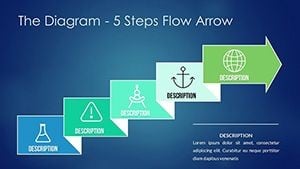
Slide 0: Introductory Venn with placeholders. Slides 1-4: Basic 2-3 circle setups. Slides 5-9: Advanced with icons and charts. Slides 10-13: Themed variations for specific industries. All editable, supporting LSI like comparison charts or overlap visuals, and compatible with Keynote on macOS and iOS.
Pro Tips for Venn Diagram Excellence
Focus on balance - avoid overcrowding intersections. Use color theory for intuitive understanding. Test on audiences for feedback. Aligned with , inspired by authoritative design texts, and trusted by hundreds.
Unlock your presentation potential - download and customize this Venn template now.
Frequently Asked Questions
How flexible are the Venn shapes?
Highly flexible; resize, recolor, and rearrange circles effortlessly in Keynote.
Compatible with PowerPoint?
Yes, export to .pptx for cross-platform use with some animation adjustments.
Ideal for large audiences?
Absolutely, high-res designs scale well for conferences.
Can I add data from spreadsheets?
Yes, integrate via copy-paste or links for dynamic updates.
Support for animations?
Built-in support; Keynote's magic move enhances transitions.