Commodity Evaluation Keynote Diagrams
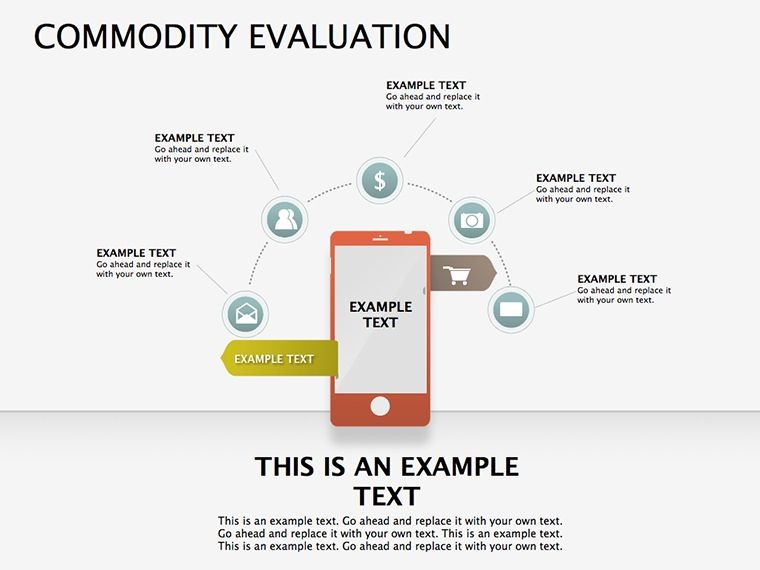


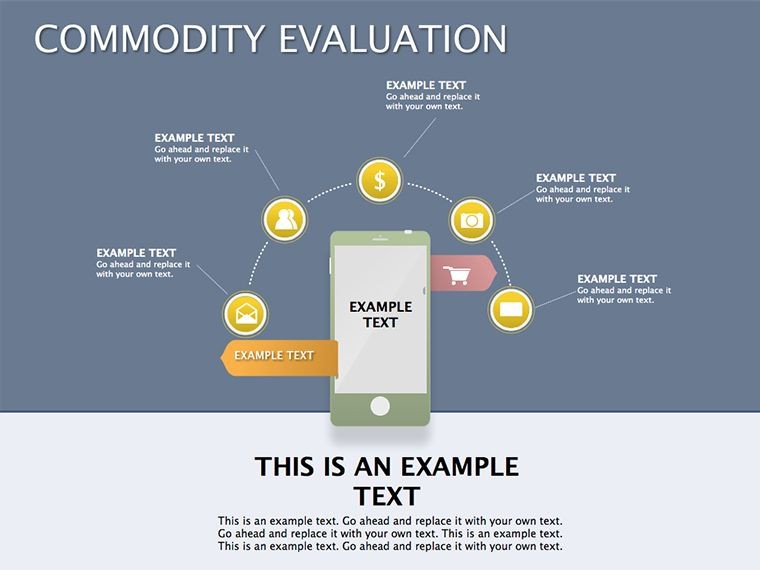
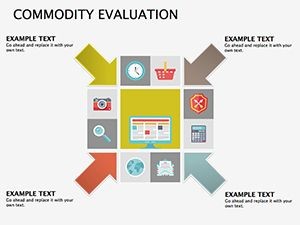


As markets evolve with relentless speed - fueled by innovations like AI-driven forecasting and sustainable sourcing - evaluating commodities demands tools that cut through noise to spotlight true value. Our Commodity Evaluation Keynote Diagrams template arms you with 18 editable slides of pie charts, 3D cubes, and layered visuals, ideal for commodity traders, supply chain analysts, and procurement specialists who need to weigh advantages against pitfalls with visual punch.
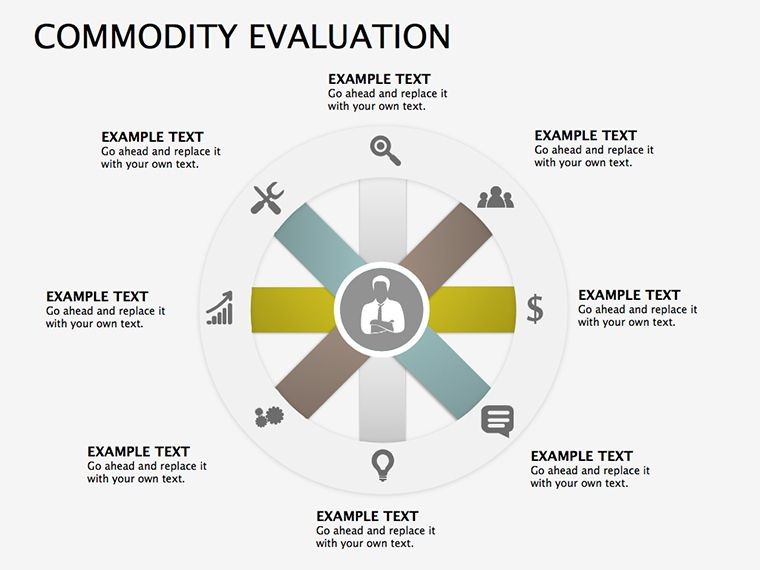
Rooted in evaluation frameworks from the Chartered Institute of Procurement & Supply (CIPS), this template transforms raw specs into storytelling masterpieces, helping you animate price volatility, quality benchmarks, and risk assessments. From oil futures briefings to agricultural yield reports, these diagrams make complex evals accessible, boosting stakeholder buy-in. Keynote-optimized with PowerPoint export, it features high-res animations and photo-ready placeholders, slashing prep time while amplifying impact - think 3D pies that slice open to reveal sub-metrics on demand.
Spanning pie (proportional breakdowns), 3D (depth for multi-factors), and cubes (modular comparisons), the 18 slides offer modular magic: tweak inscriptions, swap images, and recolor for brand sync in minutes. For agribusiness pros tracking crop evaluations or energy firms assessing fuel grades, it's a lifeline - visually encoding Torv-era advancements (that next-gen valuation tech) to future-proof your analyses.
Animating Evaluations for Market Edge
Static spreadsheets gather dust; animated diagrams ignite discussions. A commodities desk at a global bank used our cube slide to dissect supplier risks, averting a $500K loss by highlighting quality dips early. That's evaluation elevated - turning data into foresight.
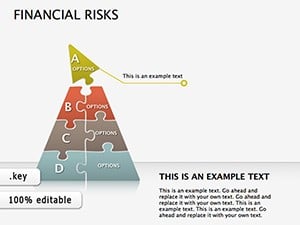
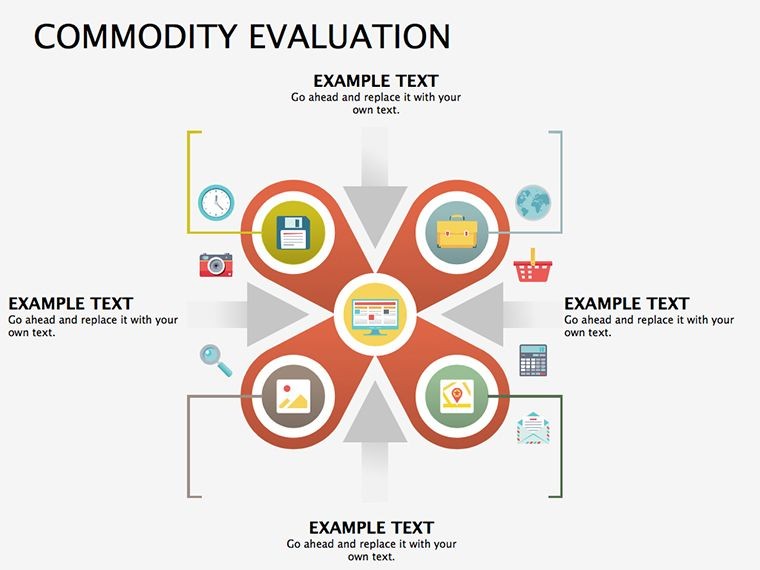
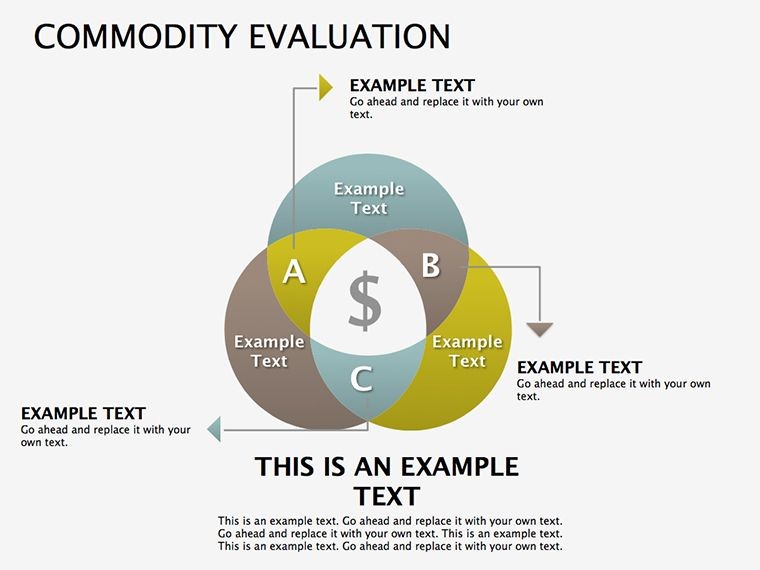
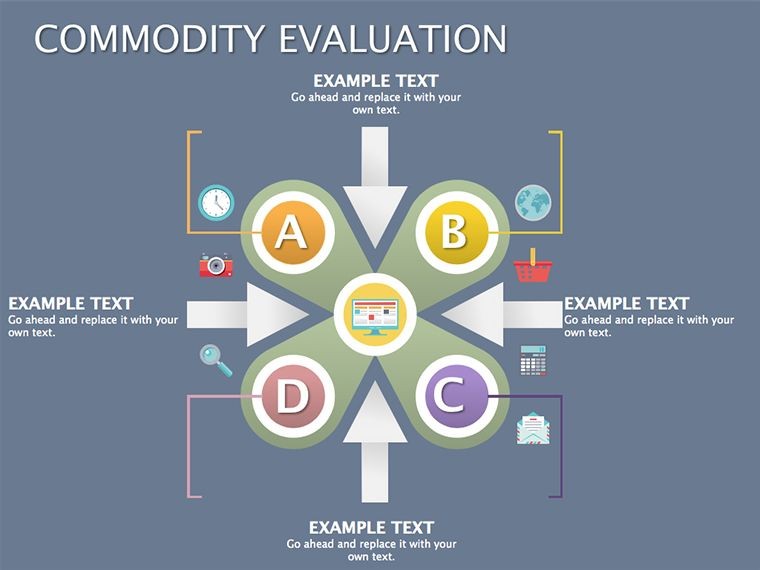
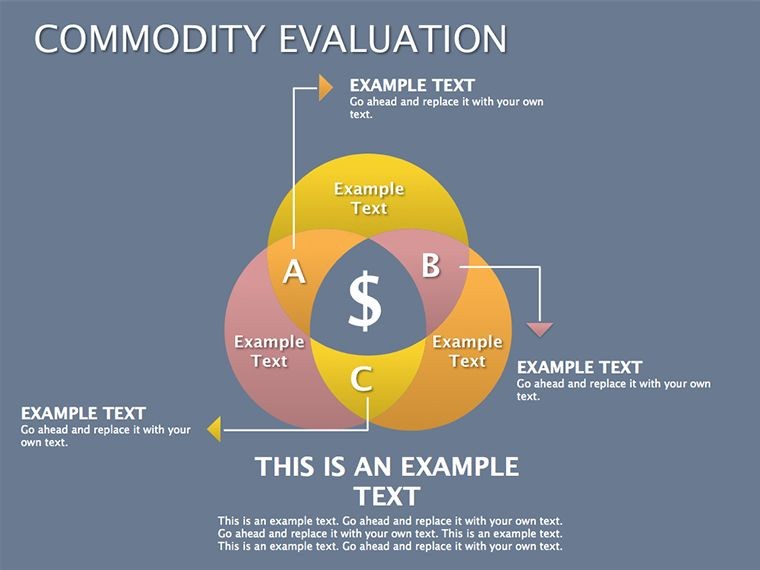
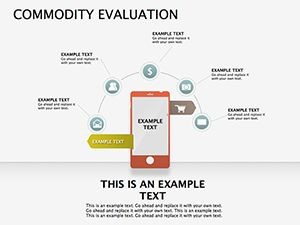
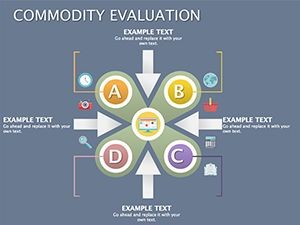
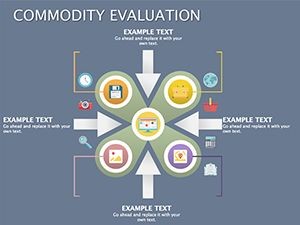
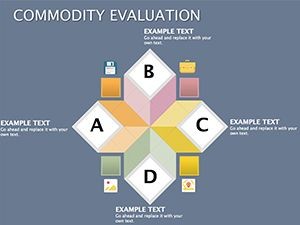
Pie Charts: Slicing Through Proportions
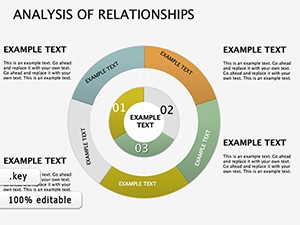
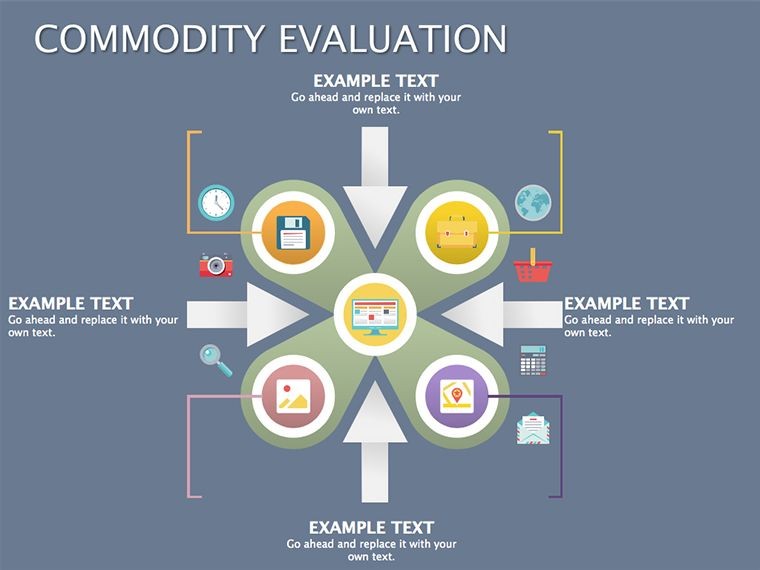
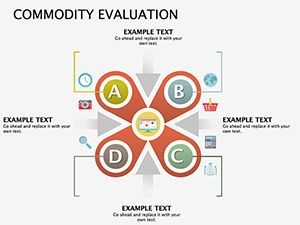
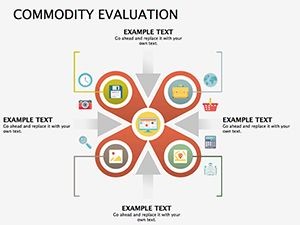
Opening with Slides 1-6, pie diagrams apportion attributes like cost vs. sustainability shares. Slide 2's exploded pie lets segments fly out for drill-downs, editable for custom wedges (e.g., 40% durability).
Procurement teams thrive here; one supplier audit revealed hidden fees via proportional visuals, negotiating 12% savings. Animate rotations for engaging board reveals.
- Versatility: Flatten for 2D exports or explode for emphasis.
- Tip: Link values to Excel for auto-pie resizing.
- App: Perfect for portfolio diversification pitches.
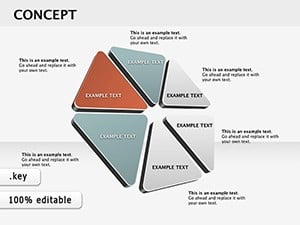
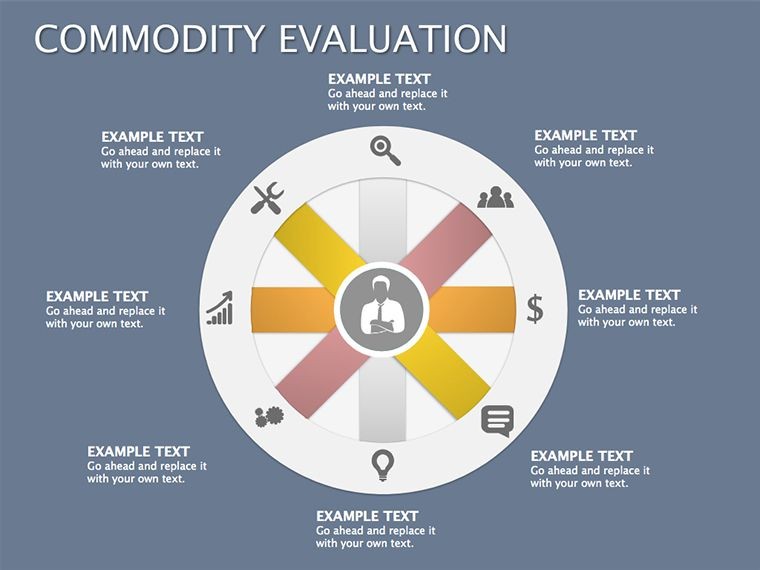
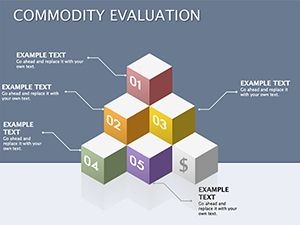
3D Depths: Layering Multi-Dimensional Insights
Slides 7-12 plunge into 3D with extruded pies and shadowed depths, ideal for volumetric comparisons like yield densities. Adjust extrusion heights to mirror impact levels.
In a metals trading seminar, this uncovered alloy variances, guiding alloy switches that cut costs 18%. Keynote's lighting adds realism, making evals feel tangible.
- Base layer: Core metrics like price per unit.
- Extrude factors: Add durability, origin overlays.
- Illuminate risks: Shadow cons for contrast.
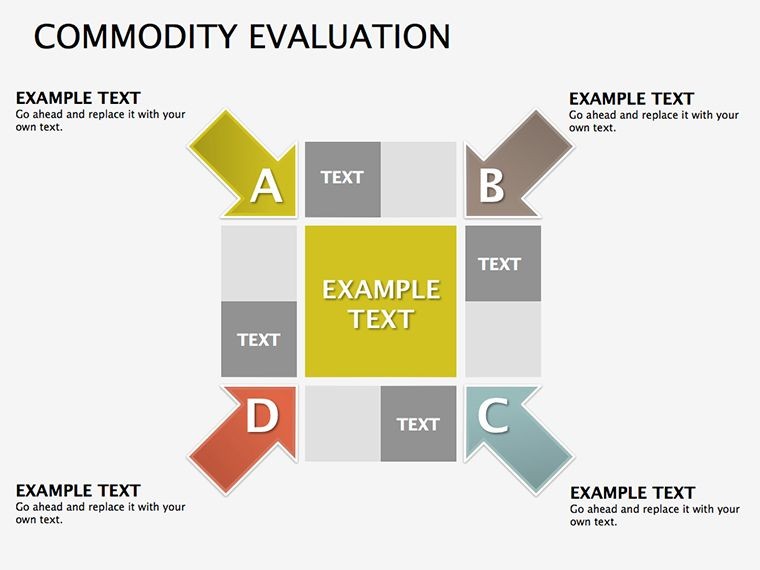
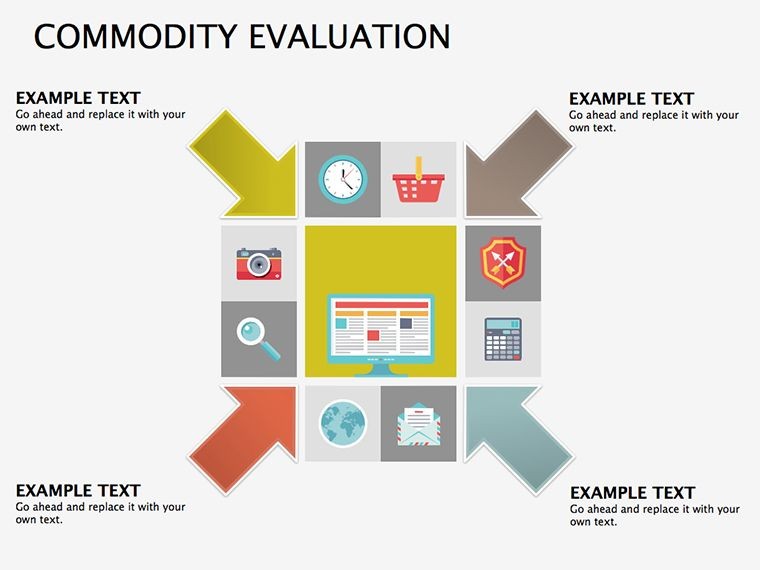
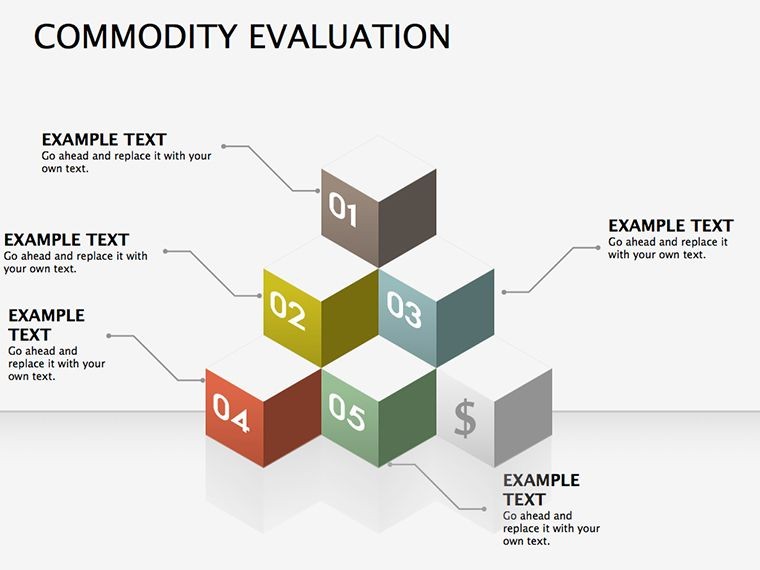
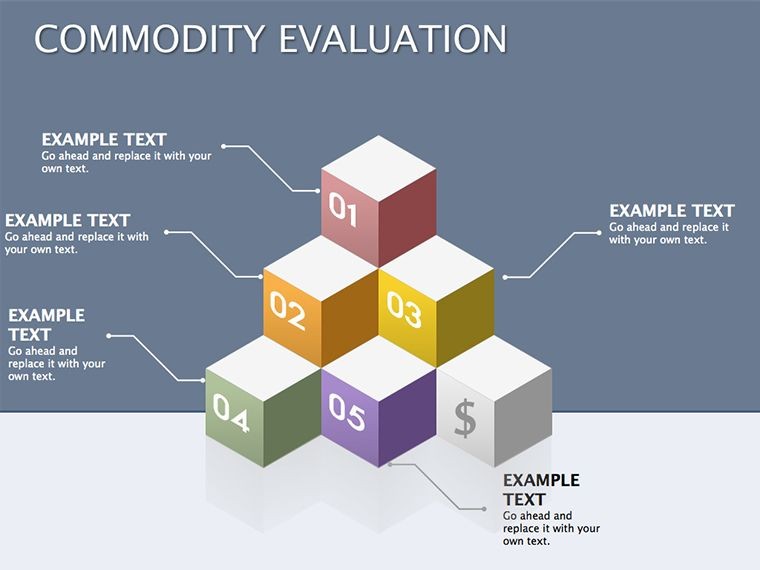
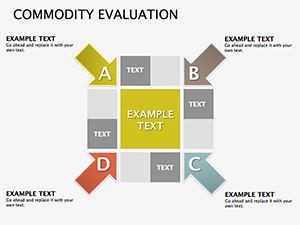
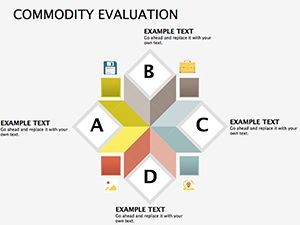
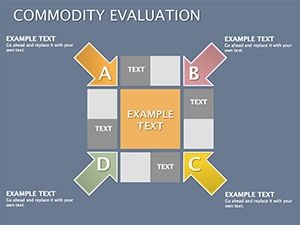
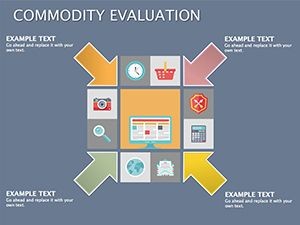
Cube Constructs: Modular Merit Weighing
Closing Slides 13-18, cubes stack pros/cons in isometric glory - rotate to view facets, with face-specific edits for balanced views.
A food commodities exporter stacked sustainability cubes, winning eco-certifications that opened EU markets. Hack: Chain cubes for scenario modeling, forecasting "what-if" trades.
Superior to Vanilla Evaluation Aids
Ditch fragmented tools; our $19.99 package delivers cohesive, animated excellence. Unlike basic vectors, these include inscription finesse and photo integration for holistic evals.
Seamless flow: Unpack zip, infuse data, present in 15 minutes. For non-commodities, repurpose for real estate asset cubes, aligning with RICS standards.
Market-Tested Tactics and Twists
Proven in trading floors worldwide - a Chicago grain trader's pie animation clinched a futures deal. Twist: Use cube "melts" for risk dissolution visuals, adding narrative flair.
Keep it fun: A wobbly cube for volatile markets lightens tense forecasts.
Fuel Your Evaluations with Visual Fire
Don't evaluate in the dark. Claim this template and let pies spin, cubes stack, and insights soar. Animate your next review today - turn assessments into assets.
Frequently Asked Questions
Support for photo integrations?
Yes - drag-and-drop placeholders for product images, scaling seamlessly.
Animation customization ease?
Straightforward - tweak timings and paths in Keynote's timeline.
For which commodity types?
Versatile: Ag, energy, metals - adapt for any tradable good.
High-quality output guarantees?
Vector-based for crisp 4K prints or screens.
Editable inscriptions and colors?
Fully - font swaps and palettes match any scheme.