Analytical Pyramid Keynote Template


As a consultant who crafts high-stakes pitches for Fortune 500 clients every week, I've learned that the difference between a forgettable slide deck and one that drives decisions lies in how you layer information. That's where the Analytical Pyramid Keynote Template comes in - a 17-slide powerhouse designed specifically for Keynote users who need to dissect complex topics into digestible, visual hierarchies. This isn't just another chart pack; it's a framework that mirrors how top executives think: starting broad at the base and narrowing to actionable insights at the peak.
Built for professionals juggling strategy sessions, financial breakdowns, and team alignments, this template leverages pyramid structures to make abstract concepts tangible. Compatible with Keynote 2016 and later versions on Mac, iPad, or iCloud, it ensures seamless editing no matter where your workflow takes you. I've used it to transform a client's chaotic market entry plan into a crystal-clear roadmap, earning nods from the boardroom before the first question. If you're tired of flat lists that bury your key points, this template invites you to build upward - literally - revealing depth without overwhelming your audience.
What sets this apart is its focus on progressive disclosure: each pyramid slide encourages you to peel back layers methodically, fostering that "aha" moment when connections click. Whether you're a strategy lead mapping competitive landscapes or an educator simplifying theoretical frameworks, these diagrams turn data dumps into strategic narratives. And with one-time licensing for lifetime use across your projects, it's an investment that pays dividends in every presentation you deliver.
Exploring the Core Features of This Pyramid Diagram Collection
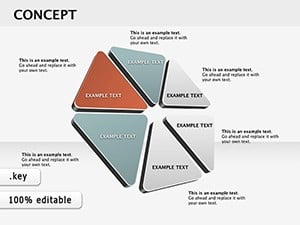
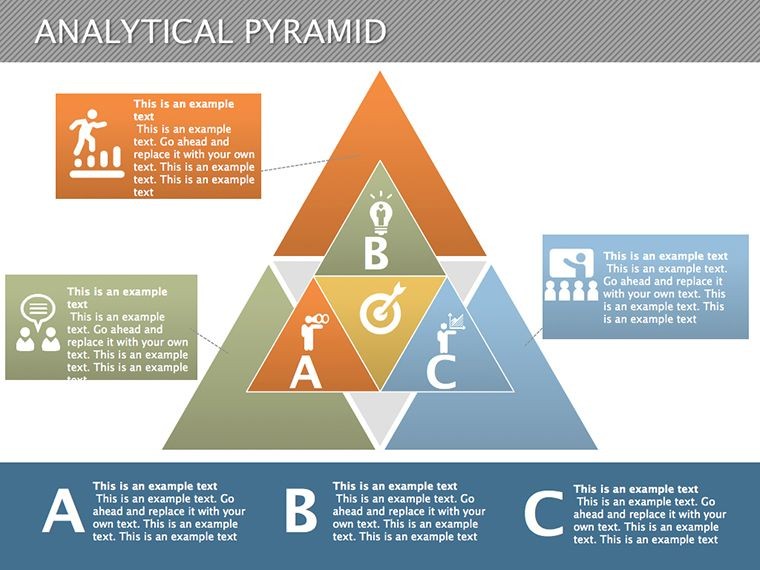
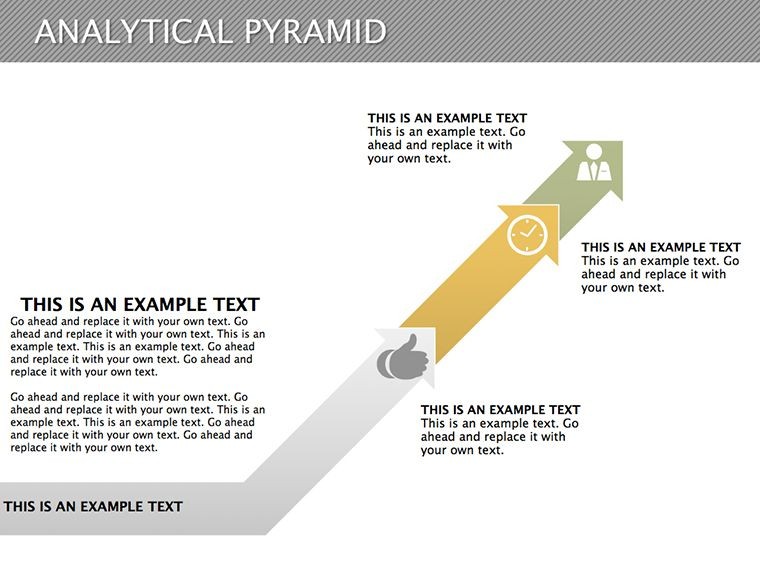
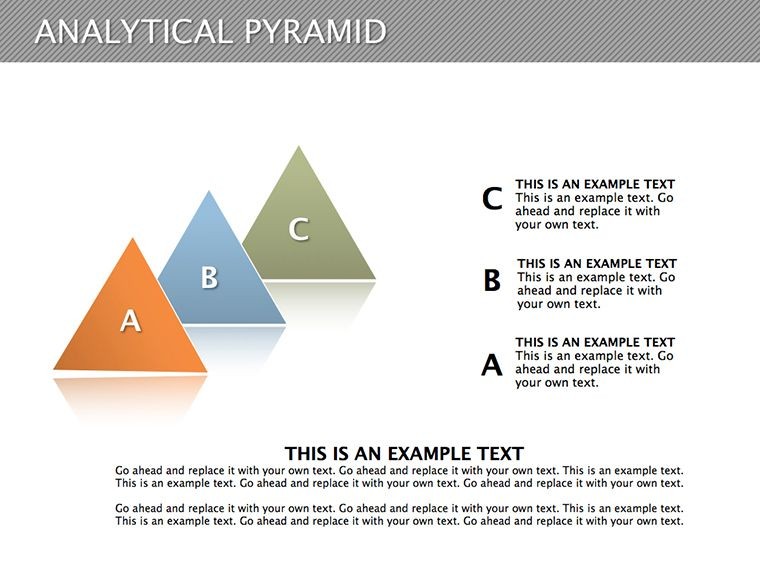
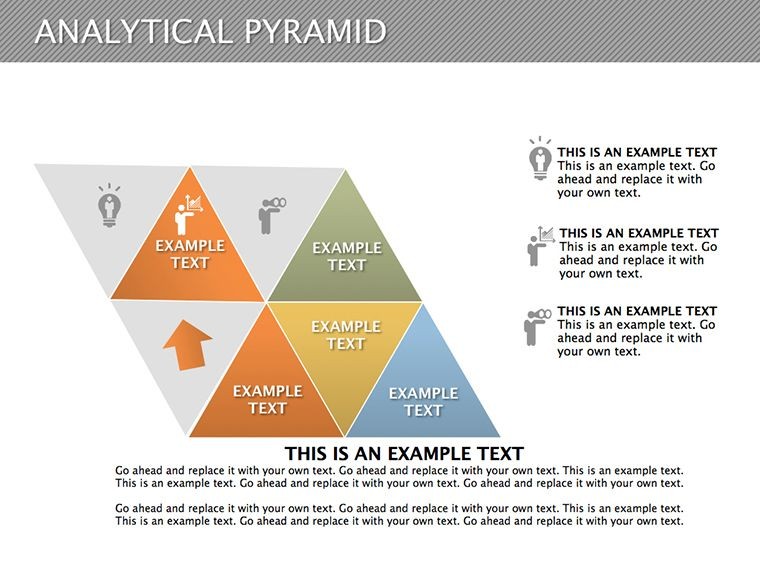
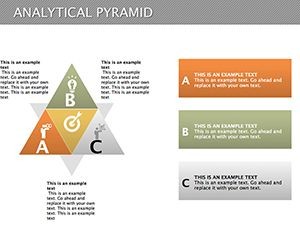
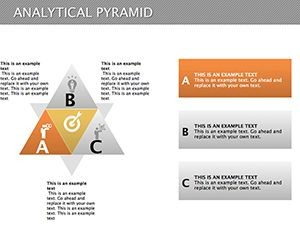
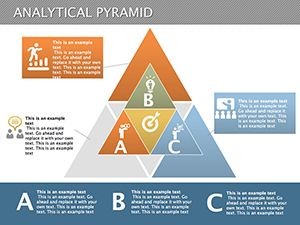
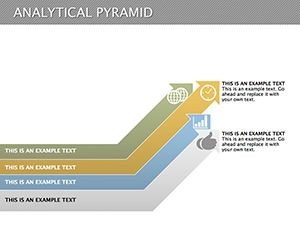
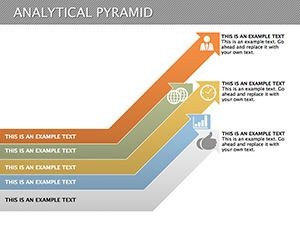
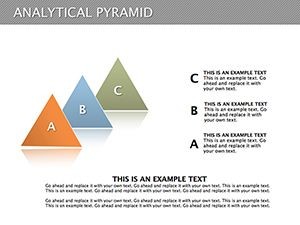
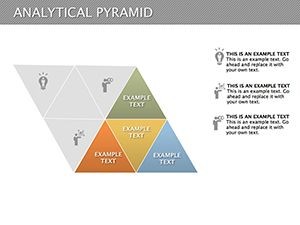
Diving into the slides, you'll find a curated selection that spans from foundational three-tier pyramids to intricate multi-level designs integrated with supporting visuals like bars and pies. Slide 1 kicks off with a basic apex pyramid, perfect for quick overviews - think distilling your quarterly goals into three escalating priorities. As you progress, Slide 5 introduces a segmented base layer, allowing you to stack revenue streams beneath profitability peaks, all while maintaining vector sharpness for effortless resizing.
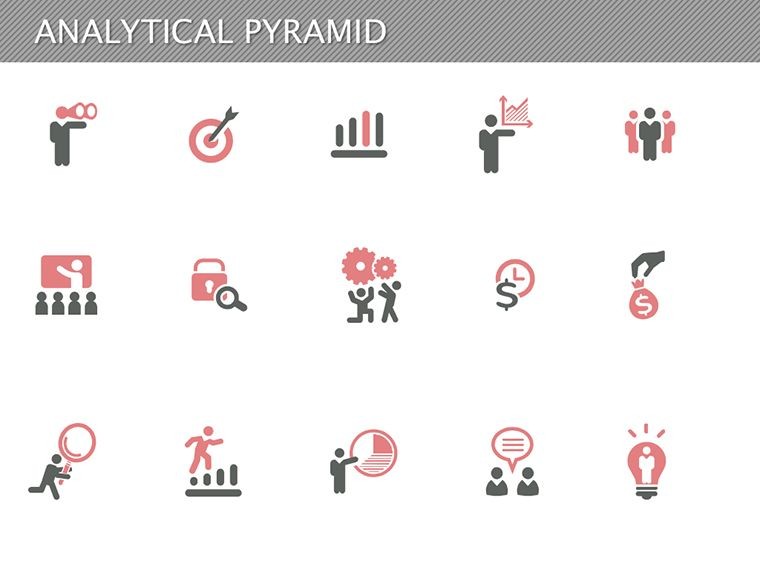
Customization is intuitive: tweak gradients to evoke stability in the base and urgency at the top, or swap in thematic icons to spotlight elements like market risks or growth levers. Built-in animations guide the eye sequentially - reveal the foundation first, then build to the summit - mirroring the logical flow of analytical discussions. I've customized Slide 9 for a client's supply chain audit, layering vendor dependencies at the bottom and efficiency metrics at the crown, which not only clarified bottlenecks but sparked a 20-minute debate turned productive pivot.
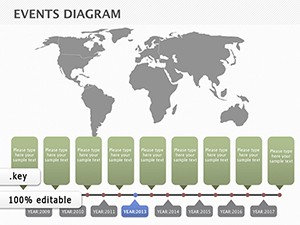
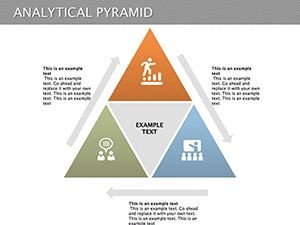
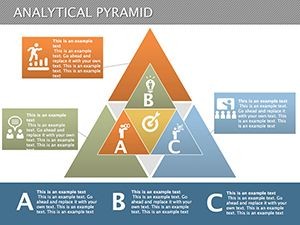
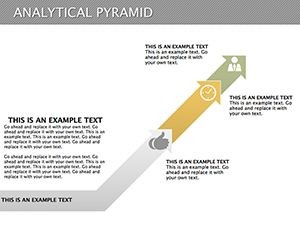
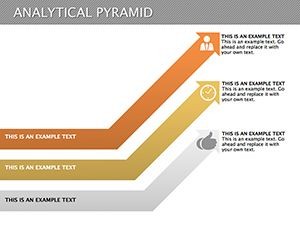
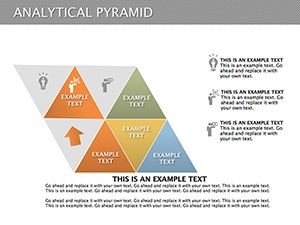
Further along, Slides 12 through 15 blend pyramids with radial elements, ideal for factor prioritization where interconnected ideas radiate from a central thesis. These aren't static; they're responsive to your data inputs, ensuring your hierarchies adapt as your analysis evolves. The final two slides offer hybrid views - pyramids overlaid on timelines - for those temporal breakdowns, like projecting investment returns from current baselines to future horizons. Every element is optimized for export, whether to PDF for handouts or high-res images for reports, keeping your professional edge intact across formats.
Seamless Workflow Integration for Busy Presenters
Integrating this template into your routine is straightforward, especially if you're already in the Apple ecosystem. Start by opening the .key file in Keynote, then populate the base layer with your broadest data - perhaps pulling from Numbers spreadsheets via copy-paste or direct linking for live updates. From there, ascend tier by tier: insert text for mid-level categories, embed charts for specifics, and apply color schemes that align with your brand palette. The vector-based design means no pixelation during zooms, a lifesaver in virtual client calls.
For teams, collaboration shines - share via iCloud for real-time edits, or export segments to Google Slides if needed, though the native Keynote fidelity is unmatched. In my workflow, I pair this with mind-mapping tools pre-presentation to outline the pyramid skeleton, then flesh it out here for polish. Animations sync effortlessly with transitions, creating a rhythmic reveal that holds attention far better than bullet barrages. And for those late-night tweaks on iPad, the touch-friendly controls make layering a breeze, turning travel downtime into polished prep time.
Real-World Applications: How Pros Leverage Pyramid Structures
In consulting gigs, I've deployed these pyramids to unpack client challenges with surgical precision. Take a recent merger advisory for a tech firm: the base slide housed macroeconomic trends, mid-layers dissected synergies, and the apex pinpointed integration milestones. The visual climb not only justified our recommendations but empowered the exec team to own the narrative in follow-ups. It's this empowerment - handing your audience a mental scaffold - that elevates discussions from passive viewing to active strategy sessions.
Managers in operations often overlook hierarchies until bottlenecks hit; I've guided ops leads using Slide 7's inverted pyramid to flip perspectives - starting from end-user pain points and drilling down to root causes. In one manufacturing pitch, this reframing shifted focus from symptoms to systemic fixes, streamlining a process overhaul pitch that closed the deal on the spot. Educators, too, find gold here: a university professor I advised adapted Slide 3 for lecture breakdowns, layering historical contexts beneath modern implications in a policy course, making dense readings resonate with undergrads.
Founders pitching to VCs swear by the template's apex-focused slides for traction roadmaps - base your market validation, build through user acquisition, peak at scalability proofs. During a startup accelerator demo, one entrepreneur used a customized version to layer funding asks atop value props, turning skepticism into term sheet talks. Across these scenarios, the pyramid's upward momentum instills confidence, signaling that your analysis isn't scattered but strategically stacked.
Industry-Specific Use Cases for Targeted Impact
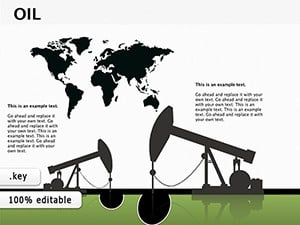
Finance pros thrive with pyramids for dissecting P&L statements: envision Slide 4's structure, where cost centers form the sturdy base, revenue drivers climb midway, and ROI forecasts crown the top - ideal for investor updates in a volatile 2025 market. In healthcare consulting, I've layered patient journey maps, starting with intake touchpoints and ascending to outcome metrics, helping administrators visualize care pathway efficiencies without jargon overload.
Marketing teams use these for campaign funnels, inverting the pyramid to show drop-off points from awareness peaks down to conversion bases, a tactic that's proven invaluable in A/B test reviews. Non-profits, facing donor scrutiny, build impact pyramids - funding streams at the foundation, program deliverables in the middle, societal change at the summit - to articulate ROI in grant proposals. Even in legal practices, partners employ them for case hierarchies, stacking precedents below argument peaks, streamlining partner meetings into decisive actions.
These applications highlight the template's versatility: it's not locked to one sector but adapts to any domain demanding layered logic, from R&D pipelines in pharma to talent frameworks in HR. In 2024's data deluge, as remote collaborations demand sharper storytelling, tools like this become essential for cutting through noise and landing points that stick.
Pyramid Template vs. Built-In Keynote Tools: A Clear Comparison
| Aspect | Analytical Pyramid Template | Default Keynote Pyramids |
|---|---|---|
| Customization Depth | Layered vectors with gradient controls, icon libraries, and hybrid chart integrations for nuanced hierarchies. | Basic shapes with limited fills; requires manual grouping for complexity. |
| Animation Options | Pre-set sequential reveals per tier, syncing with slide transitions for dynamic builds. | Standard build-ins; custom paths need extra setup and testing. |
| Slide Variety | 17 specialized slides, from simple to multi-faceted, with timeline overlays. | Generic shape tools; users build from scratch, risking inconsistencies. |
| Time Efficiency | Ready-to-edit frameworks cut prep by hours; one-time setup for recurring use. | Time-intensive design from zero, prone to alignment issues. |
| Professional Polish | Optimized for print/export with thematic elements for brand alignment. | Functional but lacks advanced visuals like integrated data viz. |
This side-by-side underscores why pros ditch defaults: the template delivers polish and speed, freeing you to focus on insights over inkling.
Unlock Deeper Insights in Your Next Strategy Session
Ready to stack your ideas with precision? This template is your shortcut to presentations that don't just inform but inspire action.
Pro Tips from a Seasoned Presenter
Start simple: Use the three-tier slide for initial brainstorms, then scale up as details emerge. Color-code tiers by urgency - cool blues for foundations, warm reds for peaks - to guide subconscious focus. Always test animations in presenter view; a smooth build can turn a monologue into a dialogue. Pair with audience polls mid-deck to validate layers on the fly, turning passive slides into interactive anchors.
Frequently Asked Questions About the Analytical Pyramid Keynote Template
Can I use this template in versions of Keynote older than 2016?
No, it's optimized for Keynote 2016 and newer to leverage advanced vector and animation features. For earlier versions, consider exporting static elements from compatible tools.
How do I integrate live data from spreadsheets into the pyramid slides?
Link charts directly via Keynote's data import from Numbers or Excel; update sources for real-time refreshes during edits, ensuring your hierarchies stay current without manual re-entry.
Is the template suitable for team collaboration in shared environments?
Absolutely - upload to iCloud for simultaneous edits, or share .key files via AirDrop. Version history tracks changes, making group refinements hassle-free.
What file formats can I export these diagrams to for non-Keynote users?
Export as PDF for universal viewing, high-res PNG/JPEG for embeds, or even QuickTime videos to capture animations for email blasts or social clips.
Does the license allow modifications for client-specific branding?
Yes, the one-time license permits full customization, including color swaps and icon additions, for unlimited personal or commercial projects.
How many pyramid variations are included for different analysis depths?
The pack offers seven core pyramid styles, scaling from basic triads to five-tier complexes, plus hybrids for versatile applications.
Ready to elevate your analytical game? Secure this template today and watch your presentations rise to new heights.