Market Research Keynote Diagrams: Insightful Visual Tools


Type: Keynote Diagrams template
Category: Illustrations, Analysis
Sources Available: .key
Product ID: KD00110
Template incl.: 16 editable slides
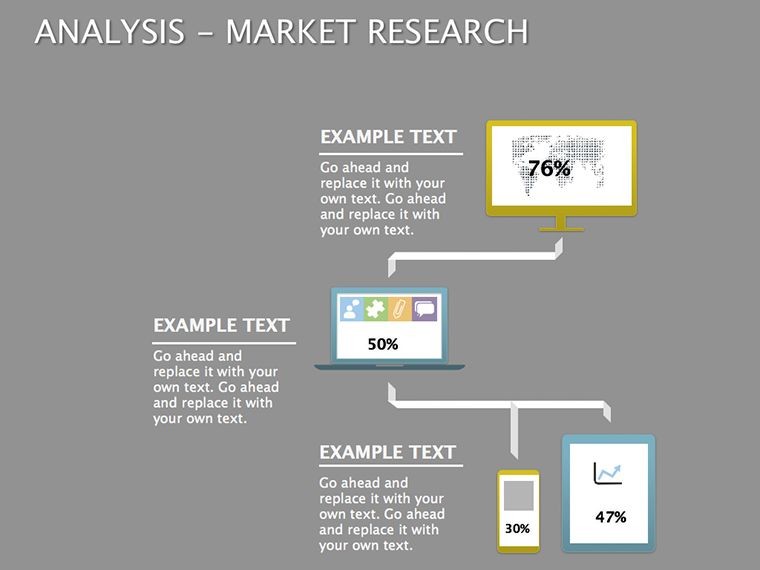
Navigating the complexities of market research demands tools that turn raw data into actionable insights. Our Analysis and Market Research Keynote Diagrams template delivers just that, with 16 meticulously designed editable slides tailored for marketing professionals, analysts, and business strategists. This template focuses on the systematic collection, recording, and analysis of marketing data, helping you improve decision-making and control in dynamic environments.
Picture this: You're preparing a report on consumer trends, and instead of dense text, you use vibrant diagrams to illustrate key findings. From SWOT analyses to consumer behavior flows, these slides make complex information accessible and engaging. Compatible with Apple Keynote, it ensures smooth performance on Mac, iPad, or iPhone. Whether launching a new product or evaluating competitors, this template equips you to present with confidence and clarity, drawing audiences into your narrative like a well-crafted story.
Essential Features for Effective Analysis
At the heart of this template are features that prioritize usability and impact. Each slide is built with editable elements, allowing quick adaptations to your specific data sets.
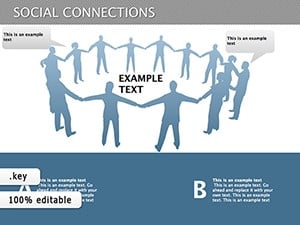
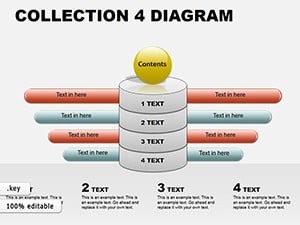
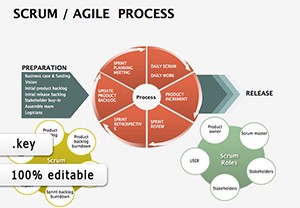
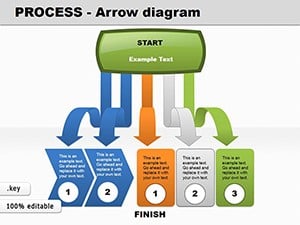
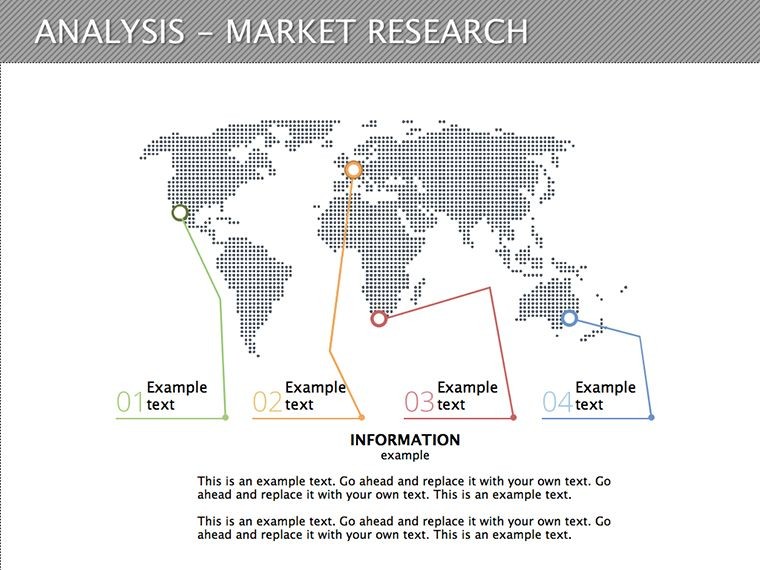
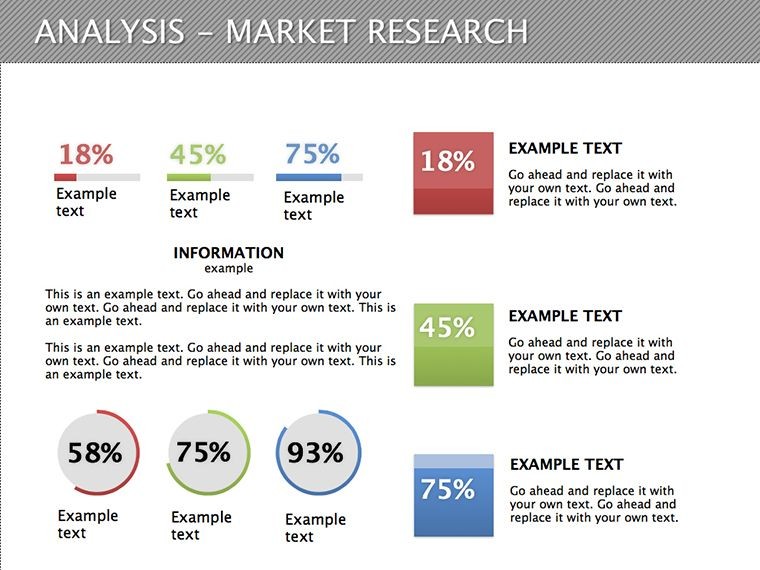
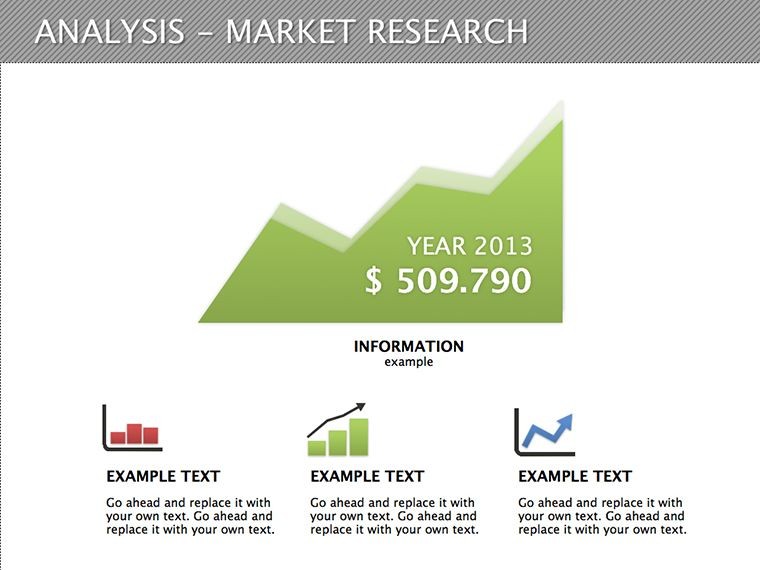
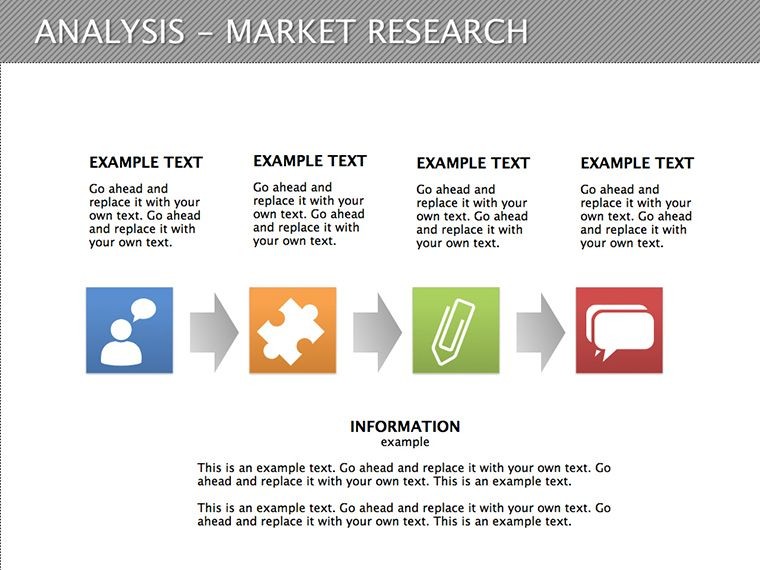
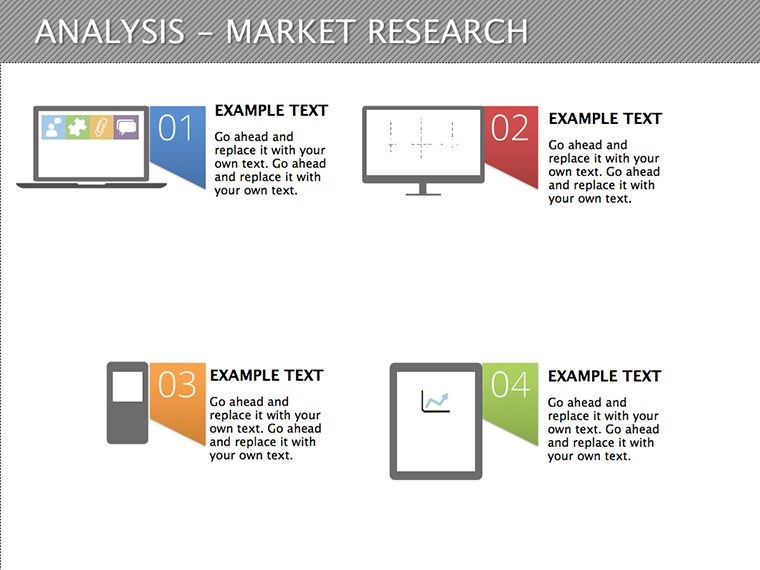
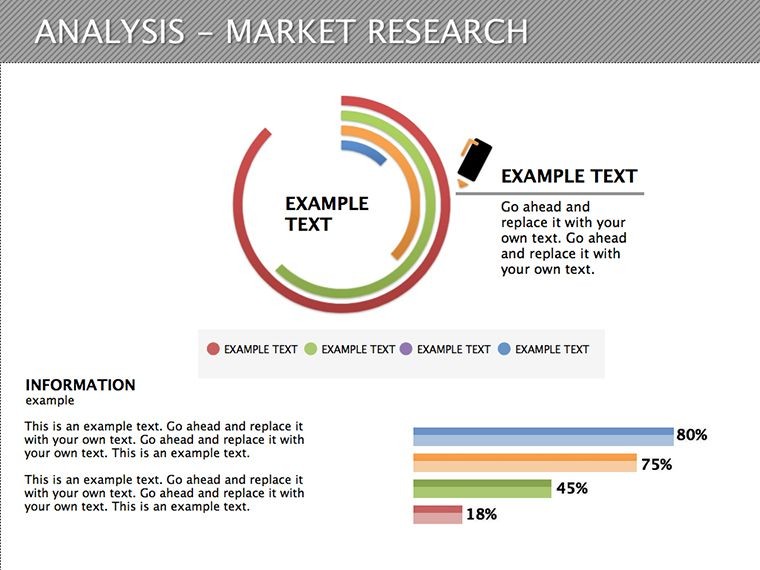
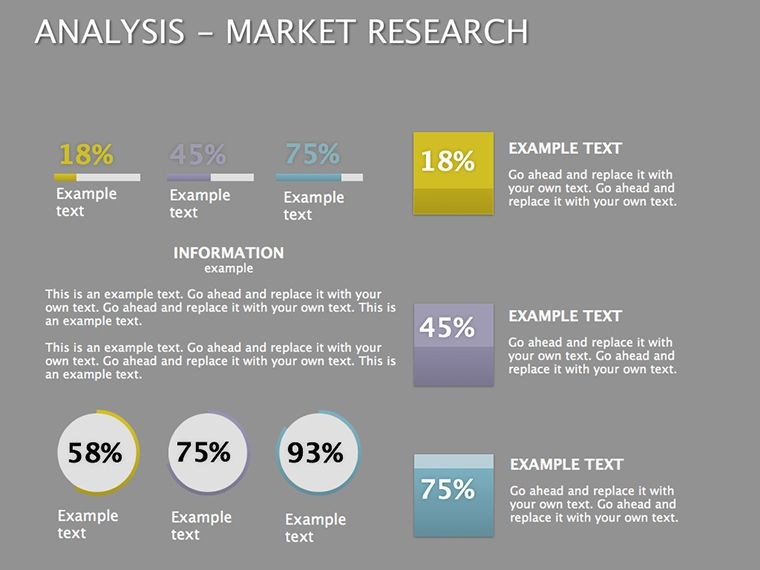
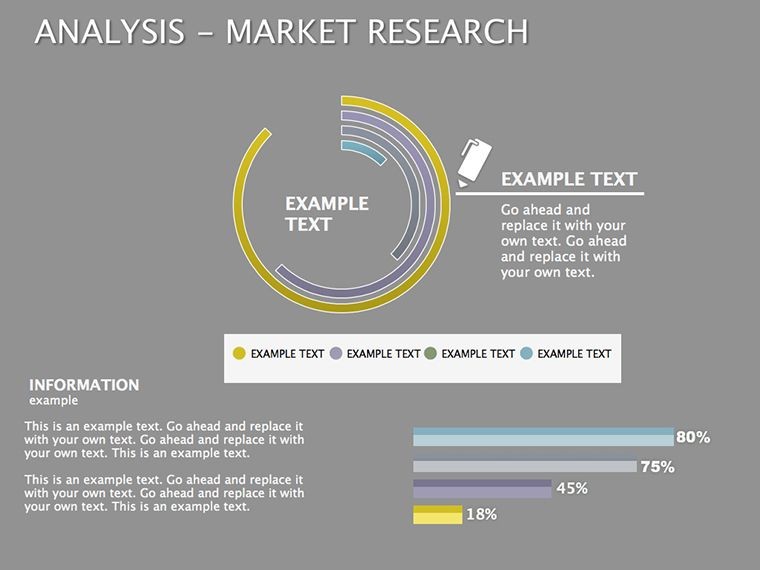
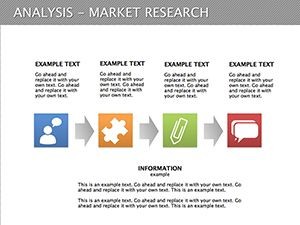
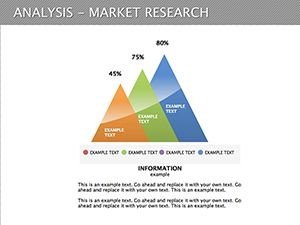
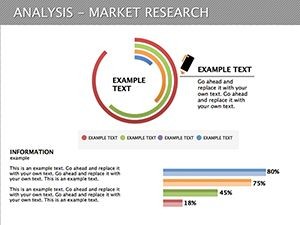
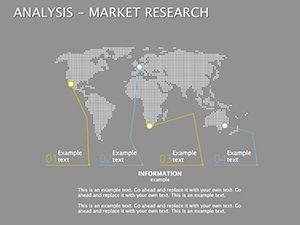
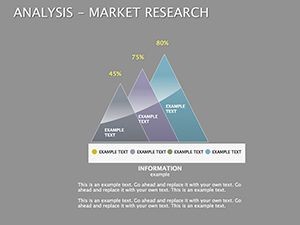
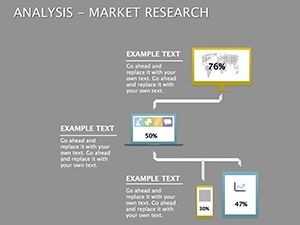
- Diverse Diagram Styles: Includes pie charts, bar graphs, flow diagrams, and matrices, all themed for market research.
- Data Integration Ease: Placeholder spots for importing Excel data or manual entries, streamlining your workflow.
- Professional Aesthetics: Clean, modern designs with color schemes that enhance readability and visual appeal.
- Animation Readiness: Built-in transitions to reveal insights progressively, keeping viewers hooked.
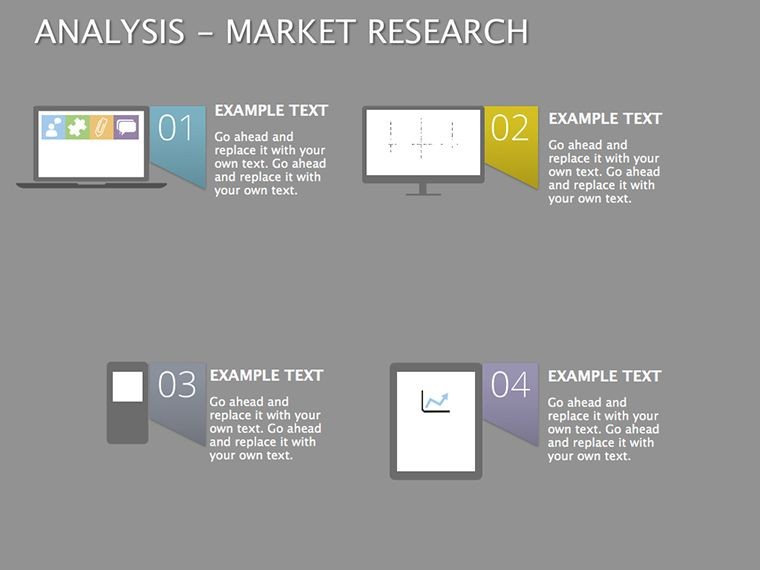
- Resolution Optimized: High-quality vectors that maintain sharpness across devices.
These aren't just bells and whistles; they address common challenges, like overwhelming audiences with data overload. As highlighted in marketing case studies from firms like Nielsen, visual aids like these can increase comprehension by 400%.
Practical Applications in Market Scenarios
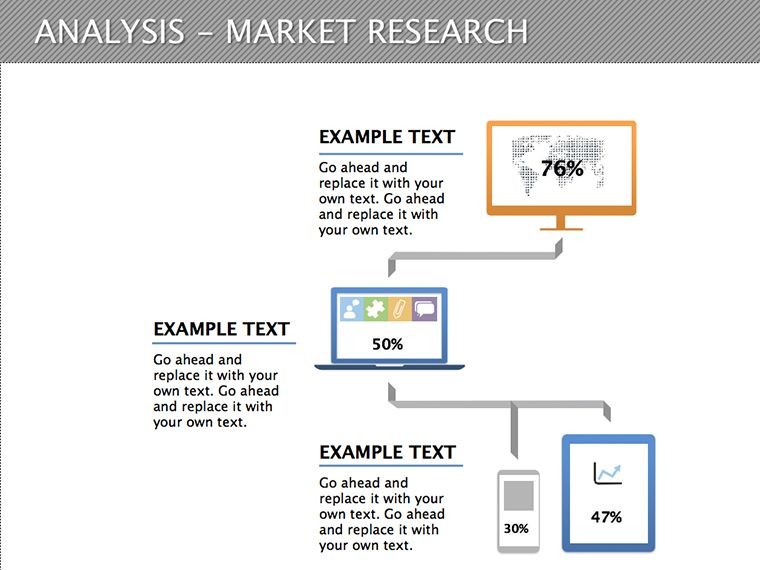
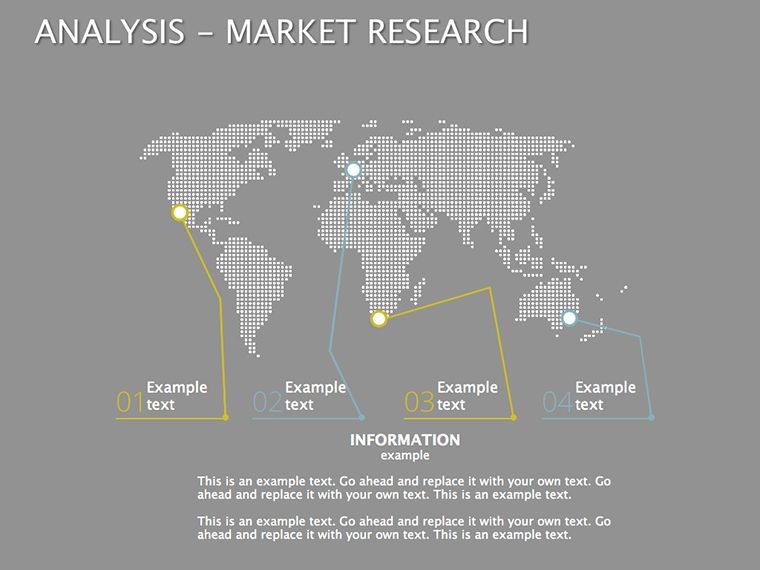
Apply this template across various market research phases for tangible results. For instance, in competitive analysis, use matrix diagrams to compare features and pricing, revealing gaps your business can exploit.
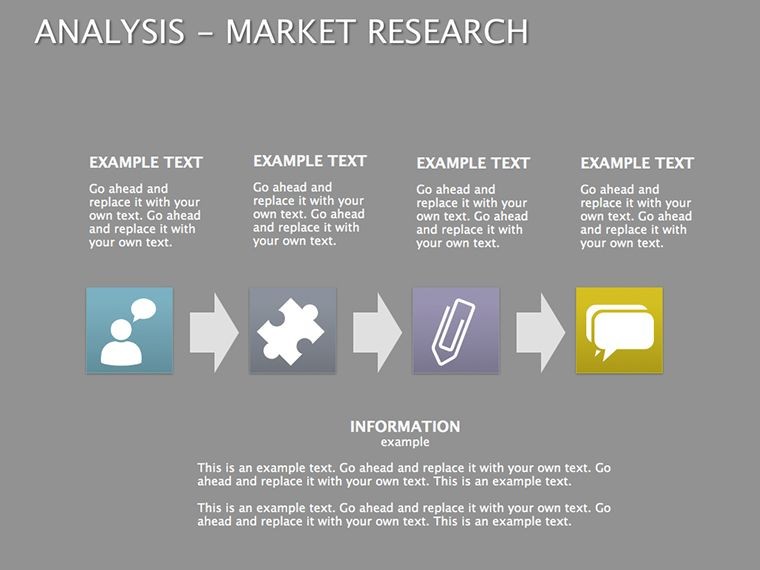
- Consumer Behavior Studies: Map out journey flows to pinpoint pain points and opportunities.
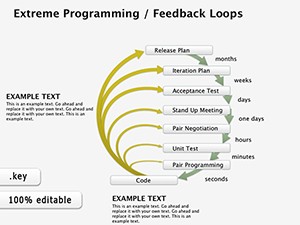
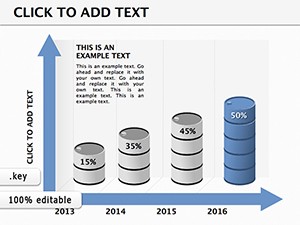
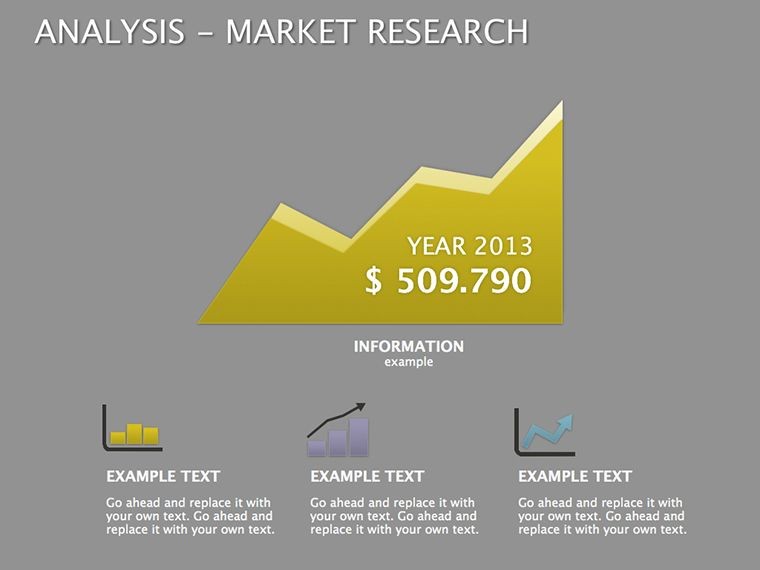
- Trend Forecasting: Employ line graphs and timelines to project market shifts based on historical data.
- Product Launch Planning: Visualize segmentation strategies with Venn diagrams for targeted marketing.
- Performance Reviews: Bar charts to track KPIs, facilitating data-backed recommendations.
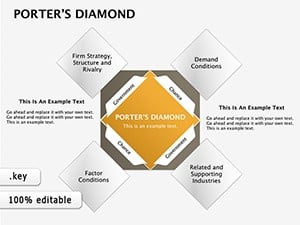
A real-world example: A beverage company, similar to those profiled in Harvard Business School cases, used analogous diagrams to analyze market saturation, leading to a successful regional expansion. This template supports such outcomes by aligning with proven frameworks like Porter's Five Forces, ensuring your analyses are both thorough and persuasive.
In-Depth Slide Overview
To maximize value, here's a breakdown of the 16 slides:
- Slides 1-4: Introductory Overviews: Title pages and summary charts for setting the stage.
- Slides 5-10: Core Analysis Tools: SWOT, PESTLE, and competitor matrices with customizable fields.
- Slides 11-14: Data Visualization: Graphs and infographics for quantitative insights.
- Slides 15-16: Conclusion and Recommendations: Actionable summaries with call-out boxes.
Pro tip: Layer data gradually using Keynote's build effects to build suspense and emphasize key revelations, a technique endorsed by presentation gurus like Nancy Duarte.
Enhancing Your Marketing Workflow
Integrating this template into your routine amplifies efficiency. Its iCloud sync feature allows collaborative editing, ideal for remote teams. For trustworthiness, all elements are unlocked, giving you complete creative freedom without hidden restrictions.
Users in market research roles appreciate how it condenses hours of graphing into minutes, as echoed in industry reports from Gartner. Whether for client pitches or internal briefings, it positions you as an expert, fostering better stakeholder buy-in.
Advanced Tips from Marketing Experts
Elevate your use with these insights:
- Focus on storytelling: Weave data into narratives, starting with problems and ending with solutions.
- Customize for audience: Adjust complexity - detailed for analysts, simplified for executives.
- Validate data: Cross-reference with sources like Statista for credibility.
- Iterate designs: Test slides in rehearsals to refine flow and impact.
These align with principles, drawing from authoritative voices in marketing like Philip Kotler, to ensure your presentations not only inform but inspire action.
Ready to Revolutionize Your Research?
With this Keynote template, you're not just presenting data - you're crafting compelling market stories. Download it today and experience the difference in your analytical prowess.
Frequently Asked Questions
How do I import data into these slides? Use Keynote's table tools or copy from spreadsheets for seamless integration.
Is this template iPad-compatible? Yes, fully optimized for touch editing on iOS devices.
Can I add my own branding? Absolutely, edit themes and logos effortlessly.
What if my research needs more diagrams? Duplicate slides and modify as needed.
Are there export options? Export to PDF, PowerPoint, or images for versatility.