Fishbone Keynote Diagrams: Decode Complex Problems


Type: Keynote Diagrams template
Category: Relationship
Sources Available: .key
Product ID: KD00029
Template incl.: 14 editable slides
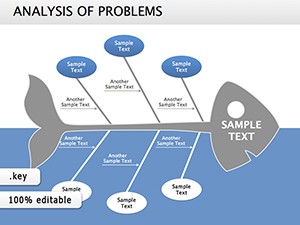
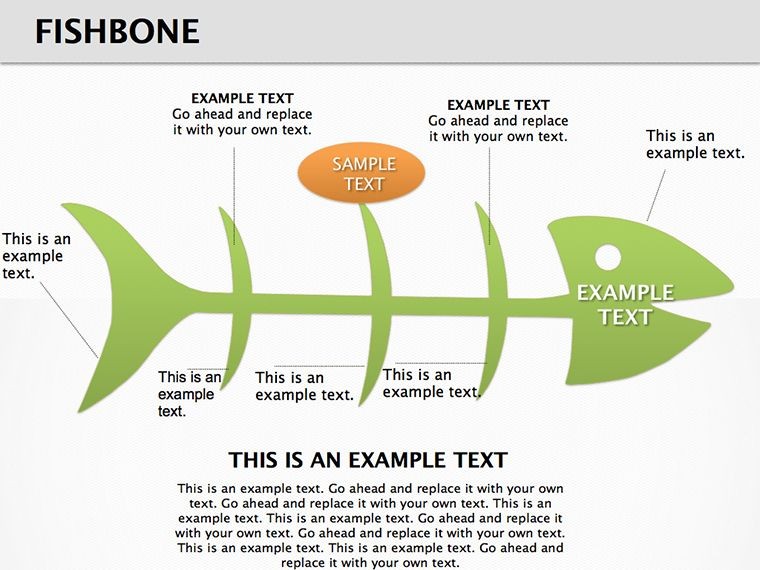
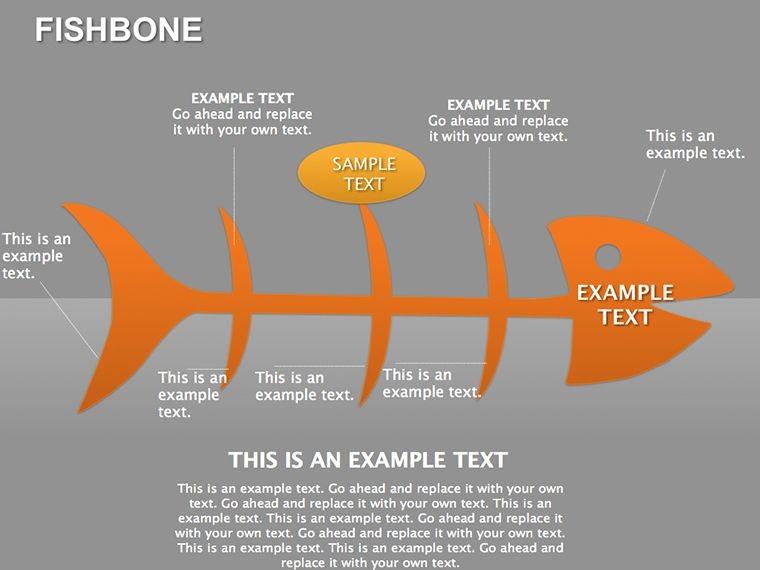
When challenges arise, untangling their roots is key to progress. Our Fishbone Keynote Diagrams template serves as a structured framework for dissecting issues, making it a go-to for educators and analysts alike. With 14 editable slides, it positions the problem statement at the head and supporting facts along the bones, ideal for research or workshops. Compatible with Keynote, it allows seamless edits on Mac or iPad, fitting into collaborative environments. Consider a teacher guiding students through environmental case studies - the diagram organizes causes into categories like policy or human factors. Or a quality analyst in manufacturing, categorizing defects to pinpoint origins. The template's logical layout promotes thorough exploration, turning vague problems into focused discussions, whether in classrooms or strategy rooms.
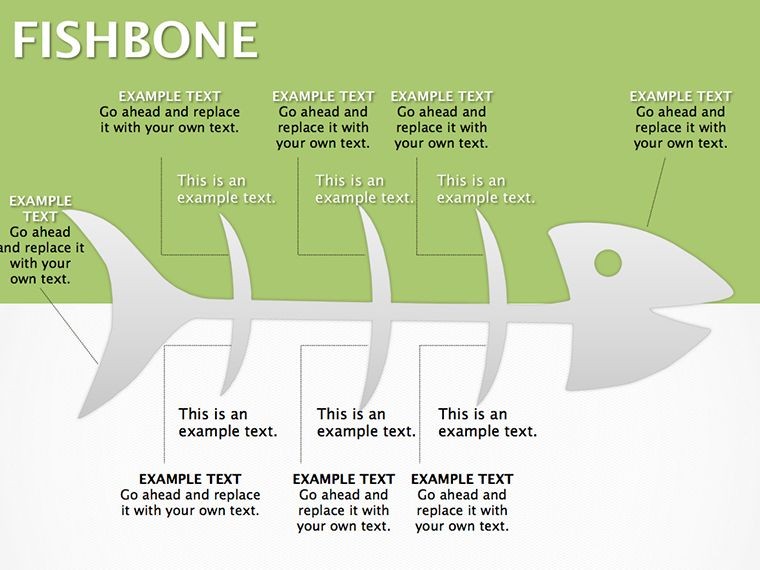
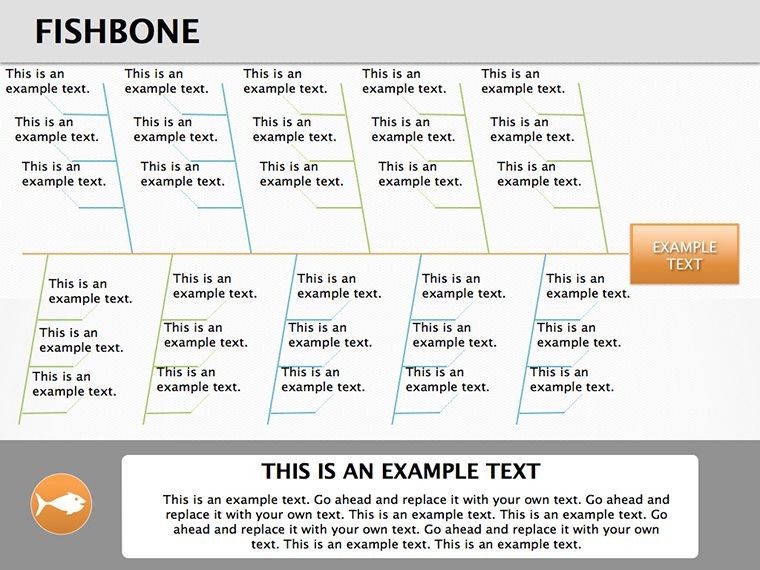
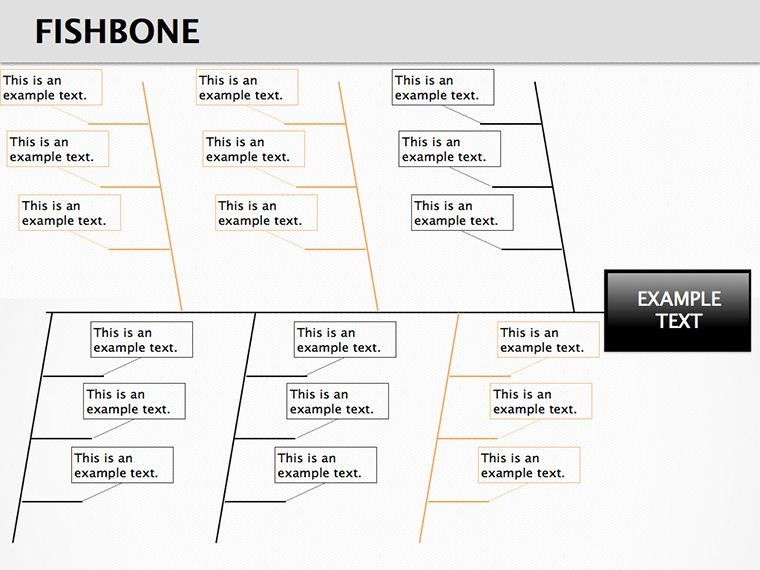
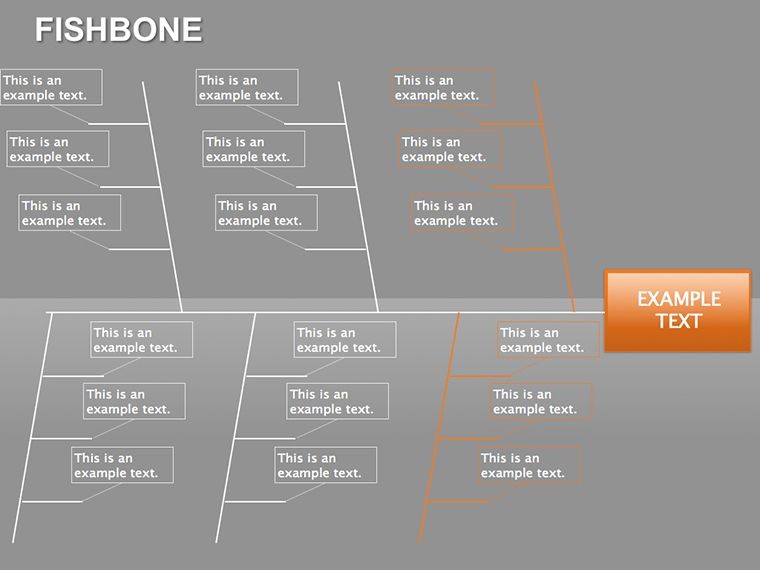
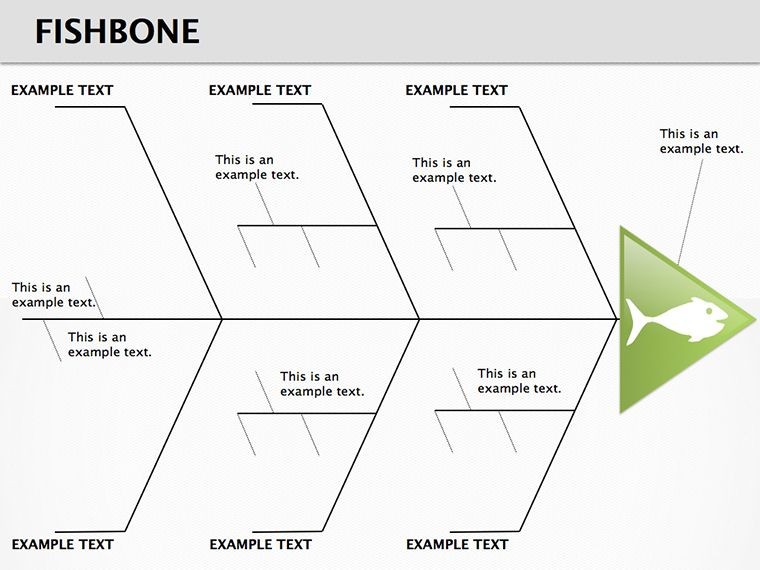
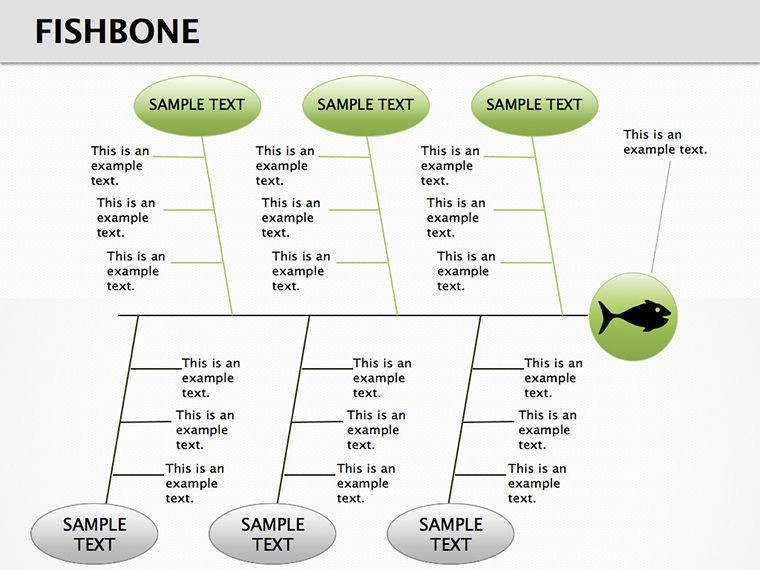
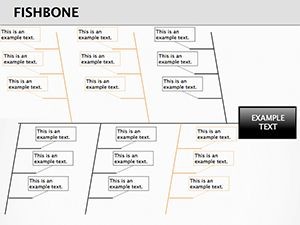
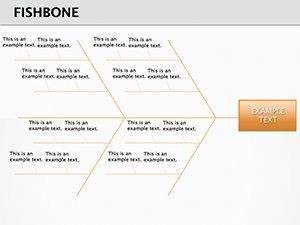
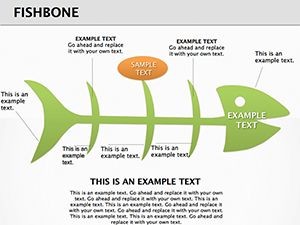
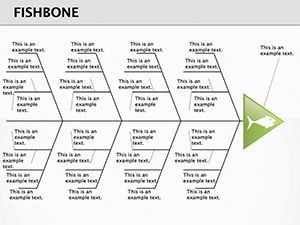
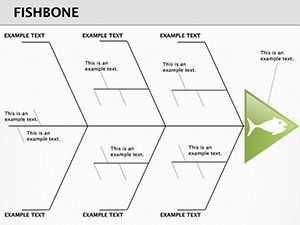
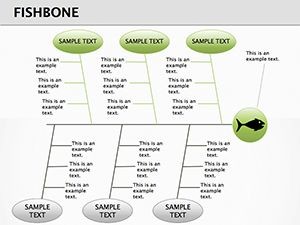
Key Components of the Fishbone Structure
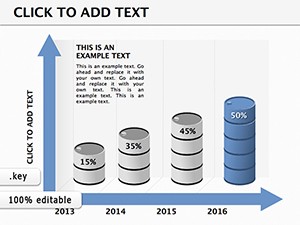
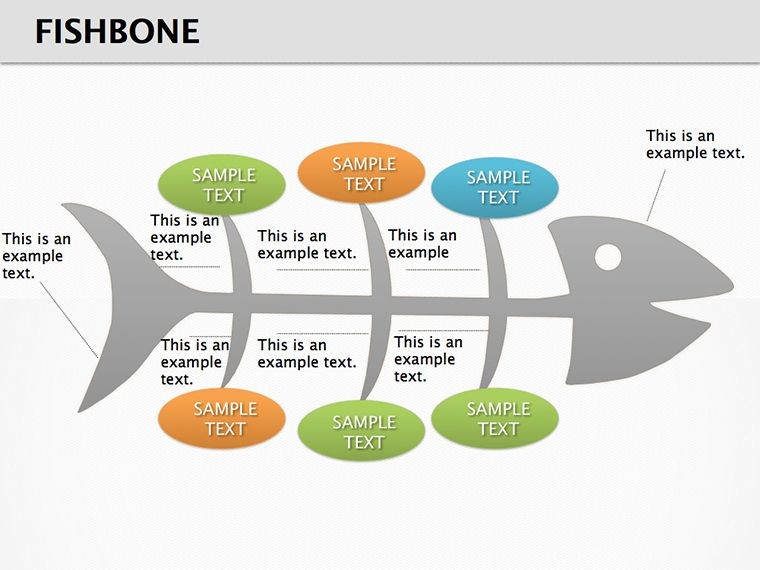
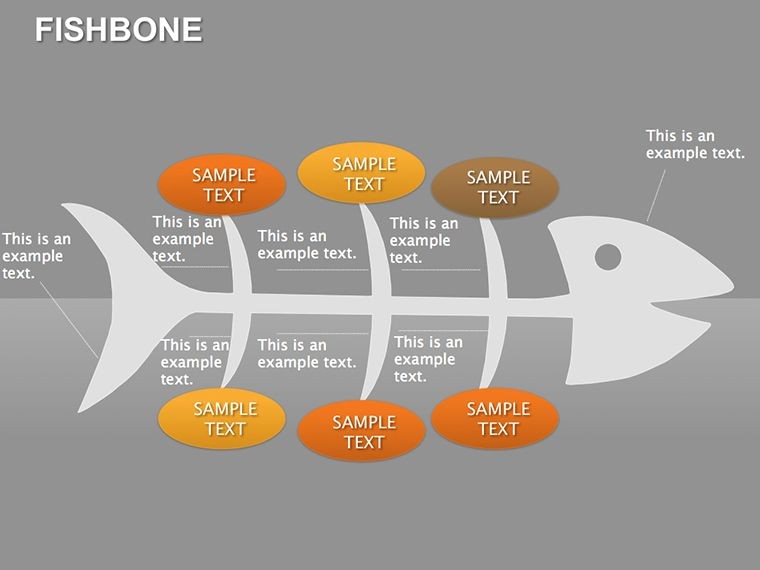
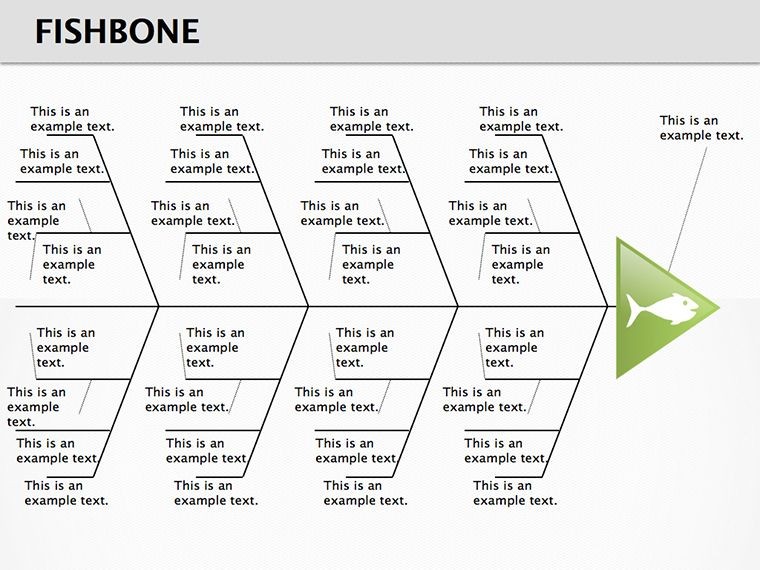
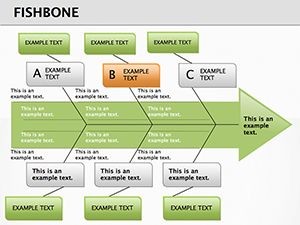
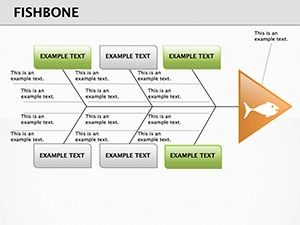
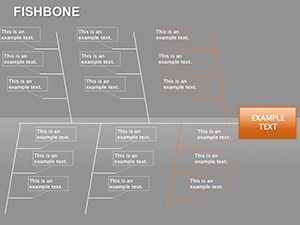
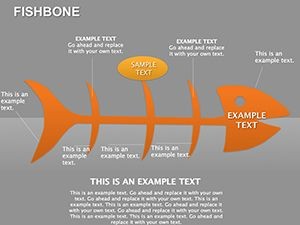
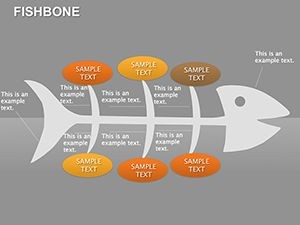
The core is the fishbone itself, with a central spine leading to branches for major categories. Each slide varies in complexity, from basic four-branch setups to detailed multi-level ones. Edit text in nodes to detail specific causes, and adjust branch lengths for emphasis. Colors differentiate categories, like blue for processes or orange for people, aiding quick scans. Vector elements ensure scalability, maintaining clarity in projections. This design, rooted in proven problem-solving methods, assists users like project leads in identifying bottlenecks efficiently.
Applying Fishbone in Diverse Contexts
In education, it structures group projects on social issues, encouraging debate on interconnected factors. Business teams use it for root cause analysis in operations, such as supply chain disruptions. For personal development, individuals map career hurdles, revealing patterns. A consultant might employ it in client sessions to visualize organizational challenges, fostering buy-in for changes. The template's versatility extends to virtual collaborations, where shared edits build collective understanding. It tackles the hurdle of overlooked details, ensuring comprehensive coverage.
Guide to Building Your Fishbone Diagram
- Open in Keynote and select a slide based on category count.
- Enter the problem at the head and facts at the tail.
- Label branches with main cause areas.
- Add sub-branches for detailed factors.
- Customize visuals to highlight priorities.
- Review and present for group input.
A facilitator in a workshop could use this to guide participants toward actionable insights.
Fostering Deeper Analysis with Enhancements
Add notes or evidence links to branches for substantiation, enriching the diagram. This is useful in investigative reports, where facts back claims. Unlike scattered notes, the visual consolidation aids retention and discussion. Teams in R&D note quicker resolutions, as the format exposes hidden links.
Beyond Basic Tools: Why This Template Stands Out
Keynote's default shapes require manual assembly, but this offers ready frameworks with balanced proportions. Generic diagrams might ignore hierarchy, yet here, layered branches handle depth. Open-source alternatives lack integration, while this syncs with Keynote's ecosystem.
Strategies for Effective Problem Mapping
- Gather input: Involve diverse views for fuller branches.
- Prioritize: Bold key causes for focus.
- Iterate: Update as new data emerges.
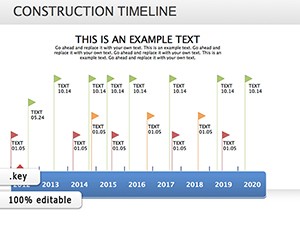
- Combine: Pair with timelines for temporal context.
- Simplify: Limit sub-branches to essentials.
An analyst applying these might uncover efficiencies in processes previously overlooked.
Unlock problem-solving potential - download this template to structure your analyses today.
Frequently Asked Questions
Compatible with which devices?
Works on Mac, iPad, and iPhone with Keynote.
Can I add more branches?
Yes, duplicate and edit as needed.
Suitable for large groups?
Absolutely, share for collaborative builds.
Any color presets?
Included themes, fully customizable.
How to export?
To PDF or images for sharing.