Promo code "00LAYOUTS"
Data Flow Diagrams for Keynote: Streamline Workflows
Type: Keynote Diagrams template
Category: Data, Process, Relationship
Sources Available: .key
Product ID: KD00017
Template incl.: 11 editable slides
Ever watched an audience's eyes glaze over mid-explanation of a convoluted process, only to realize your flowchart was the culprit? Flip that script with the Data Flow Diagrams for Keynote template - a versatile, editable arsenal that turns tangled workflows into crystal-clear pathways. Tailored for Apple Keynote, this set equips business pros, IT wizards, and educators to depict everything from supply chain loops to software pipelines with effortless grace.
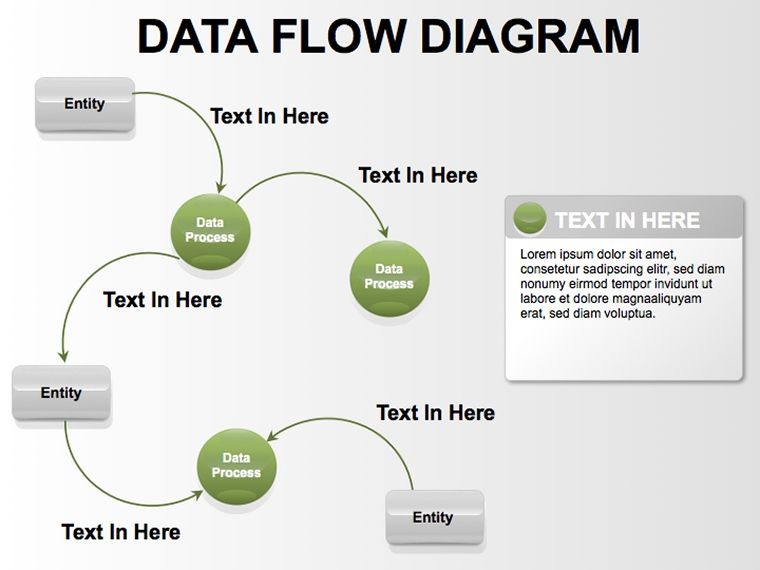
From the outset, it's built for flow: Open to a starter slide with nodes and arrows primed for your inputs, compatible with Keynote 2019+, where every line is adjustable for curvature or dash patterns. Vectors keep it sharp, animations add pulse - like arrows marching to mimic data packets zipping through servers. It's not mere decoration; it's a narrative engine, helping you spotlight inefficiencies or triumphs in reports that stick.
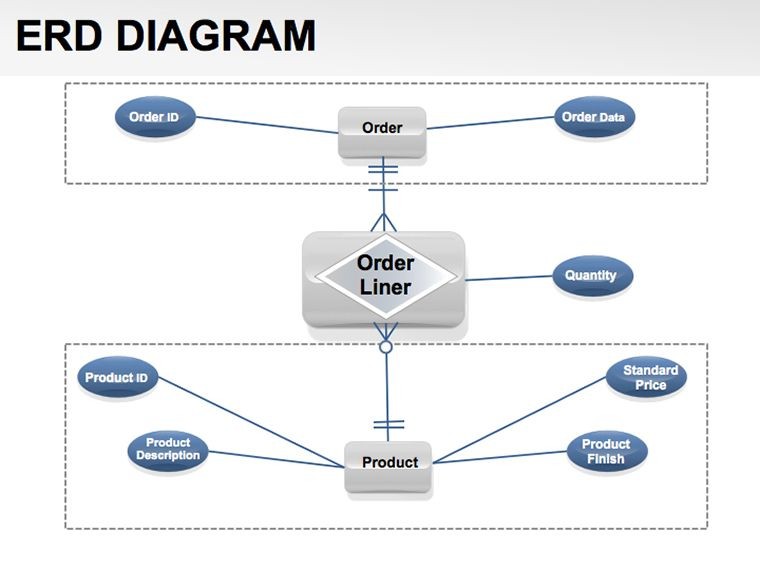
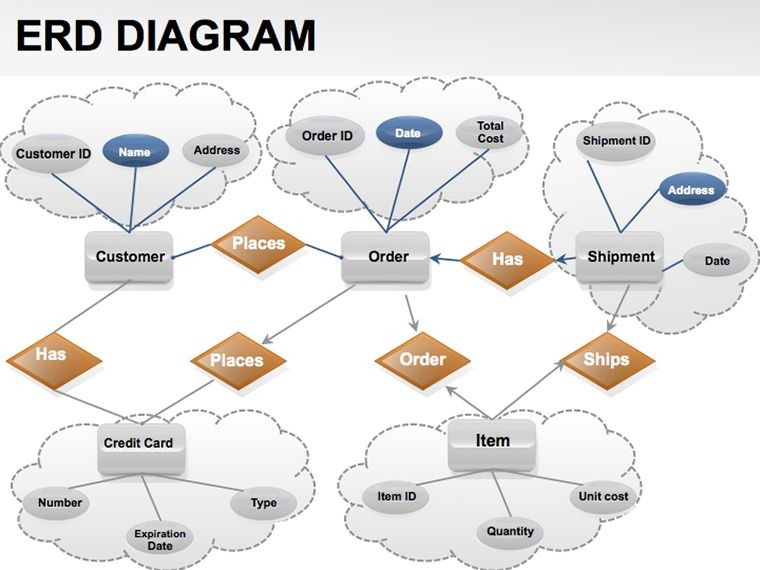
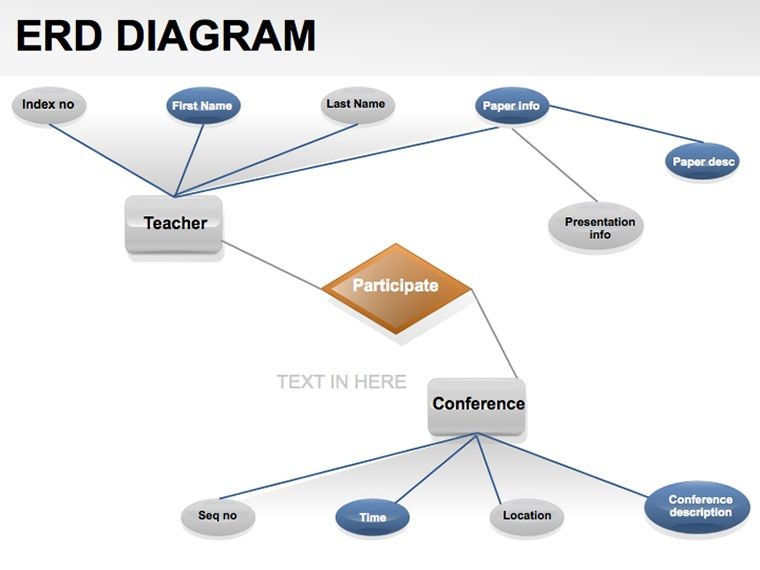
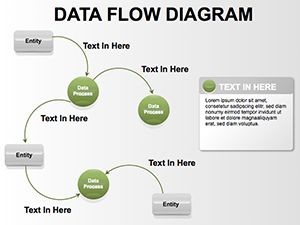
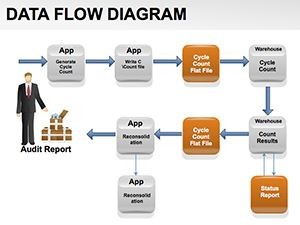
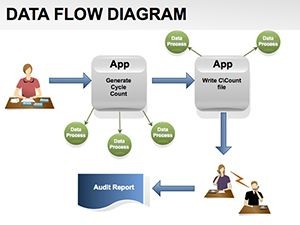
The progression feels intuitive: Early slides handle linear sequences, like order fulfillment steps, with rounded rectangles for processes and parallelograms for data stores. Midway, branch into decision diamonds for conditional paths, ideal for troubleshooting trees in support docs. Culminate with swimlane variants, assigning lanes to departments for collaborative overviews that foster buy-in.
Standout Features for Seamless Visualization
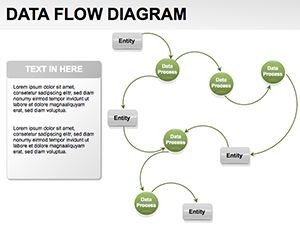
At the core, modularity reigns - ungroup a diagram to tweak individual icons, from gears for operations to clouds for external inputs. Over 30 pre-set motifs cover domains, with color gradients that evoke motion without overwhelming.
- Dynamic Connectors: Auto-route lines that bend around obstacles, maintaining tidiness as you iterate.
- Layered Builds: Staggered reveals to pace your story, unveiling sinks before sources for logical buildup.
- Theme Harmony: Master slide integration pulls your brand fonts and hues across all flows.
- Export Versatility: To SVG for web embeds or animated GIFs for memos, extending reach beyond Keynote.
Crafted with input from process analysts, these ensure diagrams scale from micro-tasks to enterprise maps without losing punch.
Practical Scenarios: Mapping Success Stories
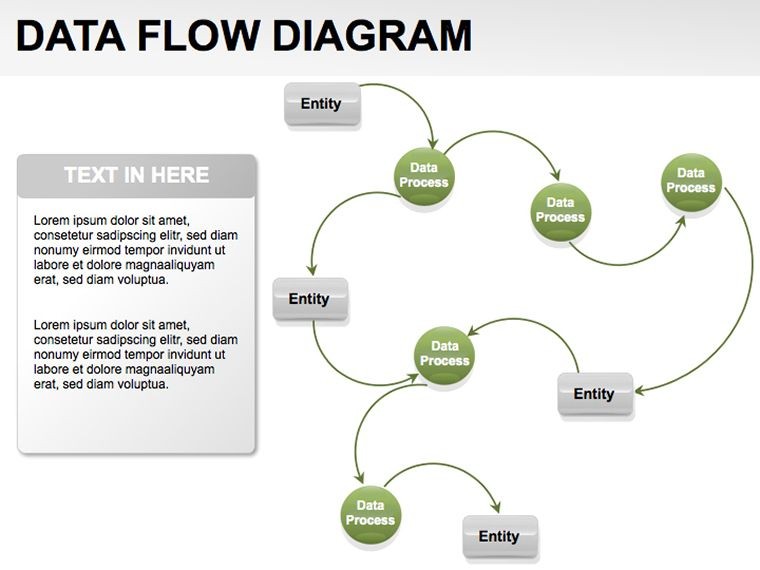
Transport to a marketing team's strategy session: Deploy the funnel slide to trace leads from awareness to conversion, arrows thickening at drop-off points to justify budget shifts. It sparks targeted tweaks, not vague nods. Or an IT admin diagramming network traffic - use the circular flow for load balancing, circles pulsing to show failover routes, demystifying uptime for execs.
Educators love the sequential variant for lesson plans: Outline historical events as data streams, inputs from eras feeding outputs of impacts, engaging students in causal chains. In project management, swimlanes dissect agile cycles - sprints as horizontal bands, vertical arrows for handoffs - clarifying roles in kickoffs. Even consultants wield it for client audits, overlaying as-is versus to-be states to blueprint transformations.
Universal appeal stems from its neutrality: Strip tech jargon for broad appeal, or layer in symbols like databases for specialist depth.
Hands-On Guide: Crafting Your Flow
Launch in Keynote, select a base slide, and label the source oval with your starting event. Drag connector tools to link processes, choosing styles like solid for synchronous or dotted for async. Populate data stores with bullet hierarchies, then apply a path animation to trace the journey. Balance density with whitespace, rehearse timings, and share a prototype for feedback. This ritual yields decks that inform and inspire, often in a fraction of solo build time.
Insights for Polished, Persuasive Diagrams
Prioritize directionality: Arrows point forward to imply progression, curving gently for feedback loops. Limit colors to three - input blue, process orange, output green - for subconscious guidance. Incorporate callouts for exceptions, keeping mains uncluttered. For global teams, add multilingual toggles via duplicate slides.
A project lead recounted how it unified cross-functional planning, visualizing bottlenecks that months of emails missed. Such revelations underscore its role in collaborative clarity.
Elevating Above Everyday Tools
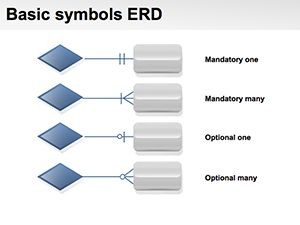
Keynote defaults offer basics, but lack the specialized symbols and auto-aligns here - resulting in wonky junctions that distract. This template's ecosystem includes legend builders and validation checks, akin to linter for visuals, ensuring integrity.
Bonus: Icon packs for niches, like healthcare flows with stethoscopes, broadening applicability.
Poised to propel your processes? Acquire the Data Flow Diagrams template for $22 and channel clarity through every channel.
Frequently Asked Questions
Is this template suited for non-linear processes?
Yes, decision nodes and loops handle branches and cycles, perfect for iterative or conditional workflows.
Can I adapt it for team collaboration?
Definitely - use Keynote Live or export to shared formats for concurrent edits and annotations.
How many diagram types are included?
A dozen variations, from linear to hierarchical, covering most flow needs with mix-and-match flexibility.
Does it work on iPad Keynote?
Fully, with touch-optimized handles for on-the-go refinements during travel or field work.
Are animations customizable per arrow?
Indeed, assign speeds and effects individually to emphasize critical paths or delays.

