Assessment of Technical Condition Keynote Charts: Precision in Process


Type: Keynote Charts template
Category: Process
Sources Available: .key
Product ID: KC00605
Template incl.: 21 editable slides
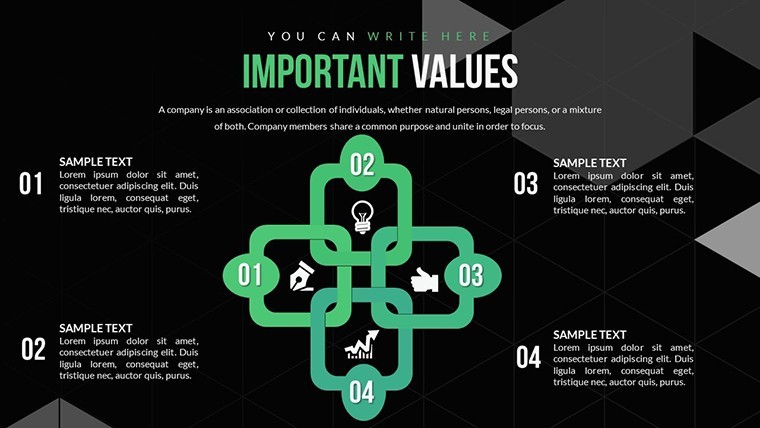
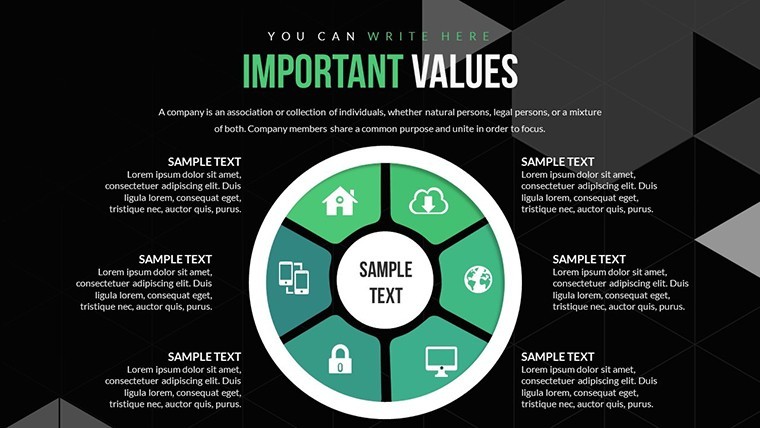
Evaluating technical conditions demands clarity and detail, especially in fields like engineering and maintenance. The Assessment of Technical Condition Keynote charts template provides a robust solution with 21 editable slides centered on process visualizations. Optimized for iWork Keynote on Mac, this template is essential for professionals analyzing systems, from machinery diagnostics to infrastructure reviews. It turns intricate data into streamlined processes, helping you communicate findings effectively to teams or clients.
Think of delivering a report where animated flows guide viewers through assessment stages, highlighting risks and resolutions. With colorful variations and vector icons, your slides not only inform but engage, fostering better decision-making. Fully editable, it adapts to your specific technical narratives, ensuring accuracy without the design overhead.
Standout Features for Technical Process Mapping
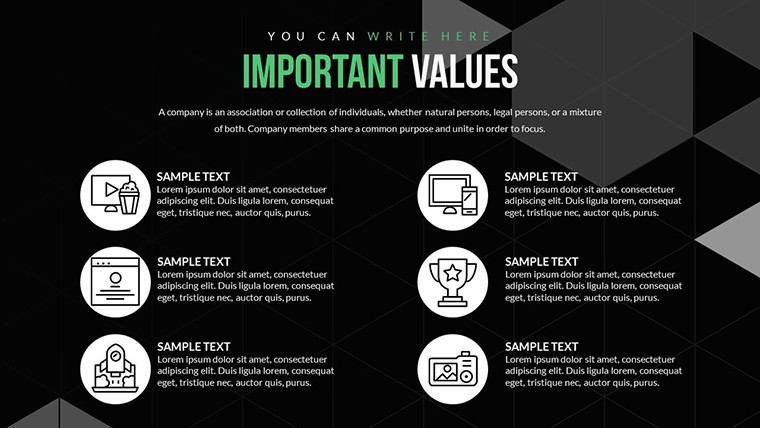
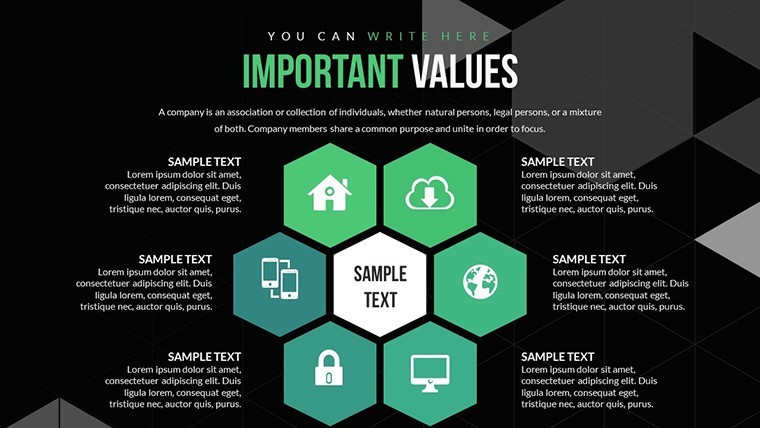
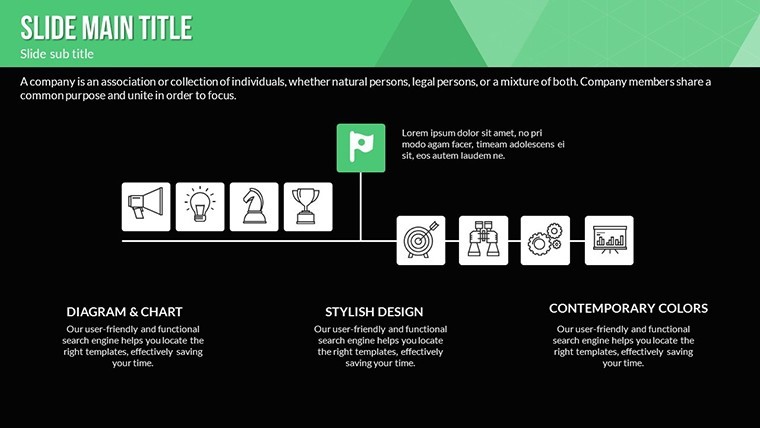
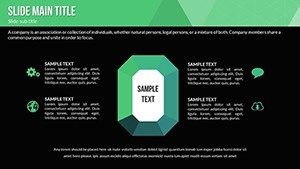
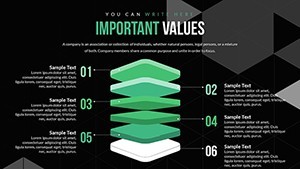
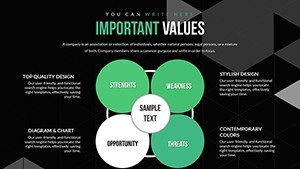
Anchored in the 'Process' category, this template offers tools for sequential and analytical charts, perfect for condition assessments.
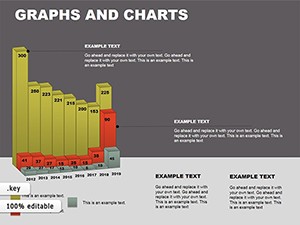
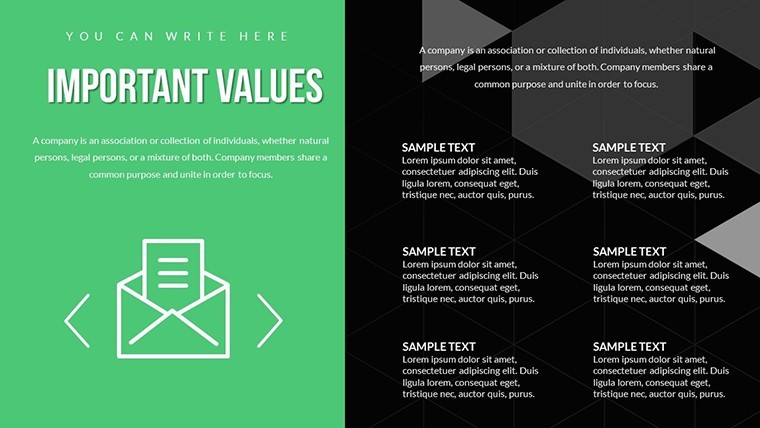
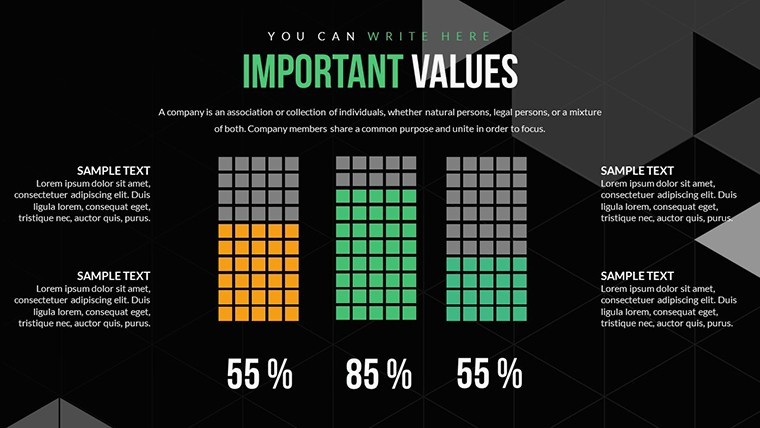
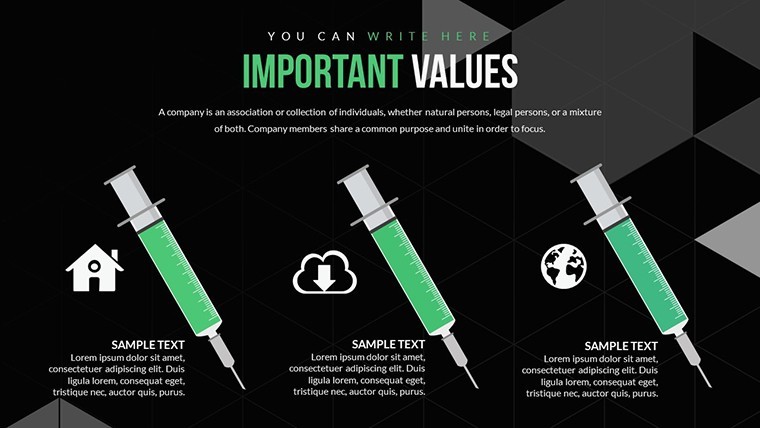
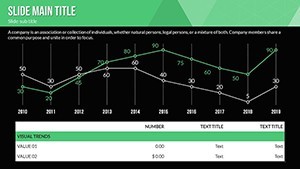
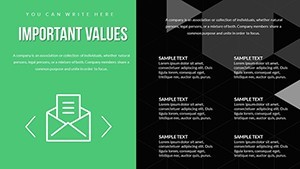
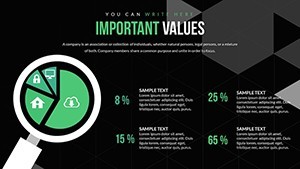
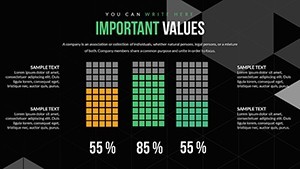
- Colorful Variations: Use hues to denote condition levels - green for optimal, red for critical - in process flows.
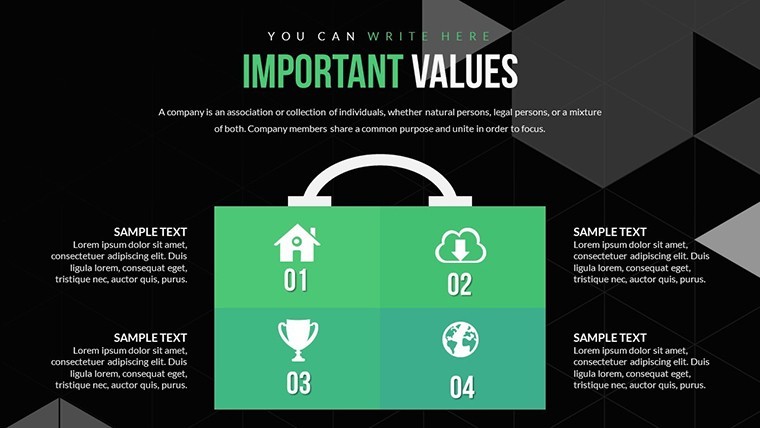
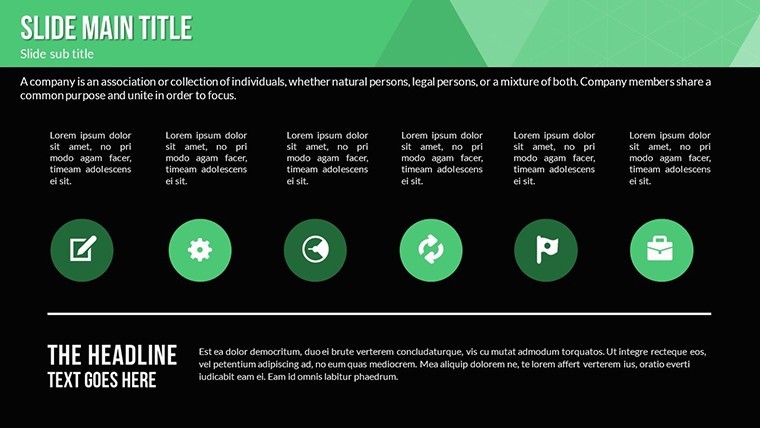
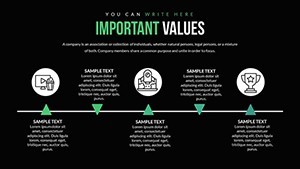
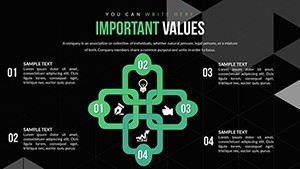
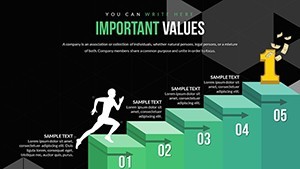
- Custom Animated Effects: Animate steps to simulate inspections, revealing data progressively for emphasis.
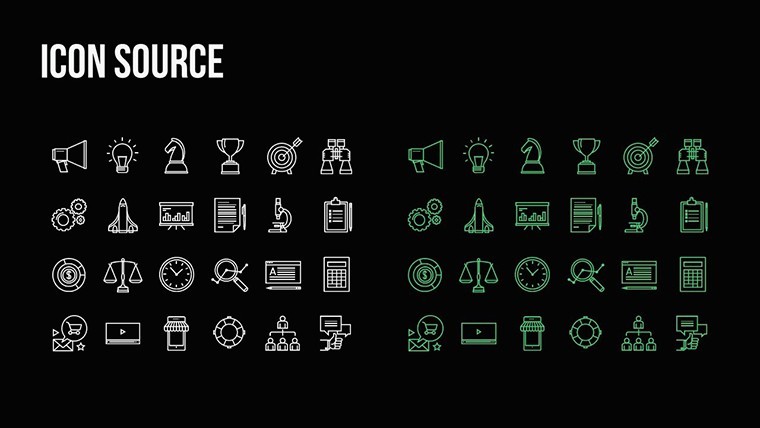
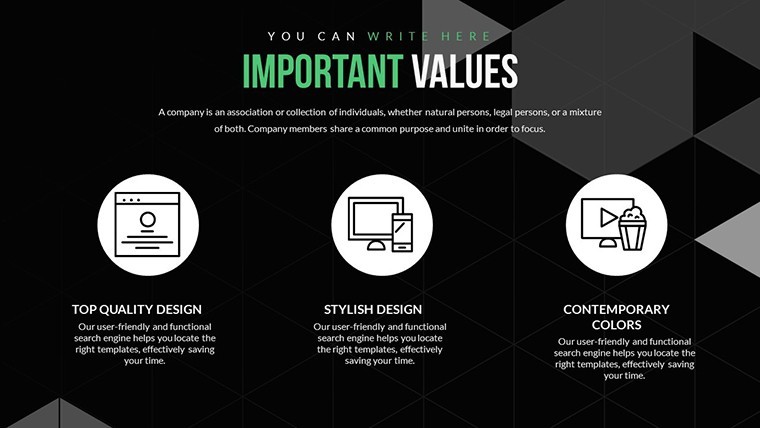
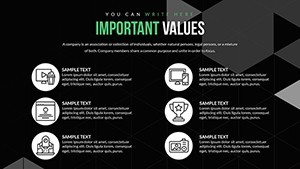
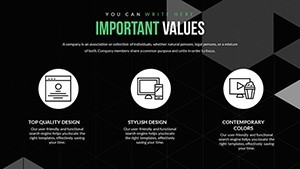
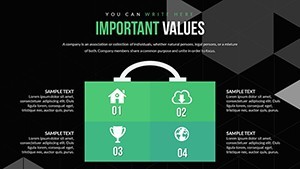
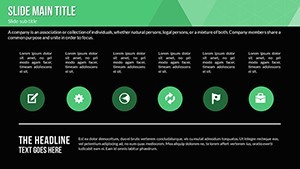
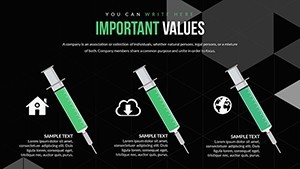
- Vector Icons and PNG Files: Icons for tools, warnings, and metrics, with PNGs for detailed overlays.
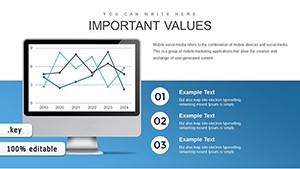
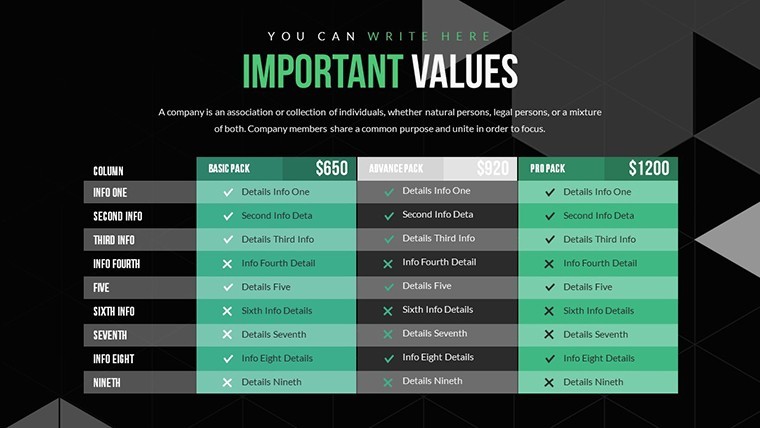
- Fully Editable Slides: Modify text, photos, and structures easily for tailored assessments.
Compatibility with Mac ensures reliability, aligning with standards from bodies like the American Society of Mechanical Engineers (ASME) for technical reporting.
Applied Scenarios: From Inspections to Insights
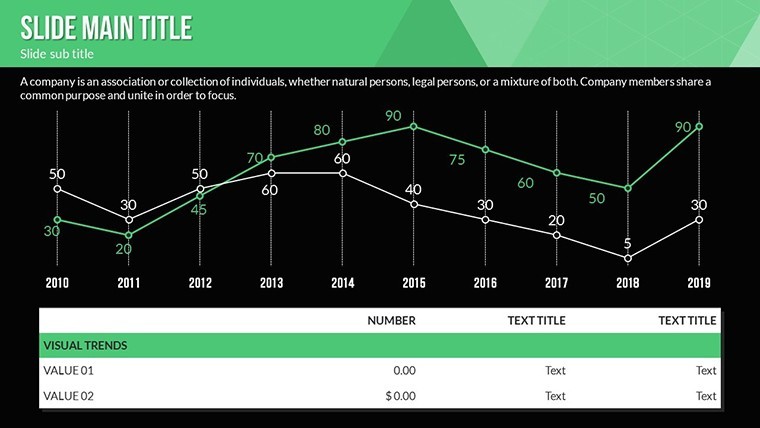
In manufacturing, map machinery wear processes; for civil engineering, visualize bridge condition assessments. A utility company, similar to those in ASCE reports, used process charts to streamline pipeline evaluations, reducing downtime by 15%.
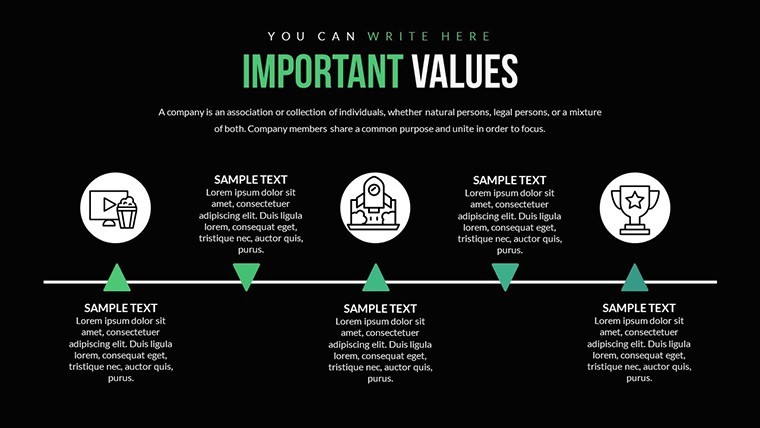
Step through a safety audit: Begin with input arrows, cycle through checks, and end with output recommendations. This mirrors ISO 55000 asset management standards, adding credibility to your presentations.
For R&D teams, animate innovation processes in technical prototypes, showing condition evolutions over time.
Expert Tips: Streamline Your Technical Workflows
Start with your assessment framework, then populate slides with real metrics from tools like AutoCAD or Excel.
- Download the .key file and launch in Keynote.
- Select process templates from the library.
- Customize with your data and colors.
- Incorporate animations for dynamic walkthroughs.
- Review and present for impactful delivery.
This outperforms basic charts by offering pre-animated processes, backed by 1136 ratings. CTAs like "Assess technically now" drive engagement subtly.
Reference authoritative sources like NIST guidelines on condition monitoring to bolster your content. Keep designs sparse for focus, avoiding information overload.
Overall, this template is a cornerstone for technical precision. Whether diagnosing issues or planning maintenances, it equips you to present processes with authority. Elevate your assessments - secure this template today.
Frequently Asked Questions
How flexible are the process charts?
Highly - rearrange steps, add nodes, or alter flows to suit your technical needs.
Can I integrate photos from inspections?
Yes, drag-and-drop images into slides for visual evidence.
Are animations customizable?
Completely; adjust timings and effects for precise simulations.
What if I need Mac-only features?
Optimized for Mac, with full support for iWork's advanced tools.
Does it support data imports?
Yes, paste from spreadsheets for quick metric integration.
How to expand for complex assessments?
Duplicate slides or link to external docs for depth.