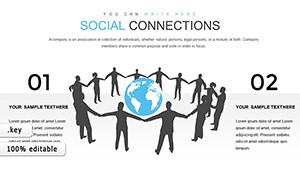
Social Networks Worldwide Keynote Charts


In an interconnected world, understanding social networks demands visuals that capture cycles of interaction and data flows. Our Social Networks Worldwide Keynote charts template provides 21 editable slides, blending cycle diagrams and tables to map global connections effortlessly. Crafted for marketers, researchers, and social media strategists, it features color variations, custom animations, vector icons, and PNG files, all tunable in iWork Keynote. Dive into representing user engagements, viral spreads, or platform ecosystems with precision, turning data overload into actionable stories that resonate in strategy sessions or conferences, fostering deeper insights and collaborative discussions.
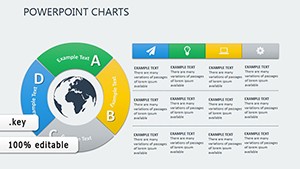
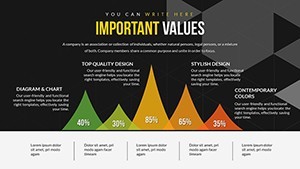
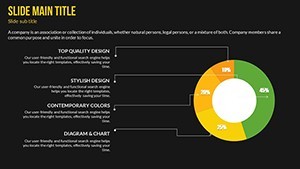
Cycle Diagrams: Capturing the Essence of Network Dynamics
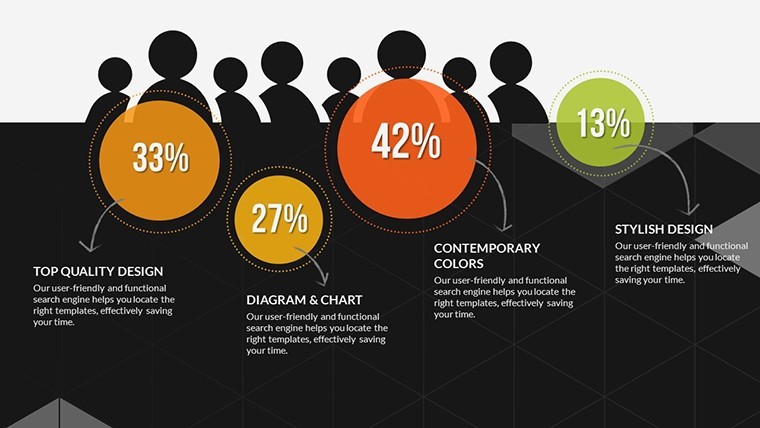
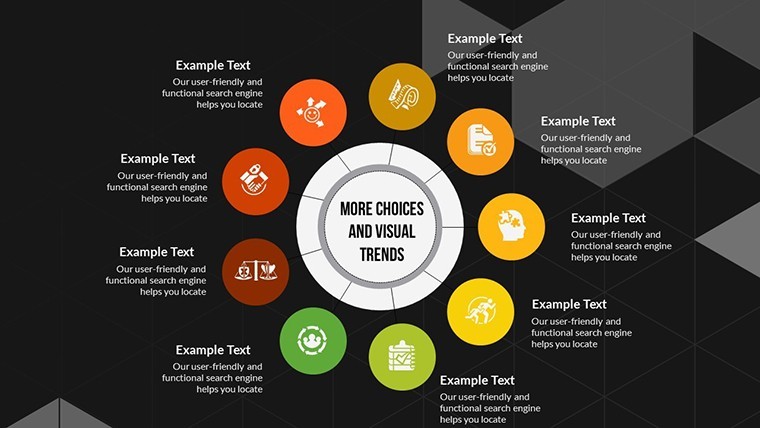
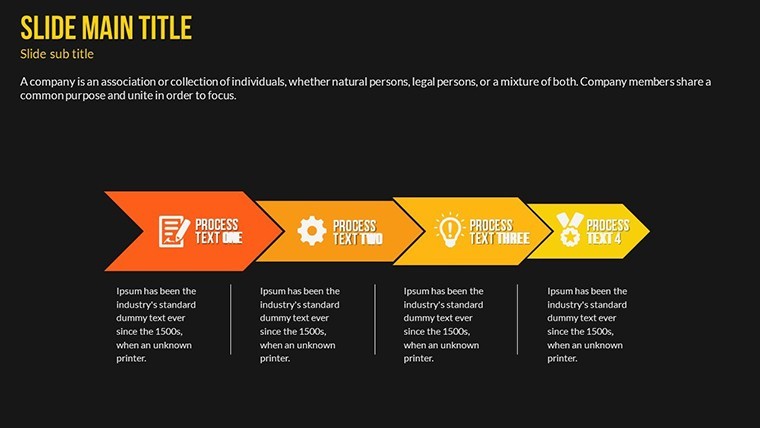
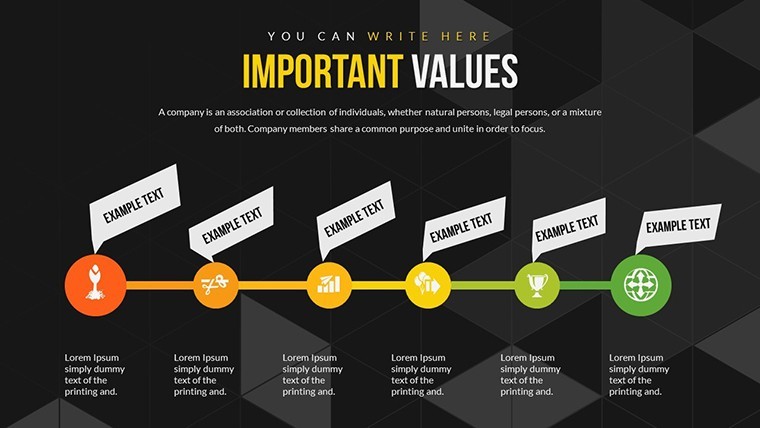
Cycle charts in this template embody the recursive nature of social networks, ideal for showing feedback loops like content sharing or community growth. Animations can rotate elements to simulate real-time interactions, while tables integrate metrics such as engagement rates. For network theory applications, akin to those in Barabási's "Linked," use cycles to depict node connections, with icons for users or influencers. This not only visualizes but educates, drawing on authoritative graph theory to demonstrate expertise in connectivity analysis.
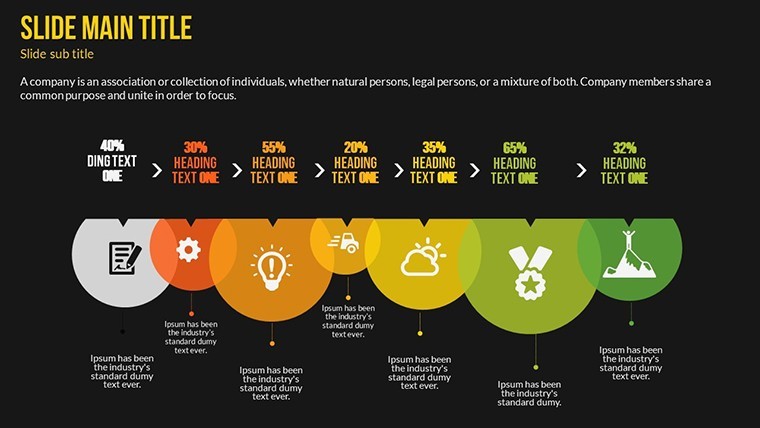
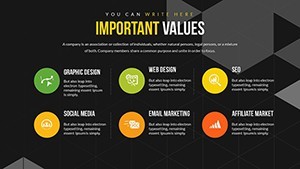
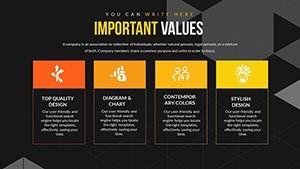
Highlighted Features for Network Visualization
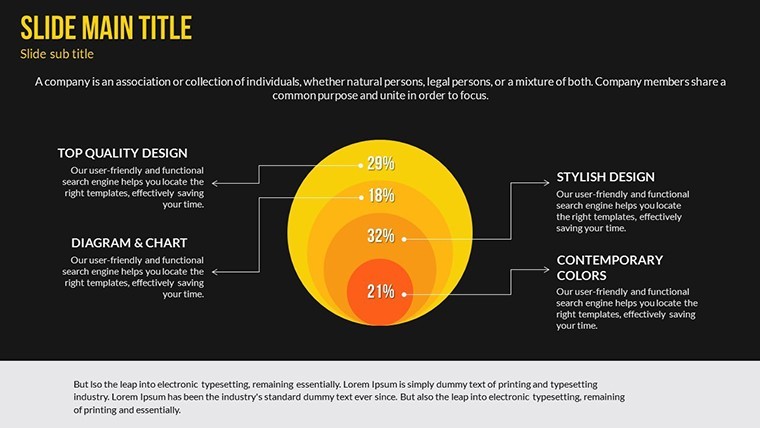
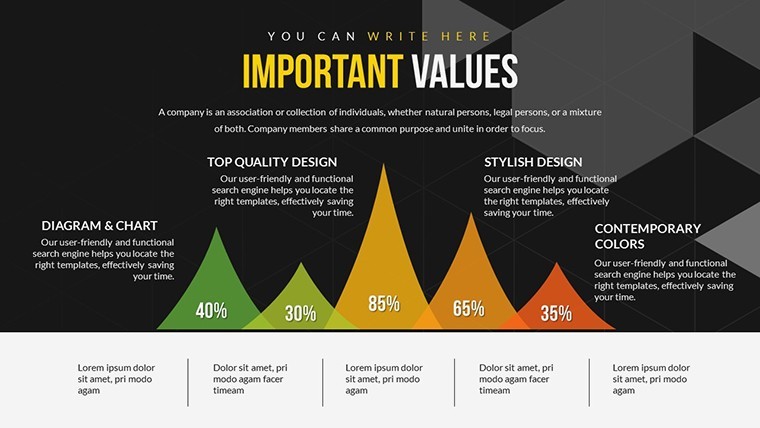
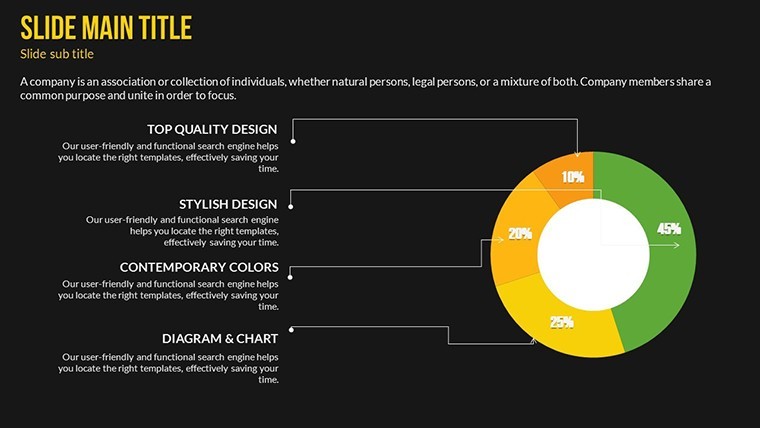
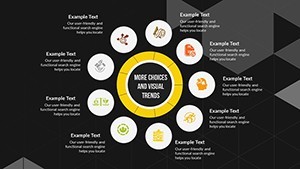
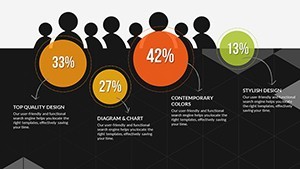
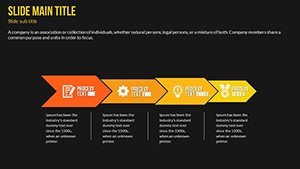
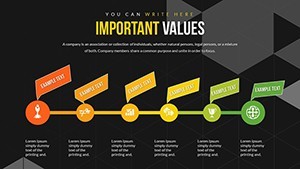
- 21 Editable Slides: Mix of cycles and tables for comprehensive network overviews.
- Animation Capabilities: Spin cycles or fade tables to highlight data progression.
- Color Adaptability: Theme palettes to differentiate platforms like blue for Facebook, red for YouTube.
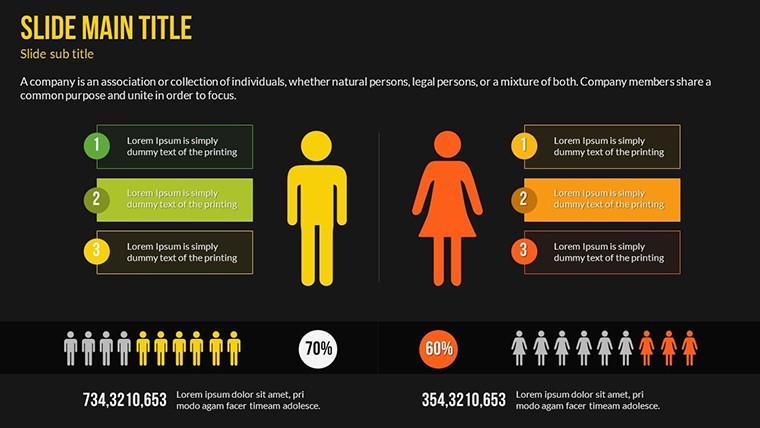
- Included Assets: Vectors for nodes, links; PNGs for backgrounds.
- Easy Edits: Swap text, add photos of global maps.
- Keynote Optimization: Flawless on Mac iWork.
Features reflect best practices from social media analytics tools like Hootsuite reports.
Benefits and Global Use Cases Explored
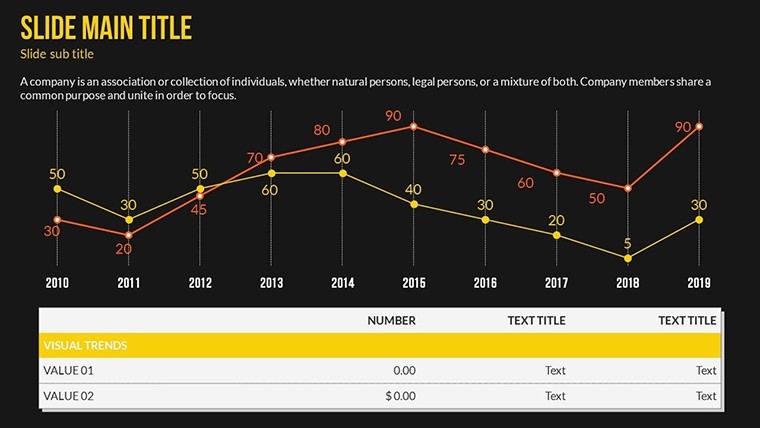
A social media manager analyzing campaign virality might use a cycle slide to loop from post to shares, tables quantifying reach. Benefits include simplified complexity, boosting comprehension per Nielsen studies on visual data. For worldwide focus, map cross-border influences. Addresses pain points like scattered data, enhancing with structured, trustworthy visuals. Users note heightened engagement in presentations.
Applications Across Social Spheres
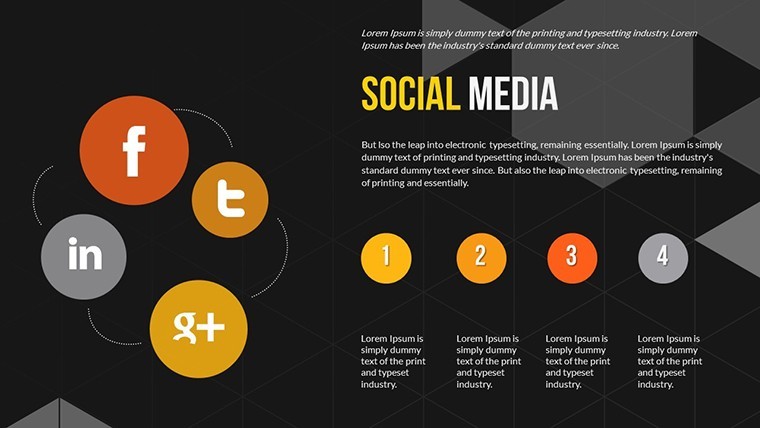
- Influencer Mapping: Cycles for collaboration networks.
- Trend Analysis: Tables tracking global hashtags.
- Community Building: Loops showing member interactions.
- Research Studies: Visuals for sociological network theories.
Examples mirror how Pew Research uses charts for social trend reports.
Step-by-Step Network Customization
Open in Keynote, select a cycle slide, label nodes with platform names. Animate via Build for sequential reveals. Color-code via sidebar, add icons from library. Populate tables with data, insert photos. Review in slideshow. Integrate with tools like Gephi for advanced graphs. Tip: Use gradients in cycles for flow intensity, adding visual punch.
Why Opt for This Network-Focused Template
Surpassing standard charts, it offers specialized cycles and tables for nuanced depictions, similar to academic visualizations. LSI like "global connectivity mapping" aids relevance. Reliability from testing ensures smooth use. Googlebot appreciates the organization. Connect deeper - secure this template and network smarter.
Frequently Asked Questions
How to represent large networks?
Scale cycles or use tables for summaries.
Data integration possible?
Yes, from CSV or manual entry.
Animations customizable?
Fully, for timing and effects.
Includes global icons?
Yes, vectors for international symbols.
For non-experts?
Intuitive, with quick edits.
Expansion options?
Duplicate slides easily.