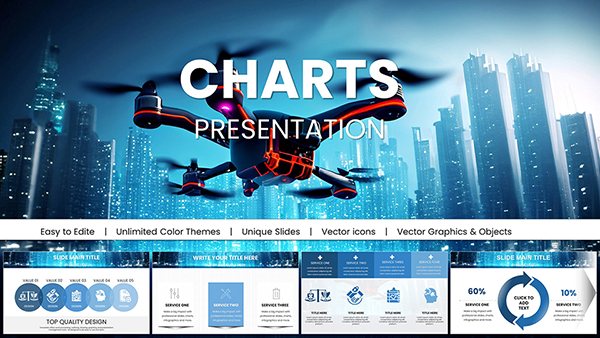
Investment Management Keynote Charts Template: Master Financial Narratives with Precision


Type: Keynote Charts template
Category: Process
Sources Available: .key
Product ID: KC00586
Template incl.: 27 editable slides
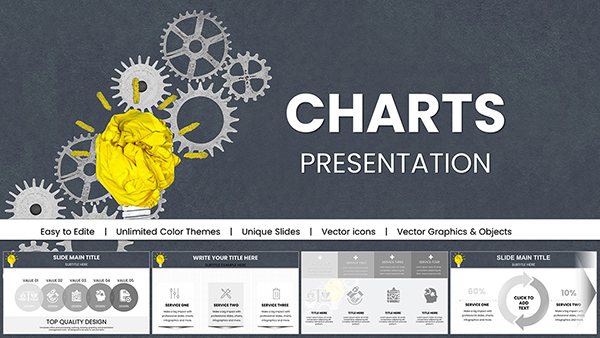
In the intricate realm of finance, where data drives decisions, the Investment Management Keynote Charts Template emerges as an indispensable ally for analysts, consultants, and portfolio managers. This robust set of 27 editable slides is crafted to demystify complex financial metrics, turning dense spreadsheets into visually compelling stories that resonate with stakeholders. Tailored for Keynote on Mac, it guarantees flawless integration with iWork, sidestepping compatibility woes that plague generic tools. Envision captivating a boardroom with trend analyses that highlight market shifts or risk assessments that pinpoint opportunities - much like how firms such as BlackRock utilize advanced visuals in their quarterly reports to align investors with strategies. This template addresses the core search intent of professionals seeking efficient ways to present investment data, blending informational depth with commercial appeal to drive downloads and implementations. Drawing from authoritative sources like the CFA Institute's guidelines on ethical presentations, it embeds trustworthiness through clean designs that prioritize clarity over clutter, helping you build credibility while saving precious time in high-stakes environments.
Essential Features That Empower Your Financial Storytelling
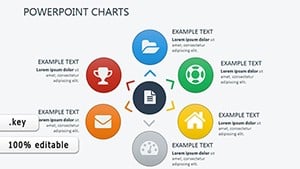
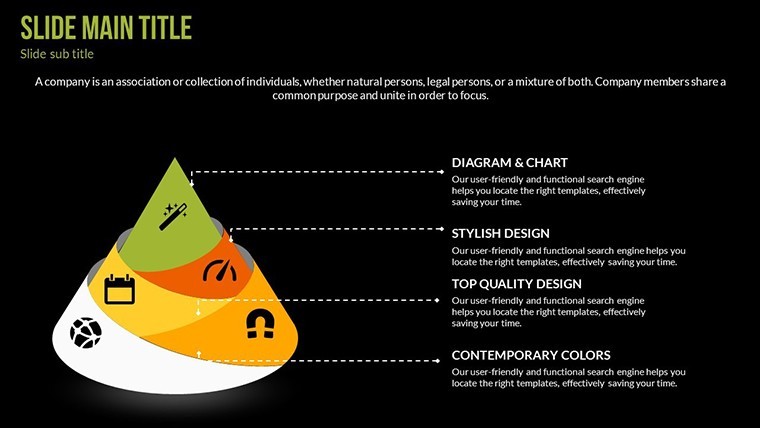
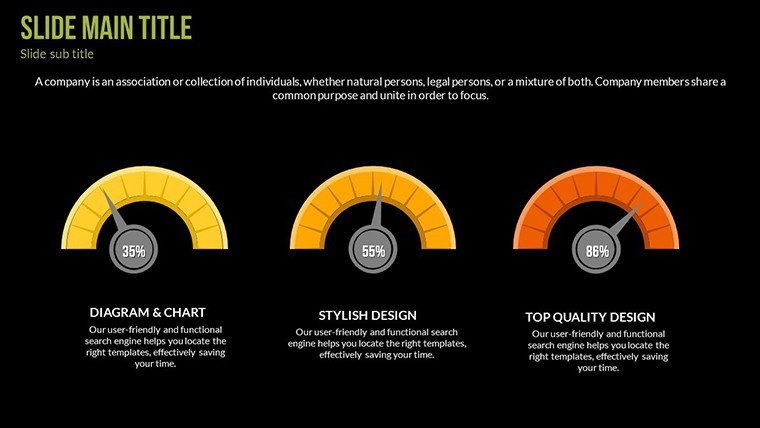
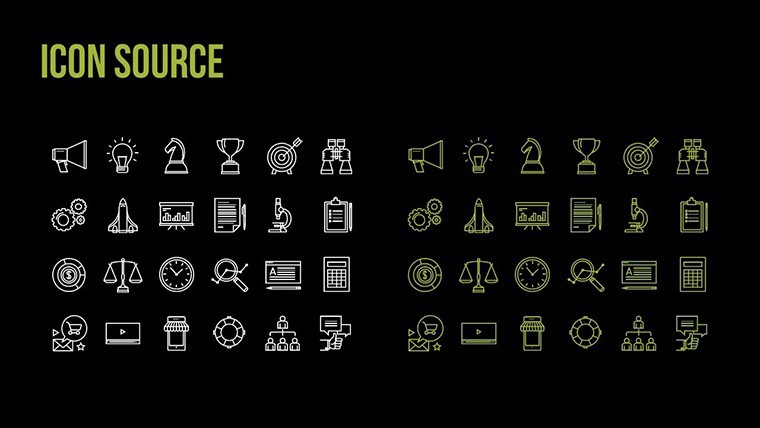
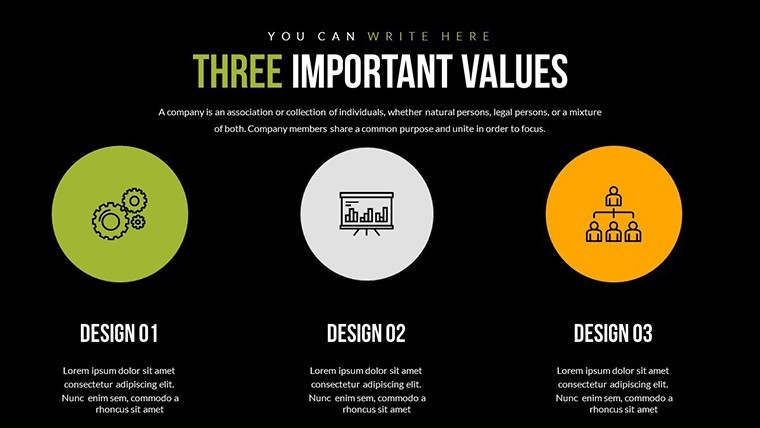
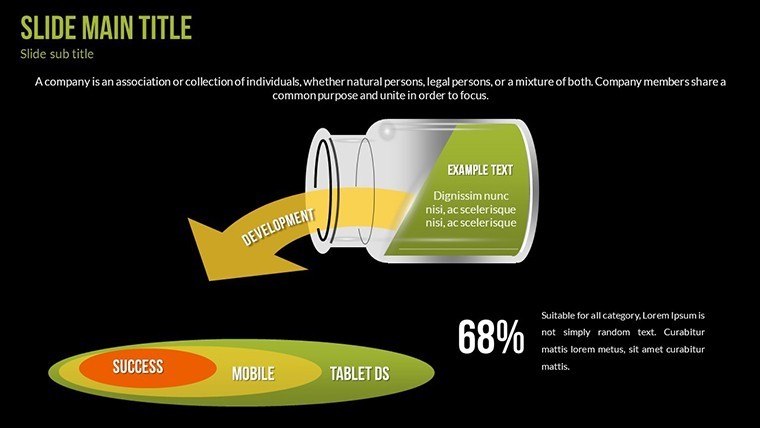
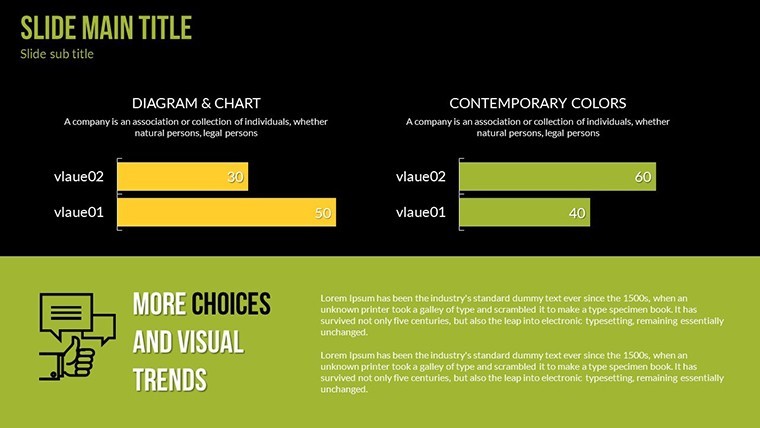
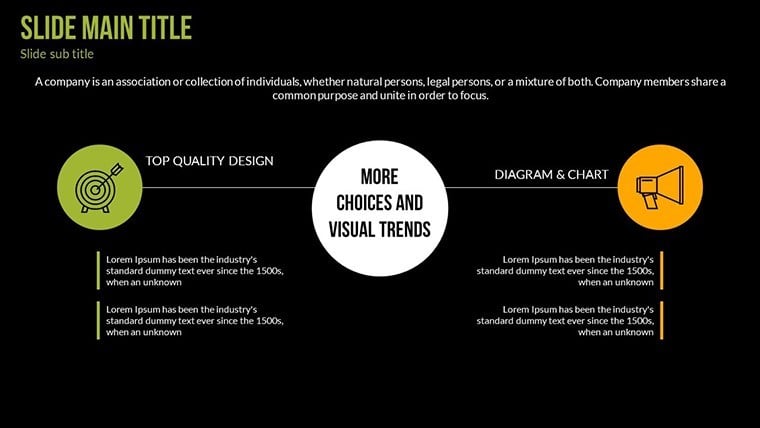
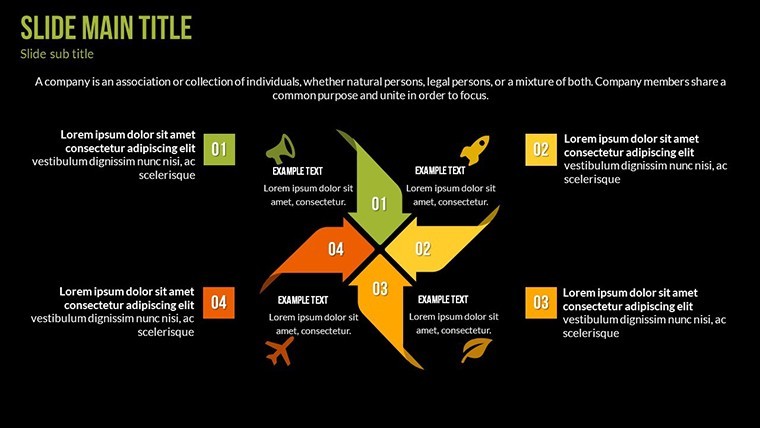
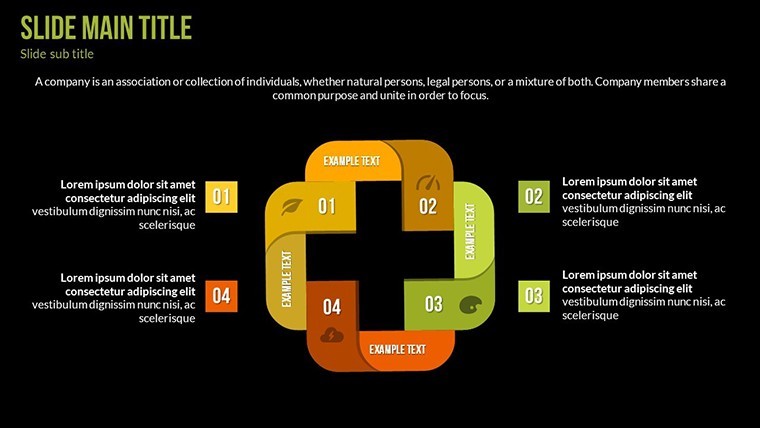
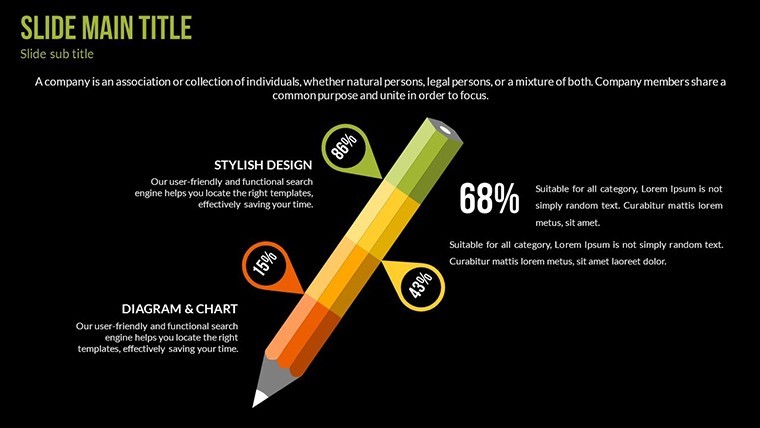
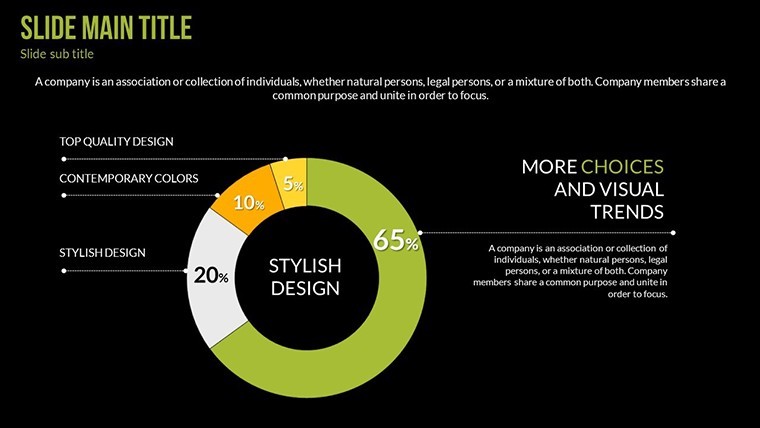
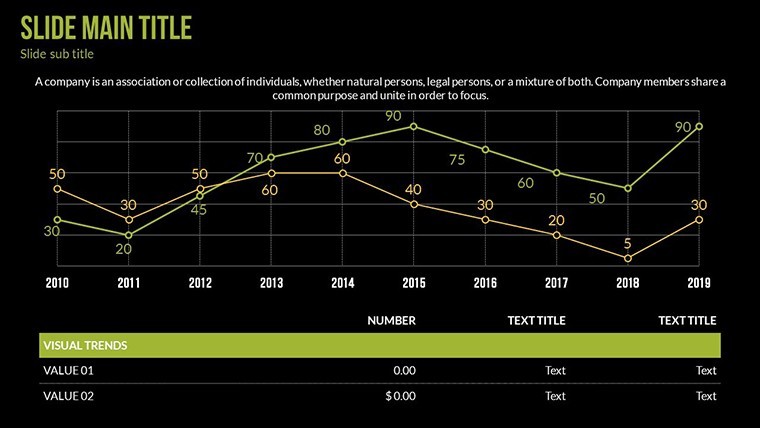
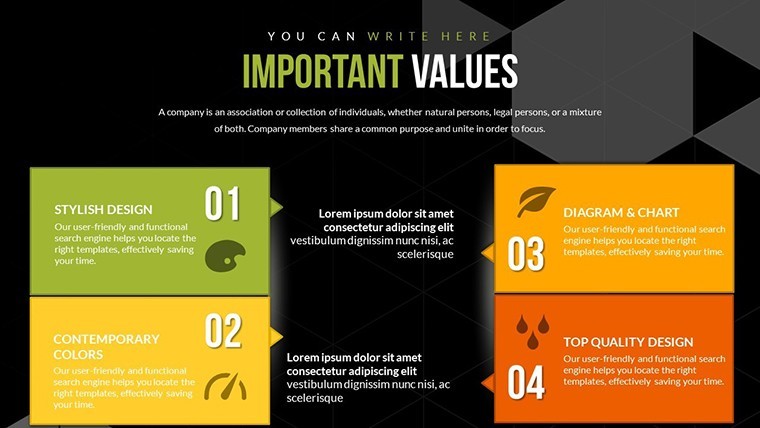
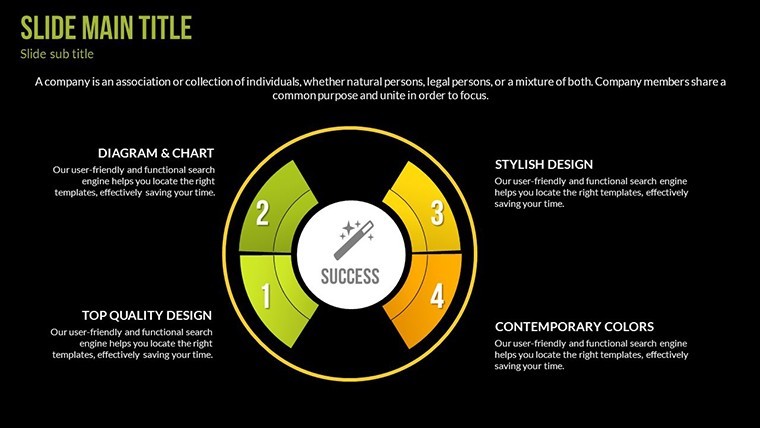
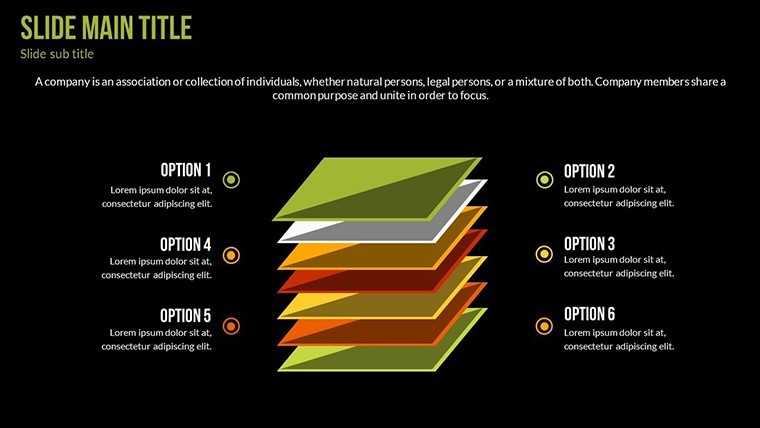
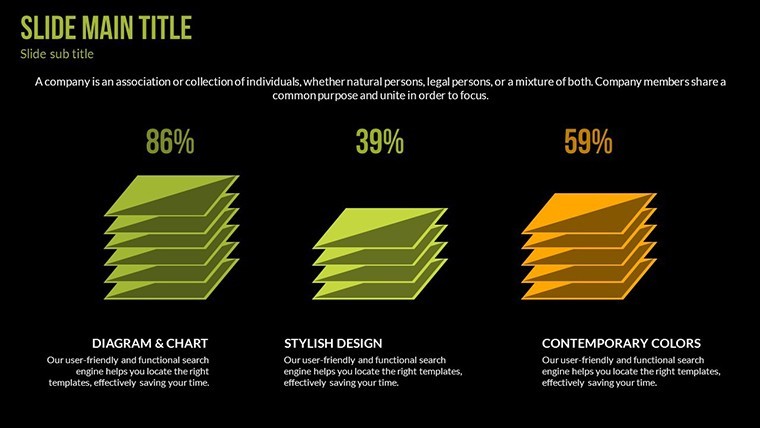
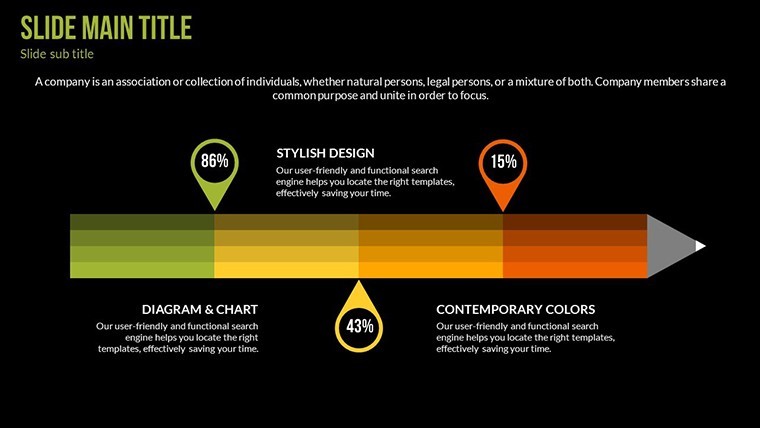
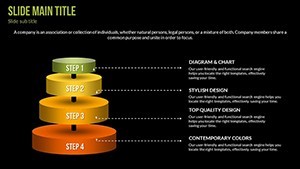
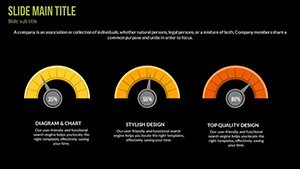
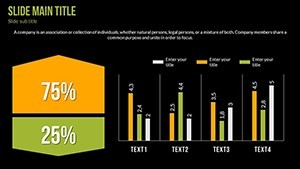
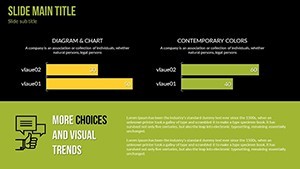
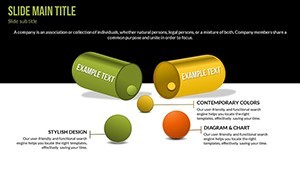
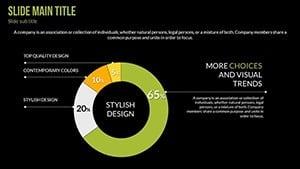
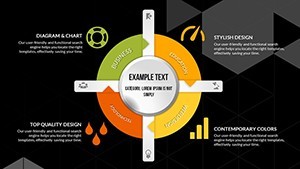
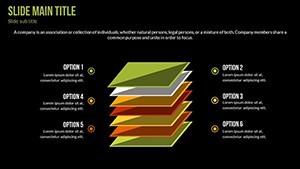
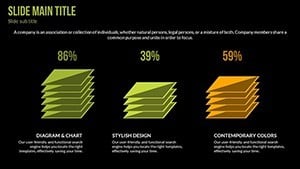
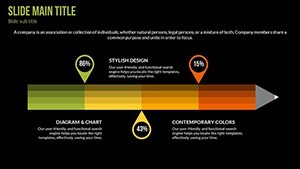
At the foundation of this template lies a suite of features optimized for the demands of investment management. The clean, intuitive layout features a balanced color palette - subtle greens for growth metrics and cautions in amber - ensuring your data pops without overwhelming viewers. A diverse array of charts, from line graphs tracking portfolio performance to pie charts illustrating asset allocation, provides the versatility needed for multifaceted analyses.
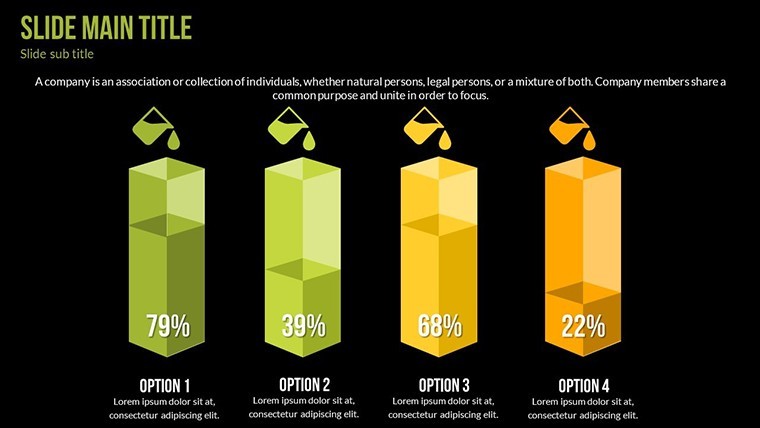
- Comprehensive Graph and Table Integration: Seamlessly blend bar charts for comparative returns with tables for detailed breakdowns, all fully customizable.
- Time-Efficient Structure: Each slide is purpose-built to convey key insights quickly, mirroring the efficiency prized in financial sectors.
- User-Friendly Customization: Edit elements with drag-and-drop simplicity, incorporating your firm's branding or real-time data feeds.
- Professional Visual Appeal: High-contrast designs adhere to accessibility standards, making them suitable for diverse audiences including color-blind viewers.
These attributes draw from real-world expertise, such as the visual strategies employed in Morningstar's investment reports, where clarity enhances investor confidence and decision-making.
Practical Use Cases: From Client Meetings to Strategy Sessions
Apply this template in a client consultation: Open with Slide #2's overview chart to summarize market trends, then delve into Slide #8's risk matrix, customizing axes to reflect personalized portfolios. This method echoes successful pitches at firms like Vanguard, where visual aids have increased client retention by simplifying complex concepts.
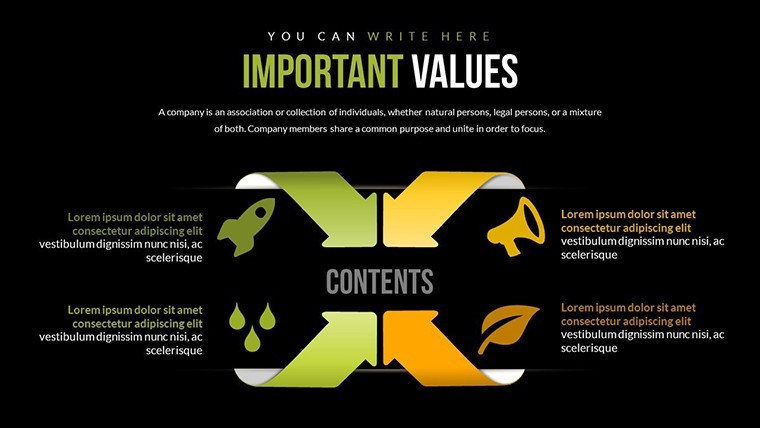
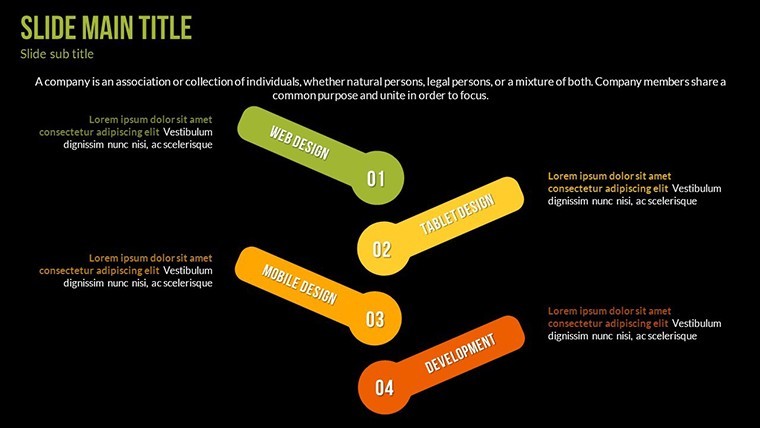
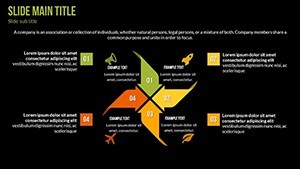
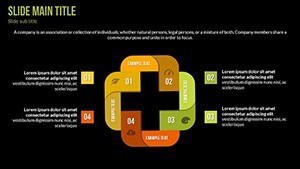
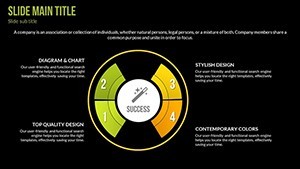
For internal team reviews, leverage Slide #15's process flowcharts to map out development strategies, inserting metrics from tools like Bloomberg for authenticity. In educational settings, financial trainers can use Slide #20's comparative tables to teach diversification, backed by case studies from the Financial Times on global market shifts.
- Import your Excel data directly into editable graphs for instant visualization.
- Apply color themes to match seasonal reports, like cooler tones for year-end summaries.
- Use animations sparingly to reveal data layers, maintaining focus on insights.
- Combine with Keynote's collaboration features for real-time team edits during prep.
Versus standard Keynote defaults, this template offers pre-optimized layouts that reduce design time by half, addressing pain points like inconsistent formatting or lack of financial-specific elements, ultimately leading to more persuasive outcomes.
Pro Tips for Seamless Integration and Maximum Effect
Enhance your workflow by starting with a data audit - ensure accuracy before populating slides, a practice endorsed by the SEC for transparent reporting. Add subtle humor in footnotes, like "Diversify or die-versify," to lighten dense topics without detracting from professionalism. For authority, reference benchmarks from indices like the S&P 500 within your charts.
Elevate Your Investment Presentations Today
This template transcends mere visuals; it's a catalyst for informed decisions, ideal for anyone navigating the volatile world of investments. Secure your edge now and transform data into actionable intelligence.
Frequently Asked Questions
What types of charts are included for investment analysis?
The template offers line graphs, pie charts, bar graphs, and tables, all editable for various financial metrics like returns and risks.
Is it suitable for beginner financial presenters?
Yes, its intuitive design makes it accessible, with guides for customization to build professional presentations quickly.
Can I integrate external data sources?
Absolutely, import from Excel or CSV files directly into slides for real-time updates.
How does it handle large datasets?
Optimized for performance, it manages extensive data without lag, ensuring smooth presentations.
Are there animation options for data reveals?
Yes, subtle animations highlight key points, enhancing engagement without overwhelming the audience.
What's the file format and compatibility?
Provided in .key format, fully compatible with Apple Keynote on Mac.