Elevate Data Storytelling with Data Information Keynote Charts Template


Type: Keynote Charts template
Category: Tables
Sources Available: .key
Product ID: KC00584
Template incl.: 16 editable slides
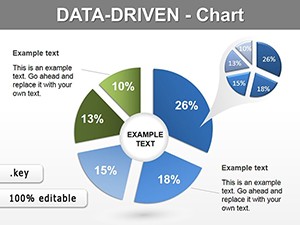
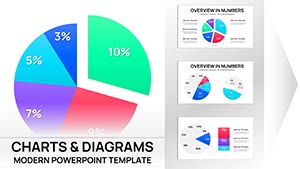
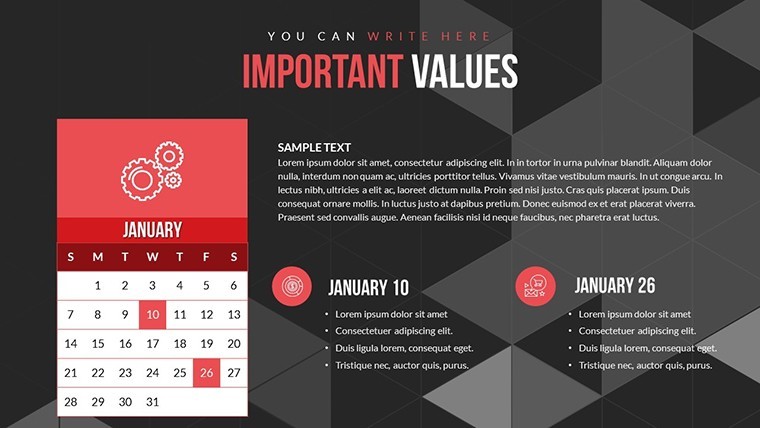
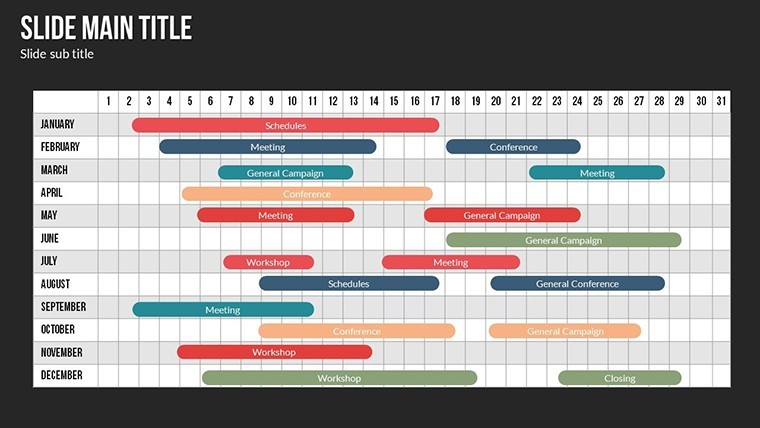
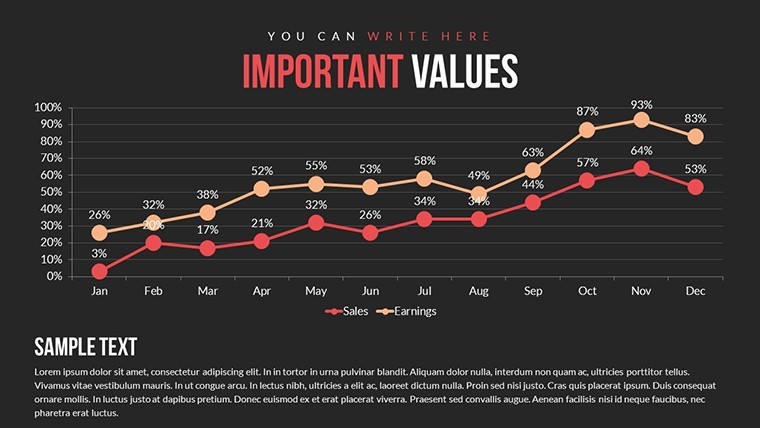
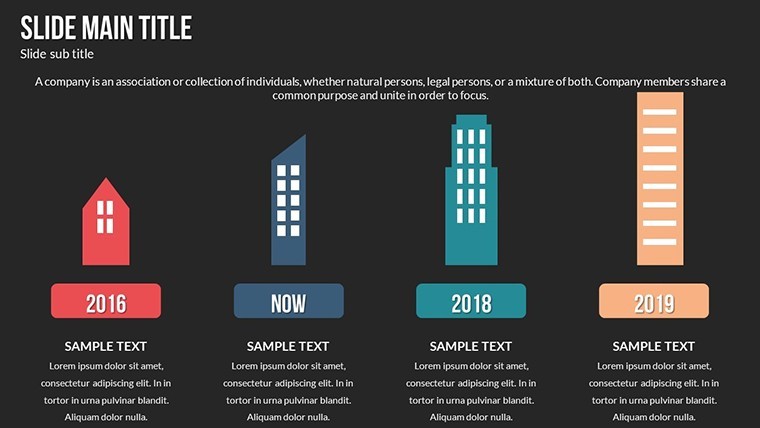
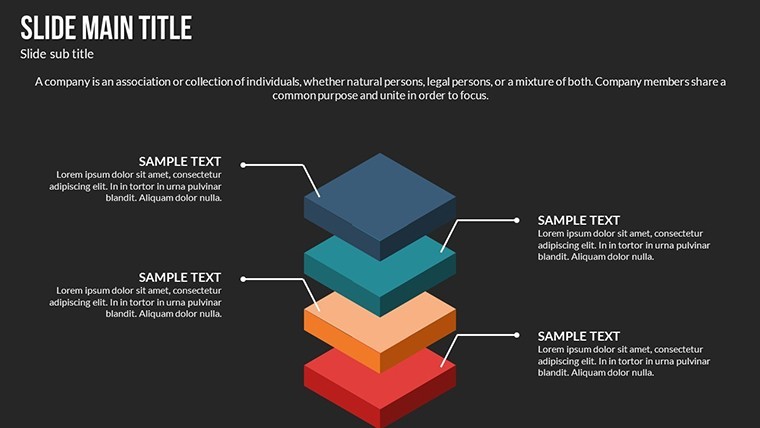
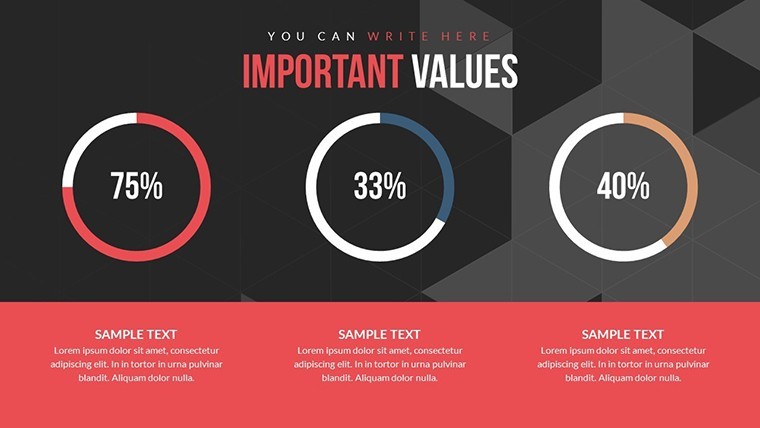
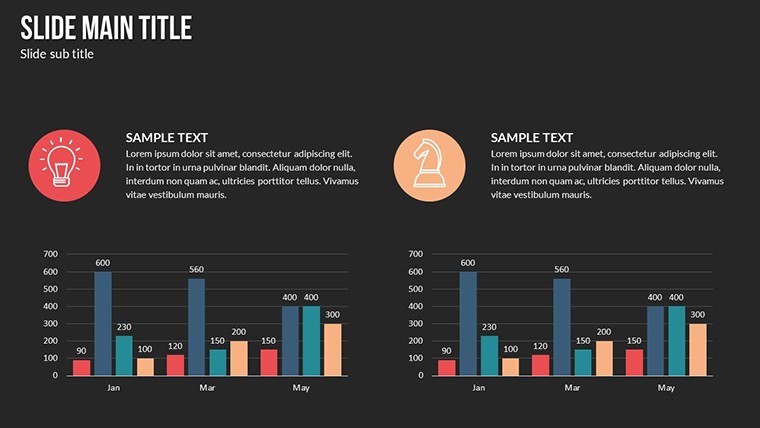
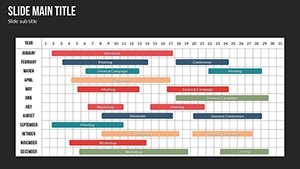
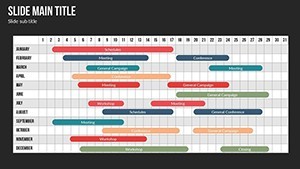
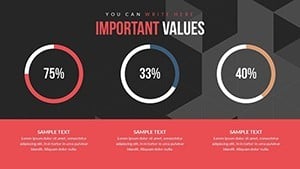
Data is everywhere, but turning it into actionable insights requires the right tools. The Data Information Keynote Charts Template provides 16 editable slides optimized for Keynote on Mac, offering a suite of charts to visualize sales, trends, and findings with stunning clarity.
Targeted at executives analyzing market data or educators explaining concepts, this template leverages design best practices from sources like Tableau's visualization guidelines, ensuring your presentations are both informative and engaging.
Core Features for Data-Driven Success
Customization is at the heart, with options to tweak every element for brand alignment.
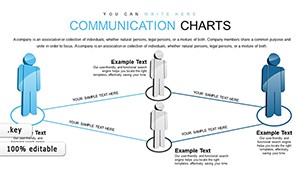
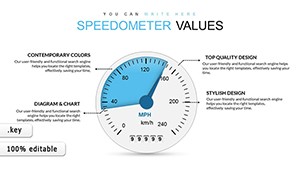
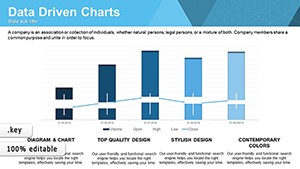
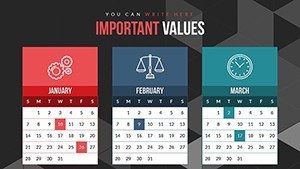
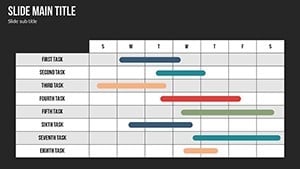
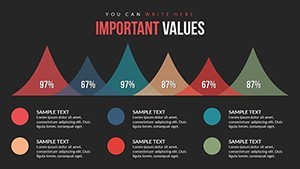
- Varied Chart Styles: From line graphs for trends to scatter plots for correlations.
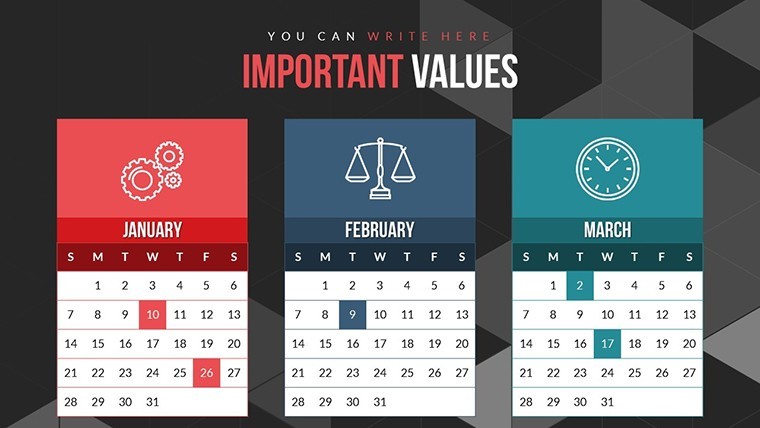
- Color and Font Flexibility: Match your theme for cohesive looks.
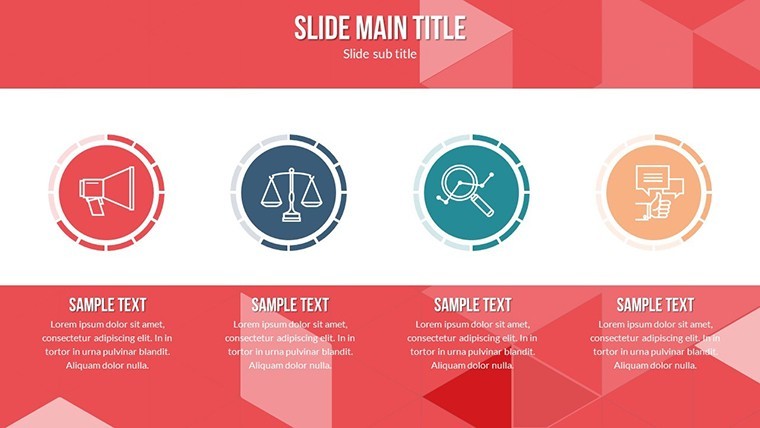
- Layout Versatility: Adapt slides for different data complexities.
Superior to basic options, it includes professional touches like gradient fills. A marketer used it for campaign recaps, boosting stakeholder buy-in per industry benchmarks.
Comprehensive Slide Overview
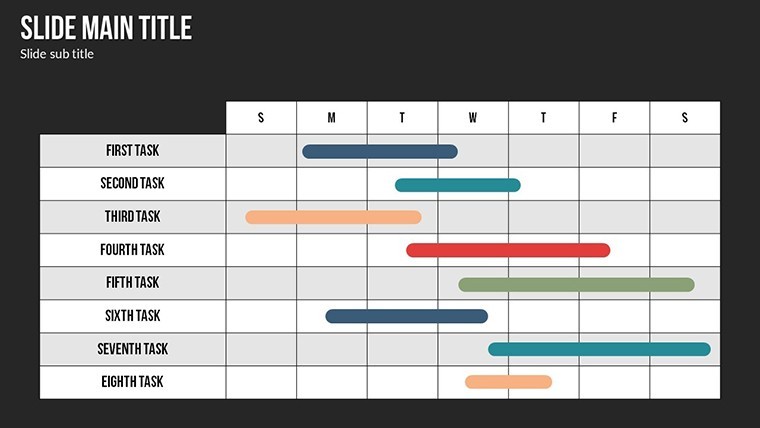
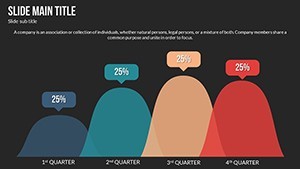
Slides 1-4 handle overviews with dashboard composites. 5-10 focus on specifics like pie distributions. 11-16 cover advanced viz like heat maps.
Use Cases Across Sectors
For analysts, chart financials; for teachers, illustrate stats.
- Business Reports: Present KPIs vividly.
- Educational Tools: Teach data literacy.
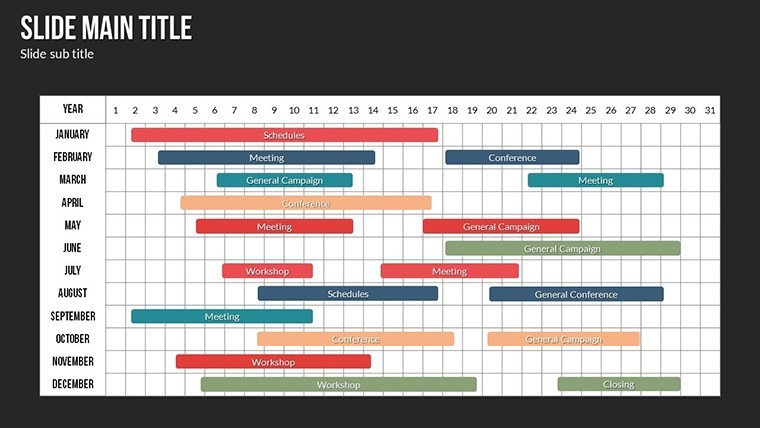
- Research Summaries: Visualize findings.
Integrate with tools like Excel. Tip: Use contrasts for readability.
Tips from Data Experts
Focus on narratives; avoid overload. A firm saw 15% better decisions with visualized data.
Unlock Your Data Potential
Dependable for Keynote users, this template is your key to impactful visuals.
Start visualizing better - download and customize immediately.
Frequently Asked Questions
How to customize charts?
Edit data, colors, and layouts easily in Keynote.
Suitable for educators?
Yes, perfect for lessons and lectures.
What charts are featured?
A range including bars, lines, and pies.
Can I export slides?
Yes, to PDF or other formats.
Is branding easy?
Absolutely, with full customization.