Processes of Impact Charts - Fully Editable


Type: Keynote Charts template
Category: Analysis
Sources Available: .key
Product ID: KC00582
Template incl.: 34 editable slides
Package Contents
34 editable slides arrive in the download for immediate use in Keynote.
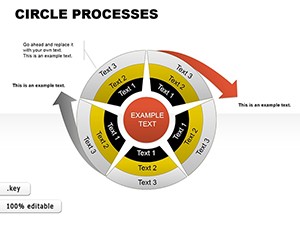
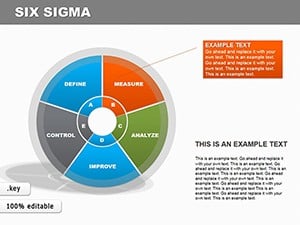
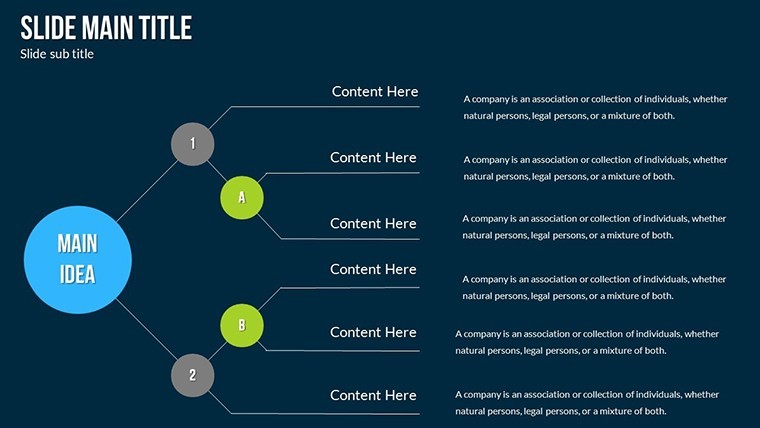
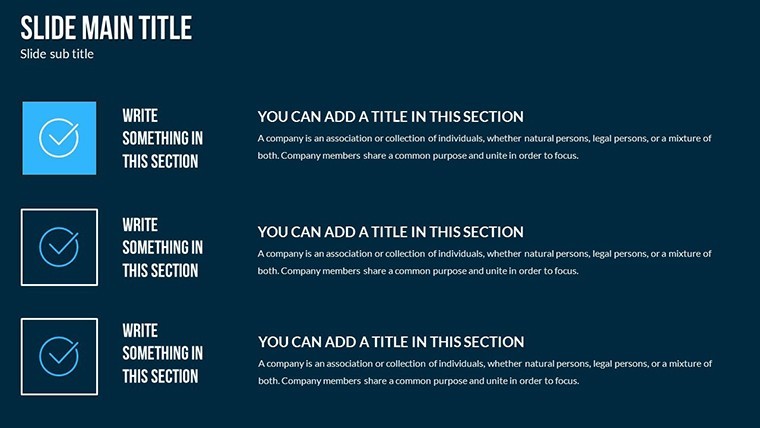
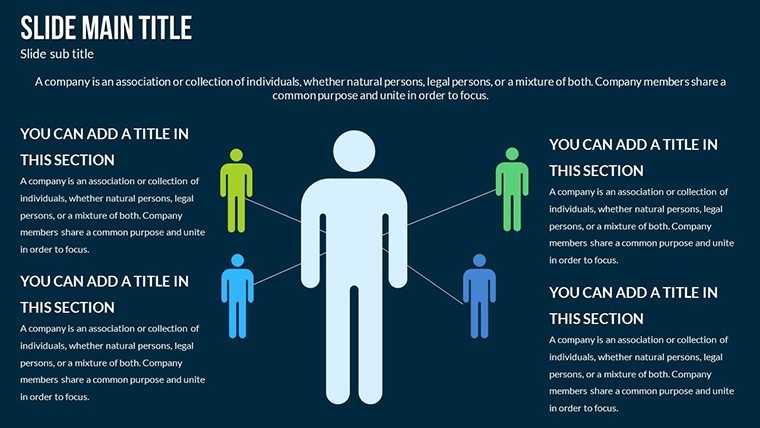
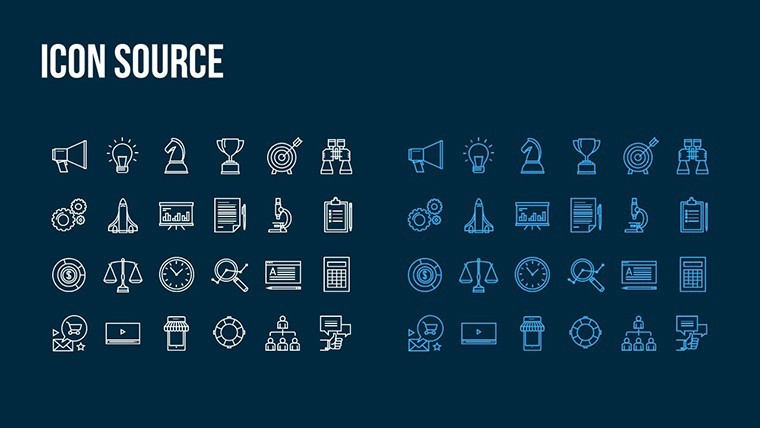
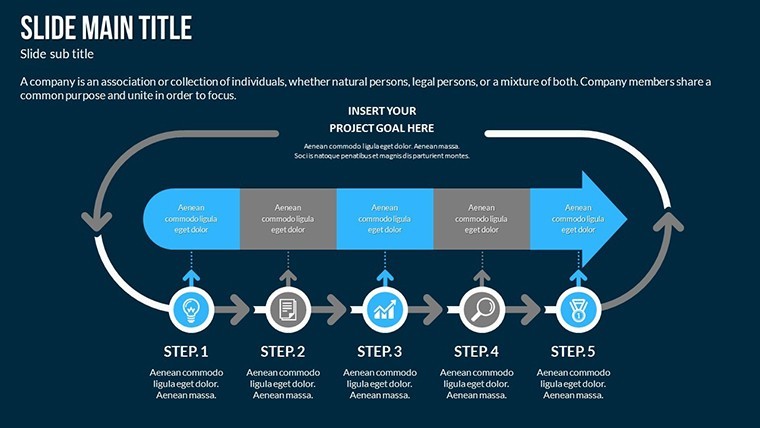
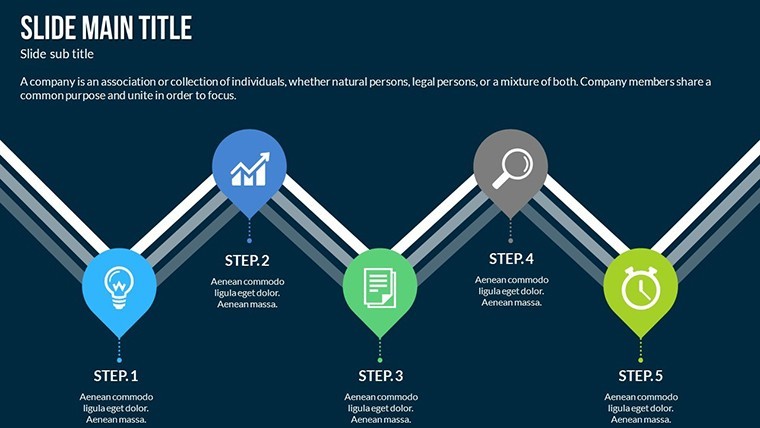
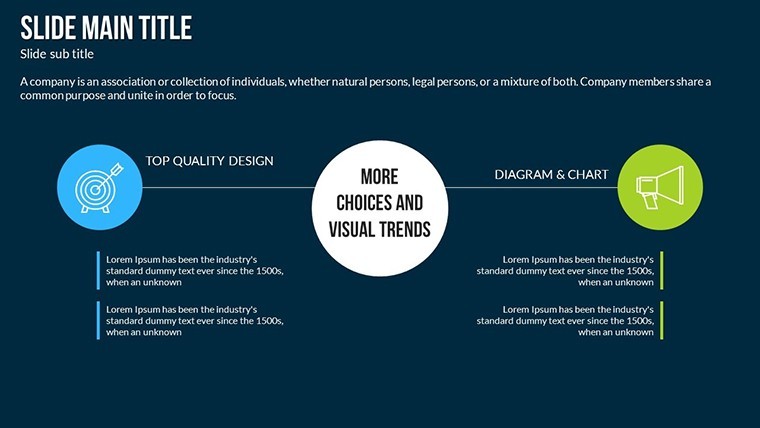
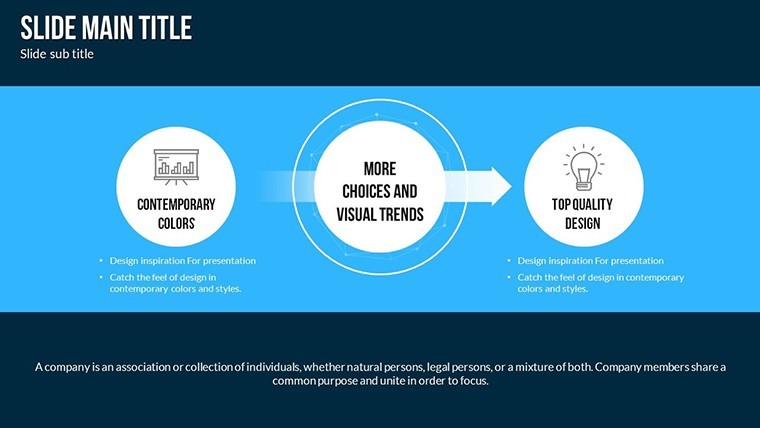
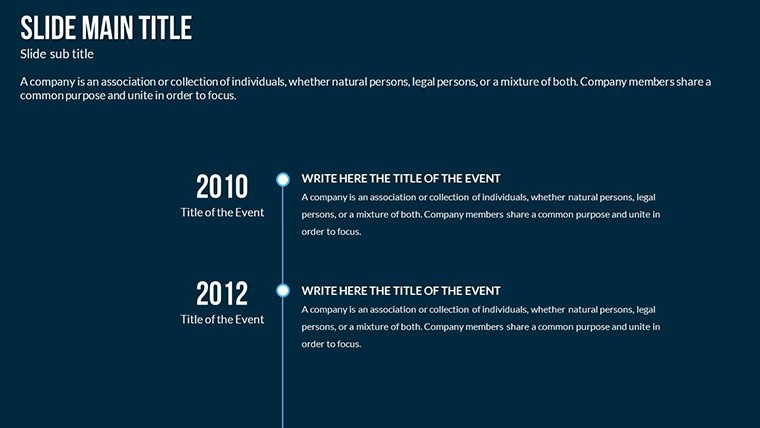
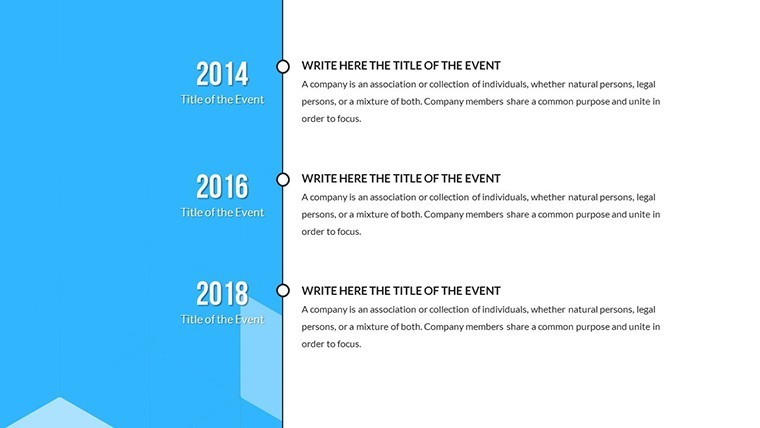
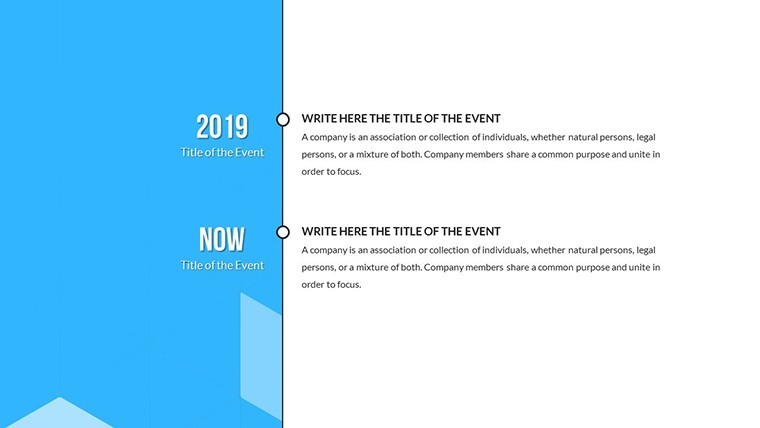
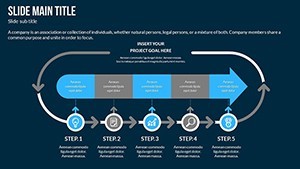
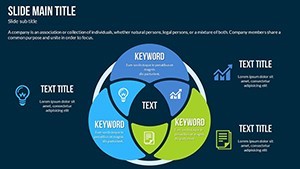
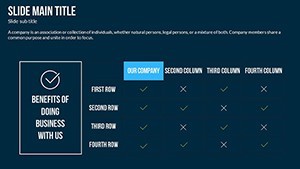
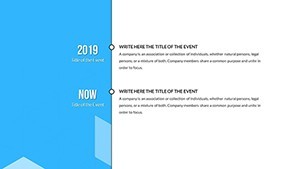
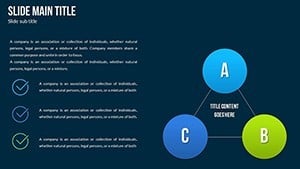
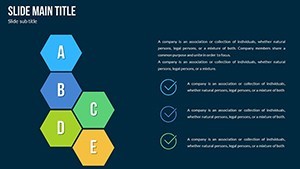
Input-to-outcome diagrams connect with vector icons to cover cause-and-effect chains across social environmental and business contexts.
These flow diagrams highlight ripple effects in ways that single-chain layouts cannot match when multiple stakeholders need accountability details. Policy teams select them for UNDP-aligned evaluations that turn evaluations into stories because the paid download supplies custom animations and vector icons missing from previews.
Key Specifications
| Feature | Details |
|---|---|
| Slides included | 34 with cause-and-effect chains |
| Diagram categories | input-to-outcome flows and ripple mapping |
| Editable elements | text labels icon fills arrow directions color themes |
| Aspect ratio | 16:9 standard |
| Keynote compatibility | version 12 and newer |
| Color themes | variations for social or business contexts |
| Animation support | custom animations on flows |
Program managers in nonprofits prepare impact reports for funders and cut deck preparation from 3 hours to 45 minutes by swapping icon sets.
Policy makers in government agencies build stakeholder presentations during board briefings and reuse the file across three reports by adjusting color schemes.
Download the file now and start mapping your next impact analysis.
Customization in 4 Steps
The workflow takes moderate skill and under 15 minutes for most users.
- Open the .key file in Keynote and replace placeholder text labels (3 minutes)
- Adjust brand colors via the slide master palette (2 minutes)
- Edit diagram connectors and arrow weights for flow direction (4 minutes)
- Export as PDF for distribution or keep in Keynote (1 minute)
Why This Template, Not a Blank Slide
Building cause-and-effect diagrams from scratch requires hours and risks inconsistent line weights that fail on projection screens.
Labels sit outside shapes here to maintain readability during live meetings while connectors adjust easily.
Flow direction from left to right follows standard reading patterns and avoids the common error of overcrowded internal labels.
Get the Keynote file and present your impact data with clarity today.
Does this open in my version of Keynote?
The file opens in Keynote 12 and newer versions on Mac. Older versions may require an update to access all animations. Users on Keynote 10 reported partial compatibility with vector icons. Test the preview if your version differs to confirm full support before purchase.
How do I change the color scheme?
Select any shape or icon then open the format pane on the right. Choose a new fill color from the palette and it updates across matching elements automatically. Repeat for text labels and connectors. The slide master holds the primary theme for quick global swaps.
What does the license permit?
The license allows use in client work and internal presentations. Resale or sublicensing of the original file remains prohibited. You may modify and distribute derivative decks freely. Commercial projects count as permitted use.
What does the paid version include that the free version does not?
The paid download supplies the complete 34-slide Keynote file with custom animations and vector icons. Free previews show only static images. Full editable shapes and flow connectors appear only after purchase. Animation triggers activate exclusively in the paid set.
What file formats and software are required?
The download contains a single .key file. Keynote version 12 or newer opens it directly. Export options include PDF for sharing or images for reports. No additional software beyond Keynote is needed.
What is the refund policy?
Refunds are granted within 14 days if the file does not open in your Keynote version as expected. Contact support with the purchase receipt and version details. Approved refunds process within 48 hours. The policy covers compatibility issues only.