Analytical Thinking Keynote Charts


Type: Keynote Charts template
Category: Analysis
Sources Available: .key
Product ID: KC00576
Template incl.: 19 editable slides
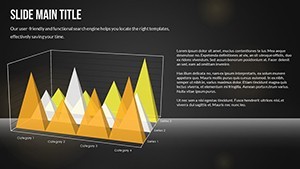
Unlock the power of analytical thinking with visuals that cut through the noise. Our Analytical Thinking Keynote charts template, boasting 19 editable slides, is crafted for thinkers and leaders who thrive on data. Focused on analysis categories, it's perfect for researchers, marketers, and executives dissecting trends or solving problems. These charts help you map out thoughts, from cause-effect diagrams to trend lines, all with vibrant colors, animations, vector icons, and PNG files. Fully compatible with iWork Keynote, customization is a breeze - tweak everything to fit your unique perspective. Whether unraveling market dynamics or brainstorming innovations, this template turns analysis into an art form, helping you present with confidence and conviction.
Standout Features for Deeper Analysis
Delve into features that amplify your analytical edge. Each slide supports rigorous examination, with designs informed by cognitive science principles for better information retention.
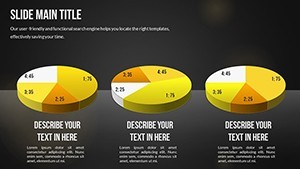
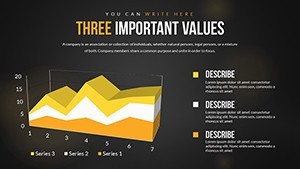
- Color Variations for Insight: Use hues to differentiate data sets, like blues for calm analysis or reds for alerts.
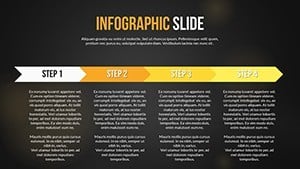
- Animated Revelations: Sequence animations to build arguments logically, mirroring analytical processes.
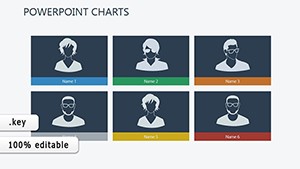
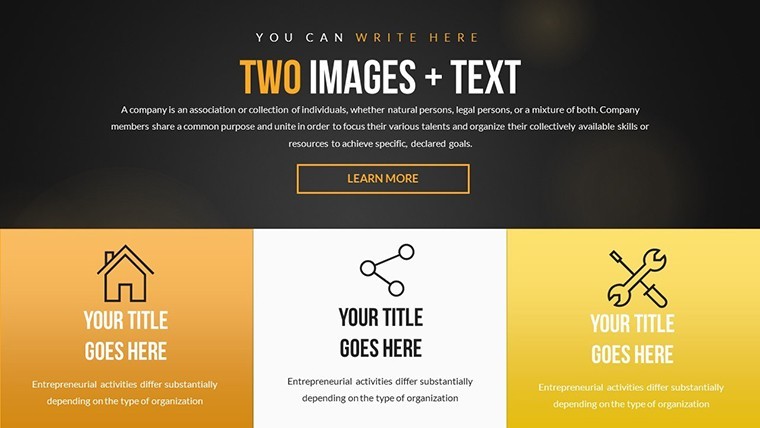
- Icon Library: Vector icons symbolize concepts, enhancing abstract analytical ideas.
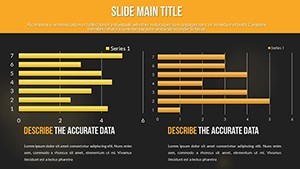
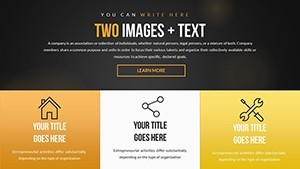
- Editability at Core: Reshape charts, text, and images for precise tailoring.
Backed by insights from thinkers like Daniel Kahneman, these tools promote systematic, error-free analysis.
Applying Analysis in Diverse Contexts
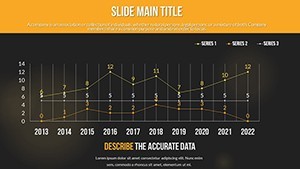
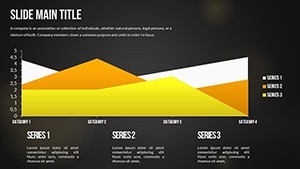
Harness this template for impactful applications. In marketing, analyze consumer behavior with trend charts, animating shifts to spotlight opportunities, akin to how Nielsen uses data visuals.
Researchers can map experimental results, using icons for variables and animations for sequential findings.
For executives, break down KPIs in board meetings, fostering data-backed decisions.
- Data Entry: Input figures into placeholders for instant chart updates.
- Visual Tweaks: Adjust scales and labels via Keynote tools.
- Animation Setup: Apply effects to unveil insights progressively.
- Final Polish: Integrate photos for contextual depth.
This surpasses basic options with analytical depth, saving time and elevating quality.
Slide-by-Slide Insights
Key slides include:
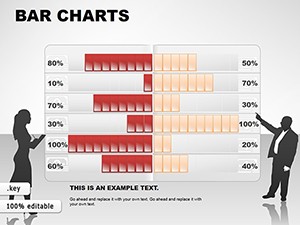
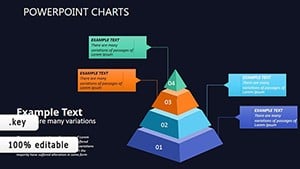
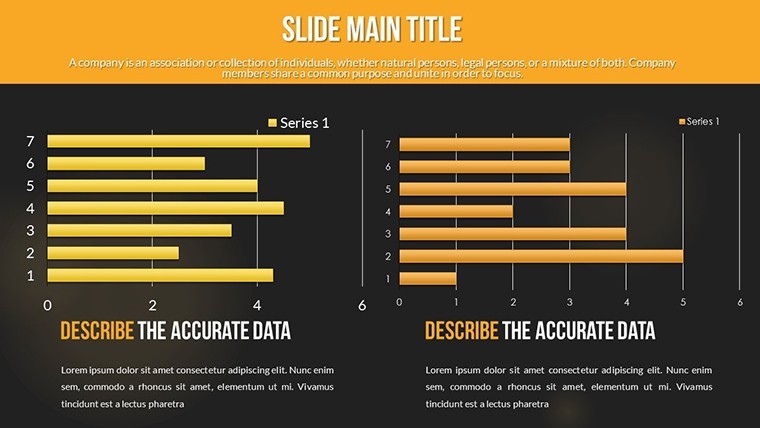
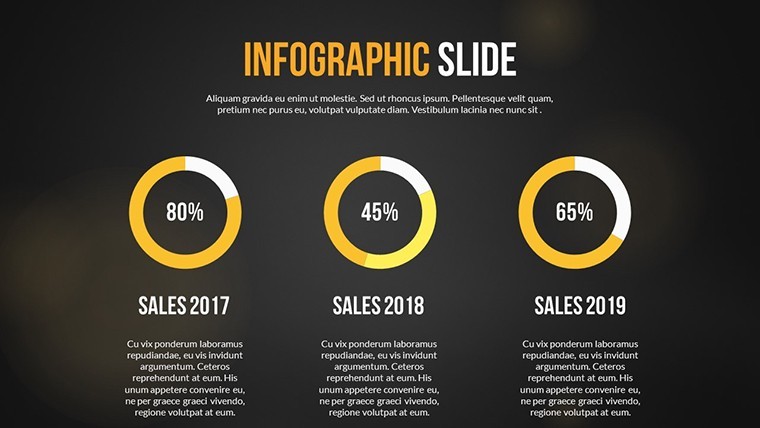
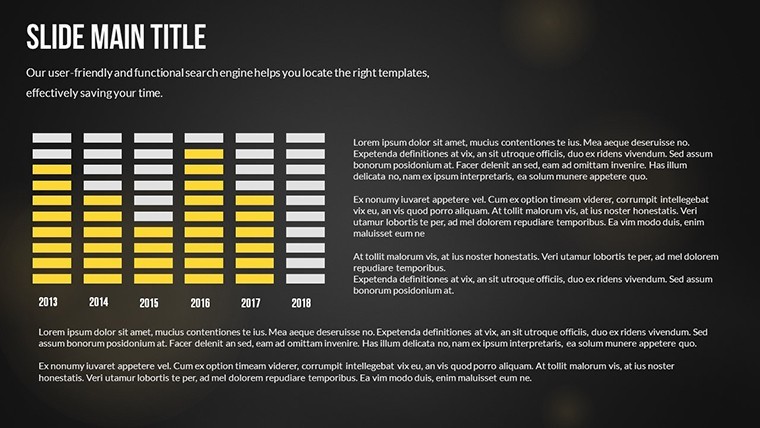
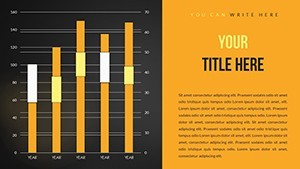
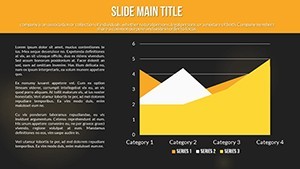
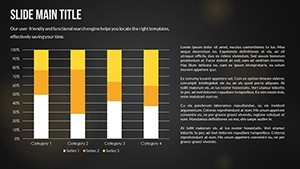
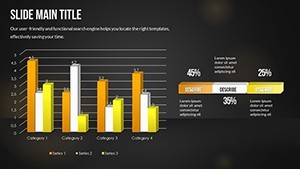
- Slides 1-5: Core Analysis Tools: Basic charts for initial data exploration.
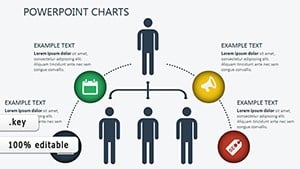
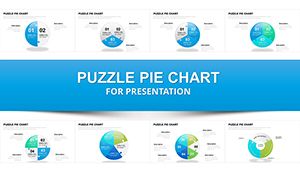
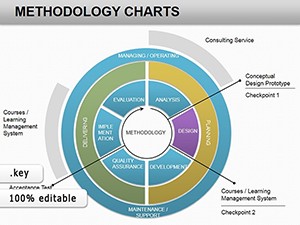
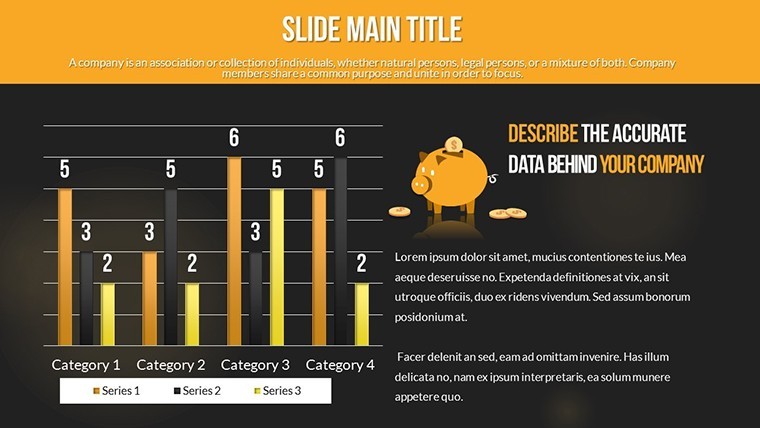
- Slides 6-10: Advanced Diagrams: For complex correlations.
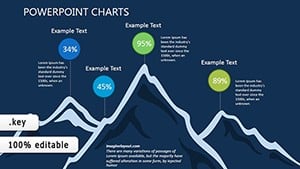
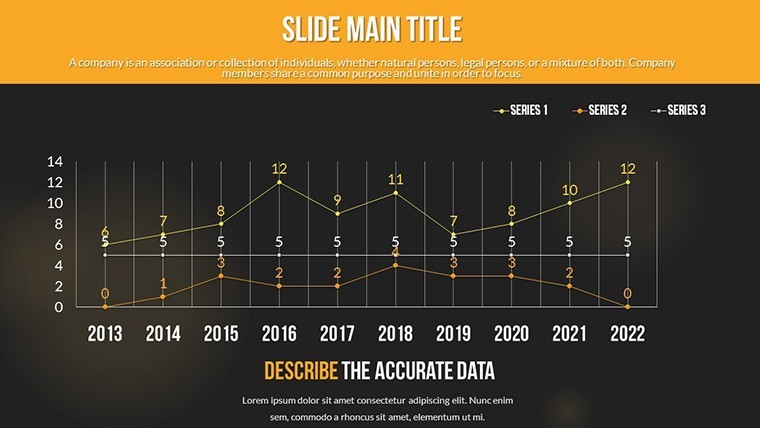
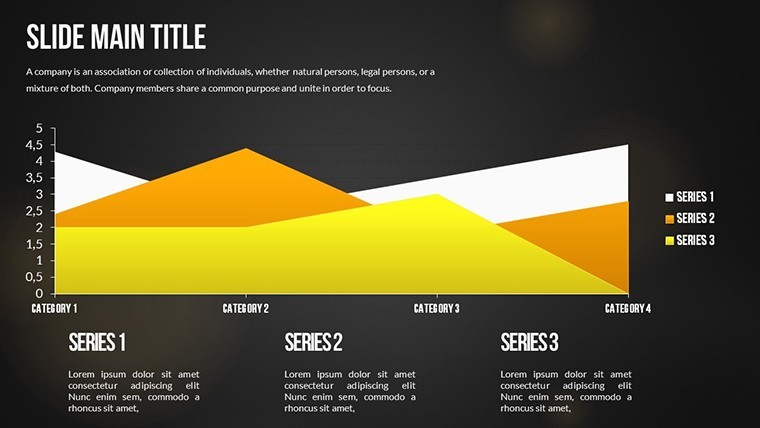
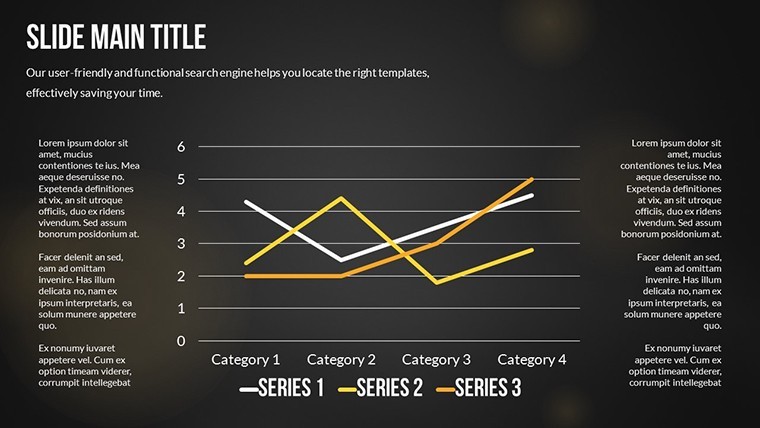
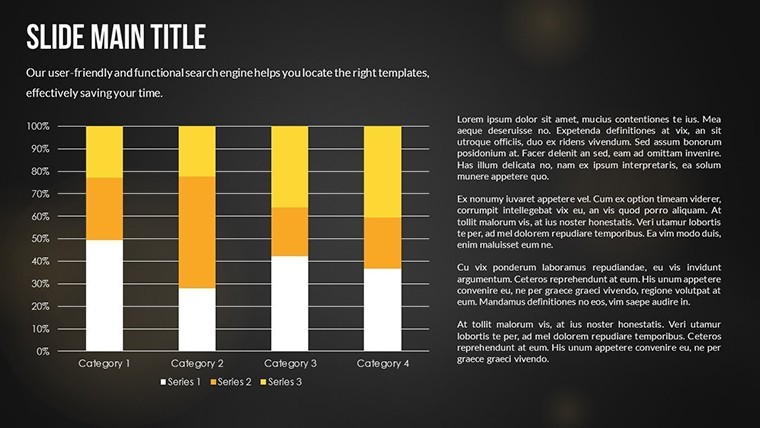
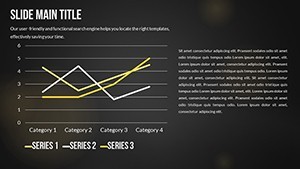
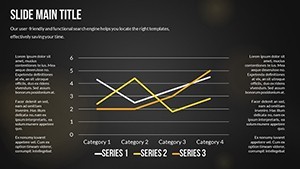
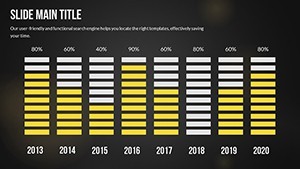
- Slides 11-15: Trend Visuals: With animation for dynamic views.
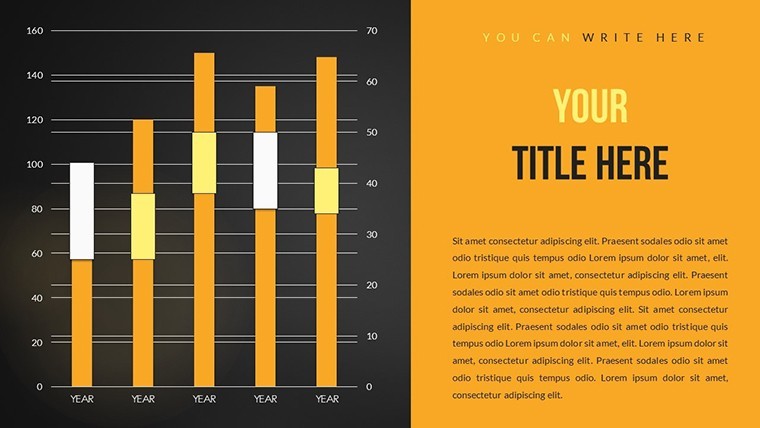
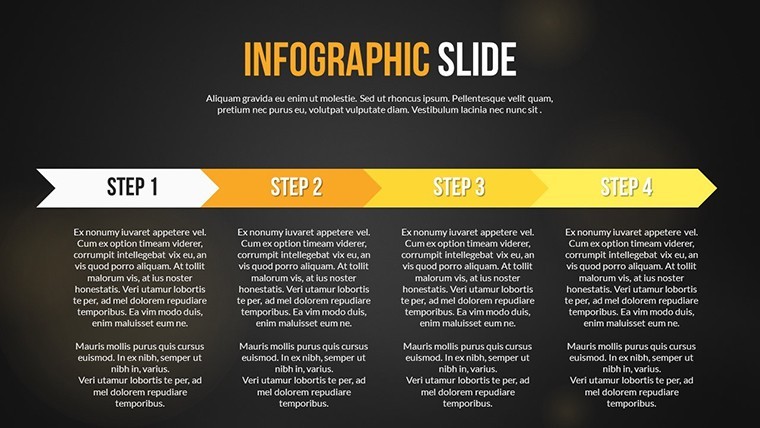
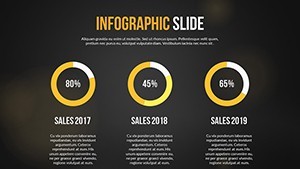
- Slides 16-19: Synthesis Slides: Combining elements for holistic analysis.
Tips: Pair with sans-serif fonts for readability; test on devices for versatility.
Empower Your Analytical Journey
This template fuels thoughtful presentations, drawing from proven analytical methods. Integrate with tools like Google Sheets for live data.
Ready to think sharper? Grab this template and transform your analysis.
Frequently Asked Questions
How flexible are the analysis charts?
Fully flexible; resize, recolor, and reconfigure to suit any dataset.
Compatible with Keynote on iPad?
Yes, works seamlessly across Apple devices.
Suitable for beginners?
Absolutely, intuitive design with easy edits.
Includes data import tips?
While not explicit, Keynote supports direct imports.
Why choose over competitors?
Unique animations and icons for standout analysis.