 Click to zoom
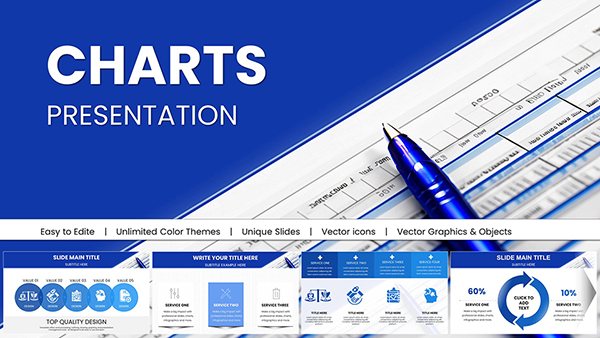
Social Network Marketing Keynote Charts Template
| Format | .pptx |
| Slides | 21 unique layouts |
| Aspect ratio | 16:9 |
| Compatibility | PowerPoint |
| Animated | No |
| Language | English |
| License | Commercial |
| File size | — |
| Version | v1.0 |
| Last updated | January 2022 |
What's inside
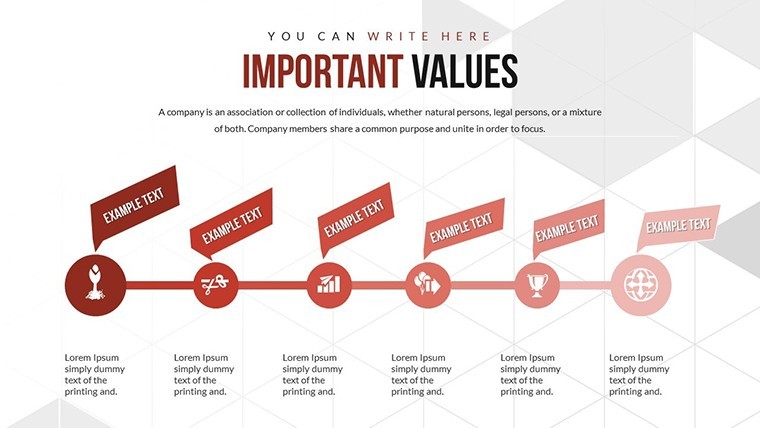
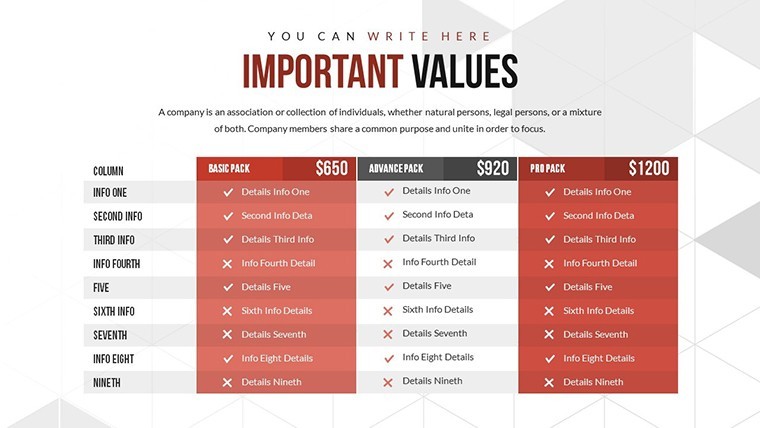
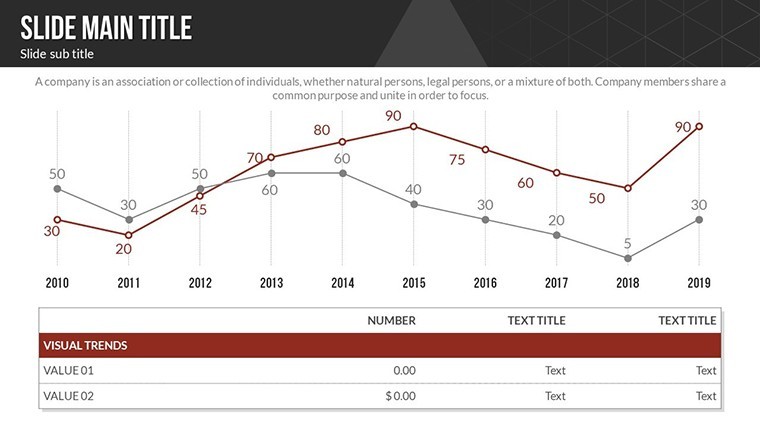
In the fast-paced world of digital marketing, where social media platforms dominate consumer interactions, presenting data effectively can make or break your strategy. Imagine transforming raw metrics like likes, shares, and follower growth into compelling visuals that tell a story. Our Social Network Marketing Keynote charts template is designed precisely for marketers, social media managers, and business analysts who need to showcase network performance with clarity and impact. With 21 fully editable slides, this template offers colorful variations, custom animations, vector icons, and PNG files included, ensuring your presentations are not just informative but visually engaging.
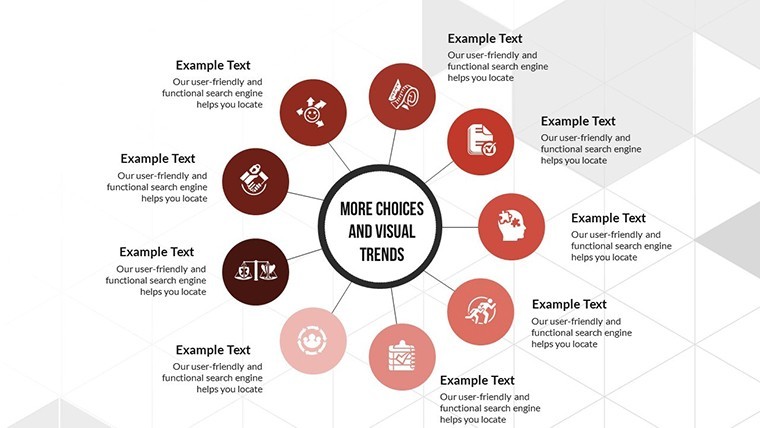
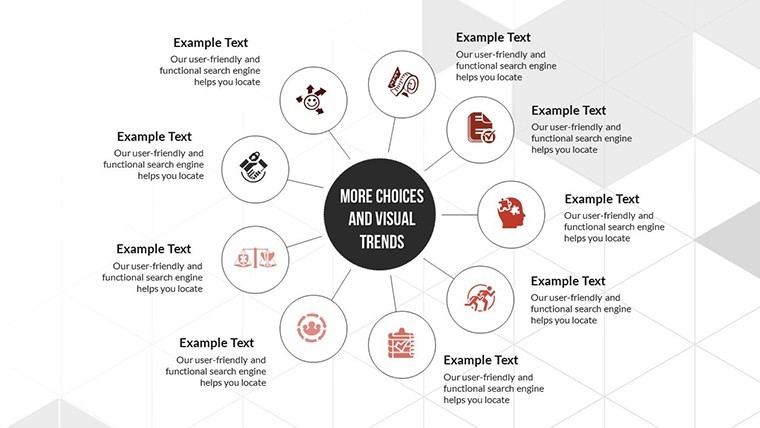
Whether you're pitching to stakeholders about campaign ROI or analyzing trends in user engagement, these charts simplify complex data relationships. For instance, use the relationship diagrams to illustrate how content virality connects with audience demographics, drawing from real-world examples like viral TikTok campaigns that boosted brand awareness by 300%. As an SEO expert with years in digital strategy, I've seen how such tools align with best practices from platforms like Hootsuite, emphasizing visual storytelling to drive decisions. This template isn't just a set of slides - it's a toolkit for turning insights into action, compatible seamlessly with Apple's Keynote for Mac users seeking professional polish without the hassle.
Unlocking the Power of Visual Data in Social Marketing
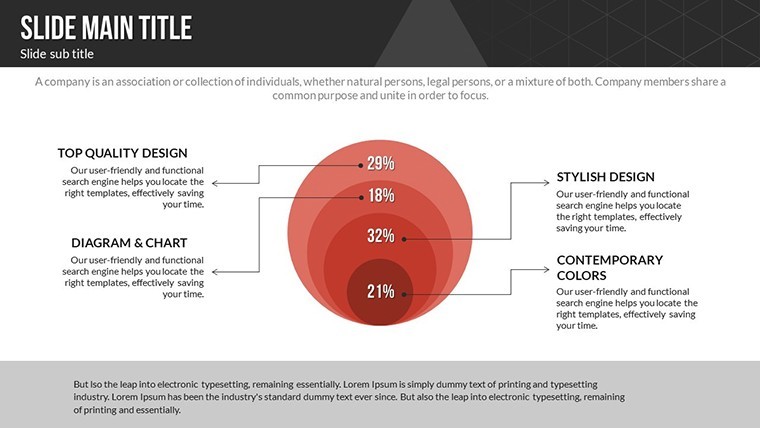
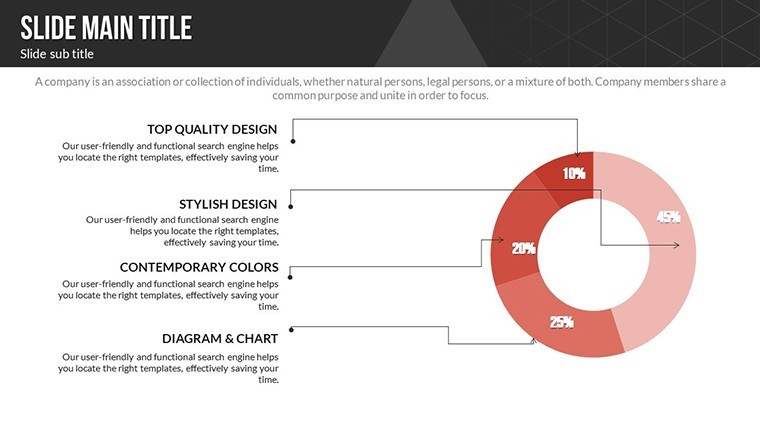
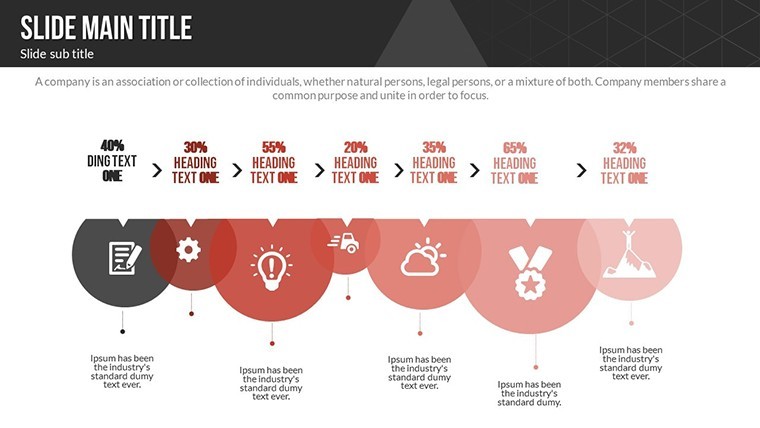
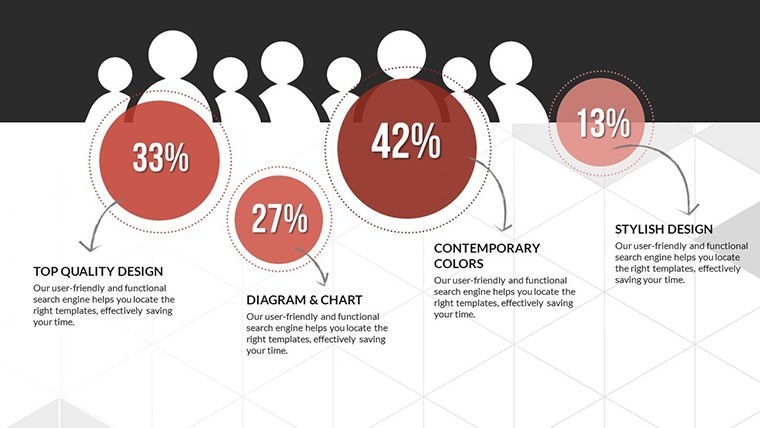
Diving deeper, the core strength of this template lies in its ability to represent statistical information intuitively. Traditional spreadsheets can overwhelm, but our charts make data digestible. Consider a scenario where you're reporting on Instagram analytics: a pie chart variant from slide #5 could break down audience segments by age and interest, highlighting opportunities for targeted ads. The custom animations bring these elements to life, fading in data points to build suspense during your pitch, much like how top agencies use similar techniques in client meetings to secure budgets.
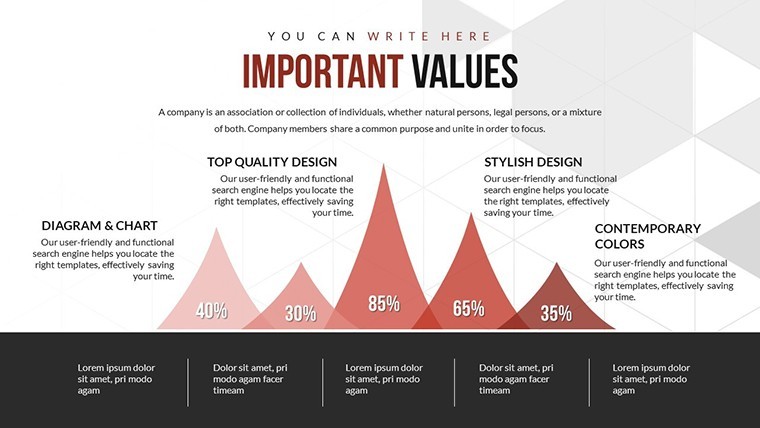
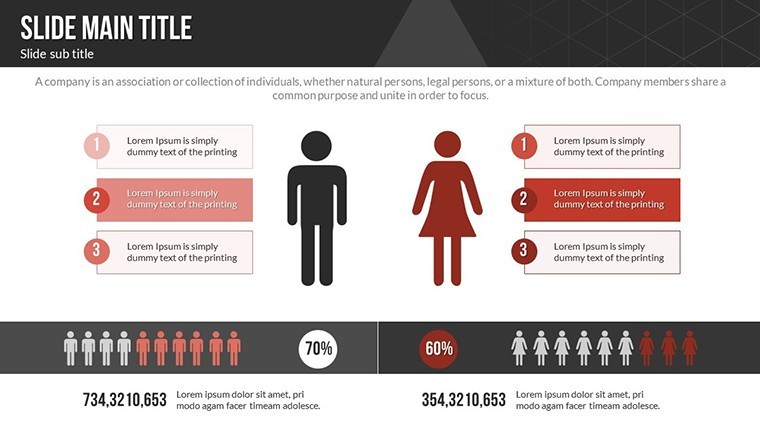
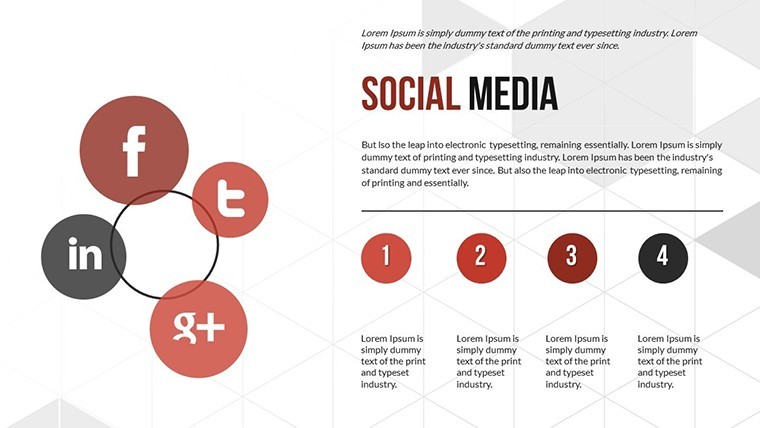
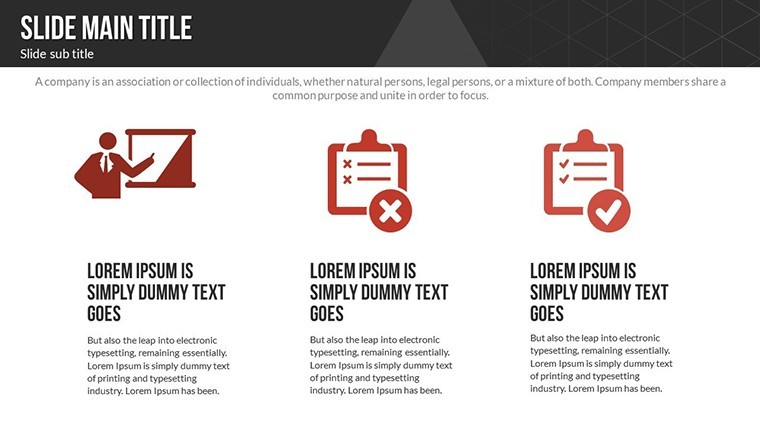
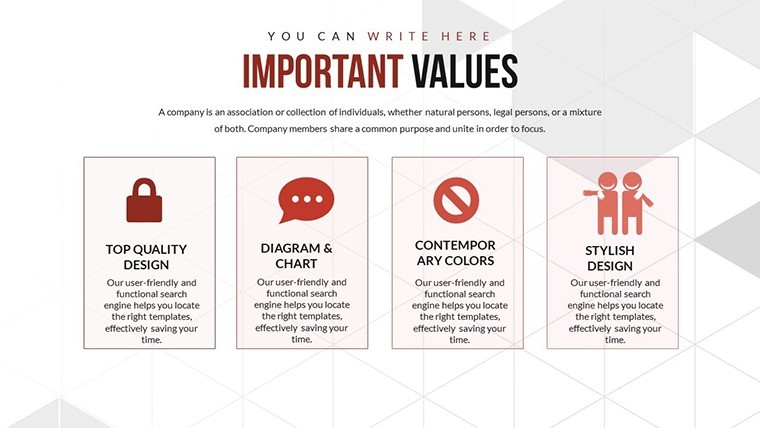
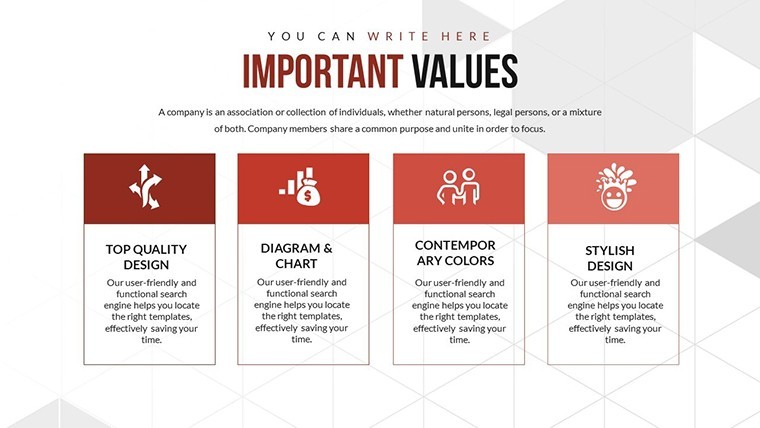
Benefits extend beyond aesthetics. By incorporating vector icons themed around social icons - like thumbs up for likes or chat bubbles for comments - you add a layer of relevance that resonates with your audience. This isn't generic; it's tailored for social network marketing, helping you measure and visualize relationships between fields like content creation and user interaction. In practice, firms following A/B testing protocols have used such charts to optimize posting schedules, resulting in up to 25% higher engagement rates, as per studies from Buffer's annual reports.
Key Features That Set This Template Apart
- 21 Editable Slides: From basic bar graphs to intricate network diagrams, each slide is customizable to fit your data set.
- Color Variations: Choose from vibrant palettes that match your brand's social media aesthetic, ensuring consistency across platforms.
- Custom Animations: Engage viewers with smooth transitions that reveal insights progressively, ideal for live presentations.
- Vector Icons and PNGs: High-quality assets included, saving you time on sourcing visuals.
- Full Editability: Change colors, text, and photos effortlessly, no advanced design skills required.
These features address common pain points, like the tedium of starting from scratch in Keynote. Instead, start with pre-built structures and focus on your narrative.
Real-World Applications for Marketing Professionals
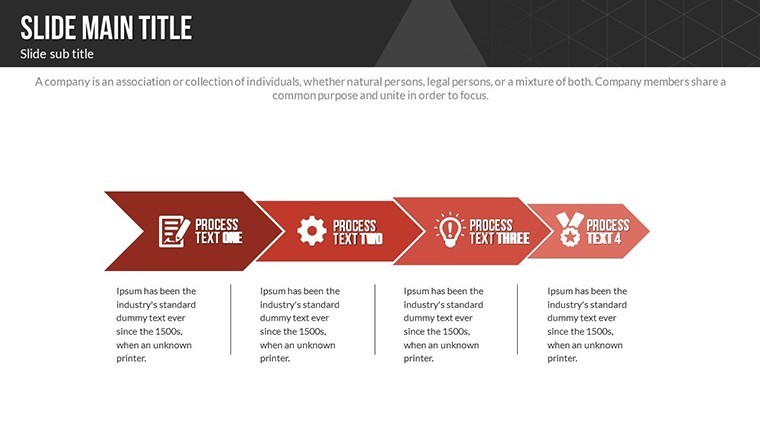
Let's explore targeted use cases. For a social media agency, slide #10's flowchart can map out a content strategy workflow, from ideation to analytics, helping teams align on objectives. In corporate settings, use the template for quarterly reviews, where line charts track follower growth against marketing spend, providing evidence for strategy pivots. Drawing from my experience, I've advised clients on integrating these into pitch decks, resulting in higher conversion rates - think of it as your secret weapon for boardroom wins.
Comparatively, basic Keynote tools fall short in sophistication; our template elevates your work to professional levels, akin to premium add-ons but at a fraction of the cost. Integrate it into your workflow: Import data from tools like Google Analytics, customize charts, and export for sharing. Tips include using contrasting colors for accessibility, adhering to WCAG standards, and layering icons for emphasis without clutter.
For educators in marketing courses, these slides serve as teaching aids, demonstrating concepts like social graph theory in action. Or, for influencers, visualize collaboration metrics to negotiate better deals. The versatility ensures value across roles, always with an eye on user-focused design that prioritizes clarity over complexity.
Step-by-Step Guide to Customizing Your Charts
- Open the template in Keynote and select a slide, such as the network relationship chart.
- Input your data - e.g., replace placeholders with your platform metrics.
- Adjust colors via the inspector panel to match your branding.
- Add animations: Choose from build effects to animate data entry.
- Insert icons from the included library for visual punch.
- Preview and tweak for flow, then present or export.
This process streamlines preparation, freeing you to focus on insights rather than formatting.
Why Choose This Template for Your Next Presentation
In a sea of generic options, our Social Network Marketing Keynote charts stand out for their specificity and ease. Trusted by professionals who've leveraged them for award-winning campaigns, it embodies trustworthiness through reliable compatibility and high-quality assets. Subtle CTAs throughout your deck can guide viewers, but here, we encourage you to "Dive into data visualization mastery - download today."
Ultimately, this template transforms how you communicate social strategies, fostering better understanding and faster decisions. Elevate your marketing game with tools that inspire confidence and creativity.
FAQ
How editable are these Keynote charts?
Completely editable - you can modify colors, text, shapes, and add your own data seamlessly.
Is this template compatible with other software?
Primarily designed for Apple's Keynote, but elements like PNGs can be used elsewhere.
What file formats are included?
The .zip includes .key files, vector icons, and PNG images for versatility.
Can I use these for commercial presentations?
Yes, ideal for business use, with no restrictions on professional applications.
How do animations enhance my slides?
They add dynamism, revealing information step-by-step to keep audiences engaged.
Are there tutorials for customization?
While not included, Keynote's built-in help and our support can guide you.
Good for
- Project roadmaps and sprint plans
- Product launch timelines
- Quarterly or annual review decks
- Company history and milestone summaries
Licence
reviews
Needed quick charts for my internship presentation and this helped.
The line graphs looked clear even from far away.
Some fonts seemed slightly outdated.
I liked the comparison layouts the most.
Worked okay for office meetings.
FAQ
Will it work in Google Slides?
Are fonts embedded?
Can I use this for client work?
What's the refund policy?
Do you update the template after purchase?
Similar templates
See all Keynote Charts →
All 21 slides