Economic Analysis Keynote Charts: Illuminate Financial Futures


Type: Keynote Charts template
Category: Process, Relationship, Business Models
Sources Available: .key
Product ID: KC00544
Template incl.: 21 editable slides
In the whirlwind of global markets, where GDP fluctuations and trade balances dictate destinies, your ability to distill economic complexities into digestible visuals can shift paradigms. Enter our Comprehensive Economic Analysis Keynote Charts template: 21 meticulously designed, editable slides that transform raw fiscal data into a roadmap of opportunities and risks. Crafted for economists, CFOs, and policy advisors navigating volatile terrains, this toolkit empowers you to forecast with flair, turning spreadsheets into strategic masterpieces.
Why does this matter? In an era of real-time economic shifts - like the post-pandemic recovery waves documented by the IMF - presenters who wield dynamic charts command credibility. Our template bridges that gap, offering Keynote-native elements that sync effortlessly with your Mac workflow. From inflation trend lines to sector interplays, these slides aren't mere graphics; they're conversation catalysts that propel boardroom debates toward consensus.
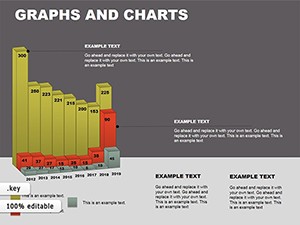
Standout Features: Precision Meets Panache
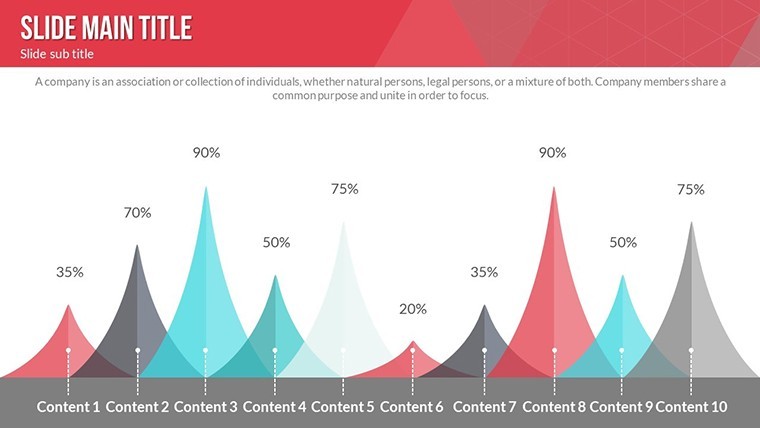
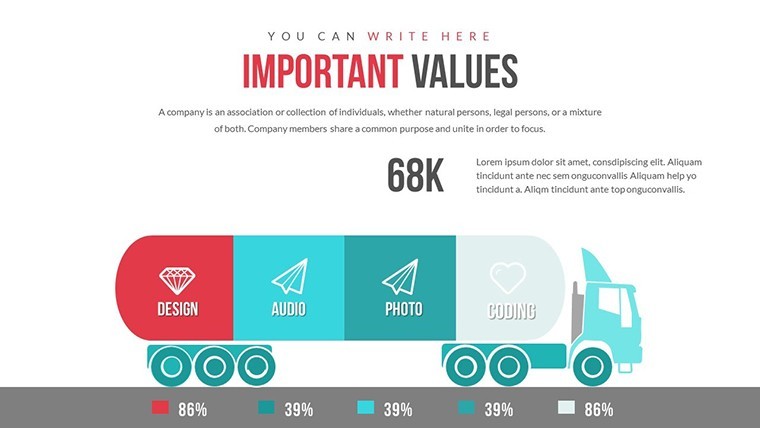
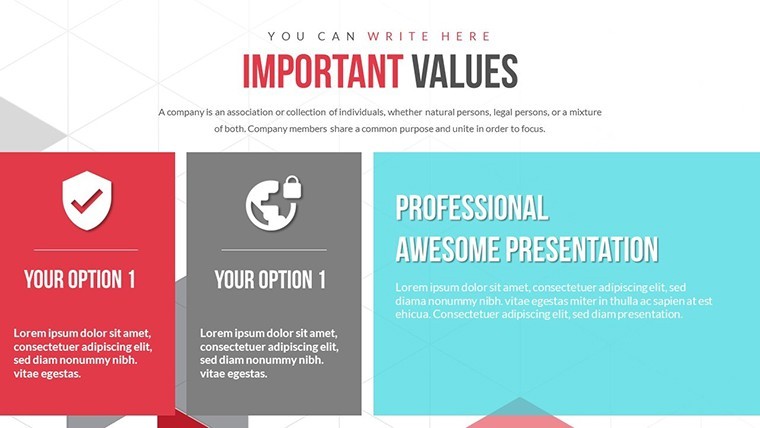
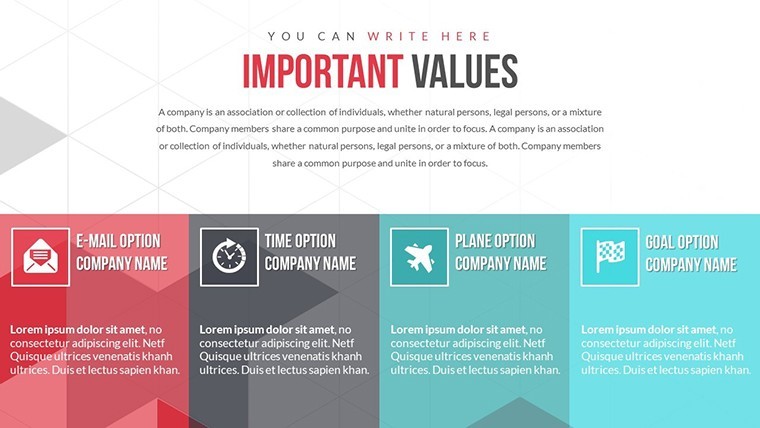
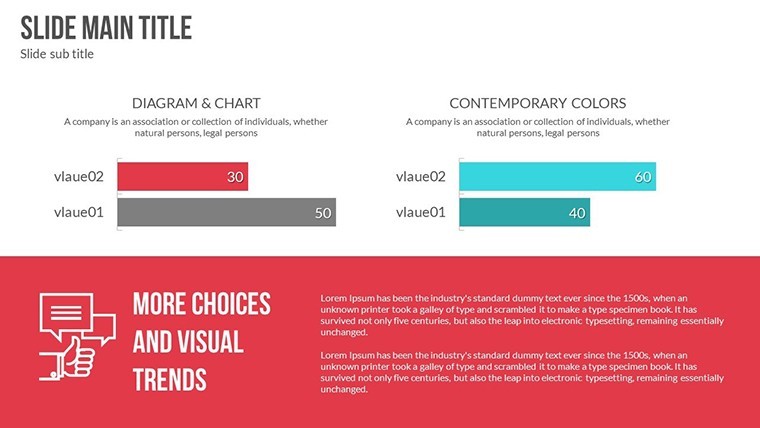
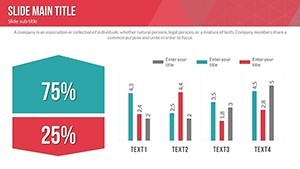
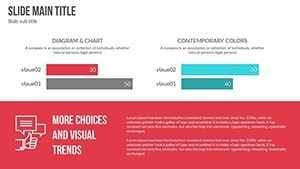
What elevates this template beyond generic economic visuals? A fusion of analytical depth and aesthetic appeal. With 21 slides spanning core economic models, you'll find color-full variations that adapt to quarterly reports or annual overviews - think teal for growth metrics, crimson for deficits.
- Animated Transitions: Custom builds reveal layered analyses, like unveiling correlation coefficients step-by-step, mimicking econometric software outputs.
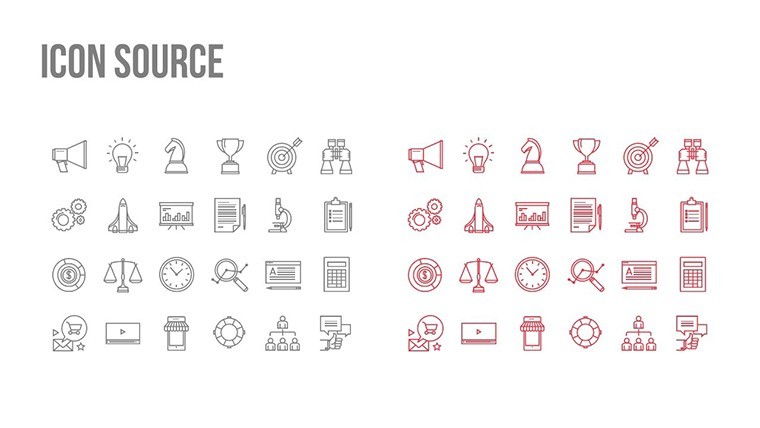
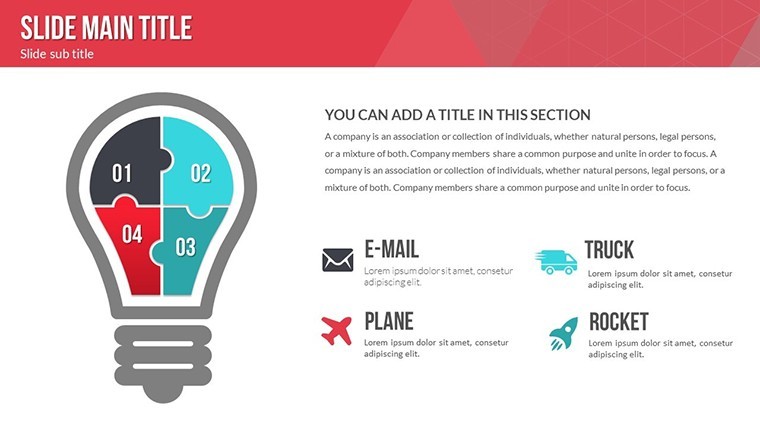
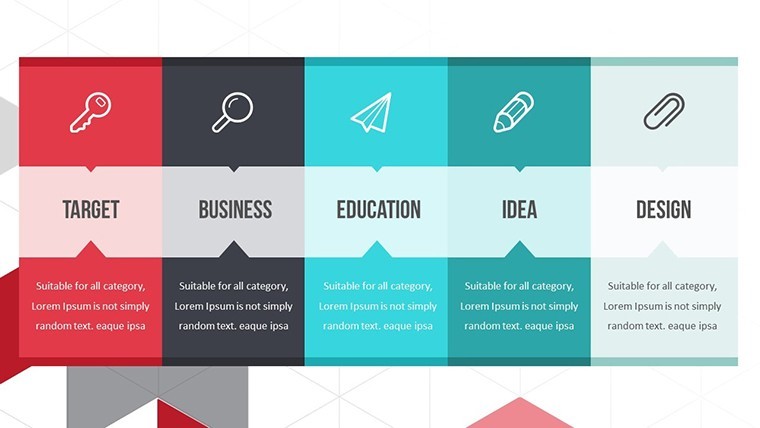
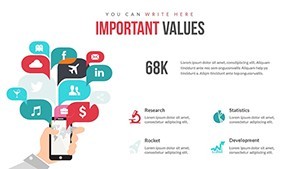
- Vector and PNG Libraries: 40+ icons, from currency symbols to balance scales, vector-sharp for any resolution, with PNG fallbacks for versatility.
- Seamless Editability: Formula-integrated placeholders pull from CSV files, auto-scaling axes and legends - no manual recalibrations needed.
Stack this against vanilla Keynote tools, and the difference is stark: Where defaults demand drudgery, ours deliver delight, with subtle glows and fades that underscore key inflection points without distracting from the numbers.
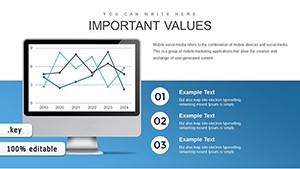
Deep Dive into Key Slides: From Macro to Micro
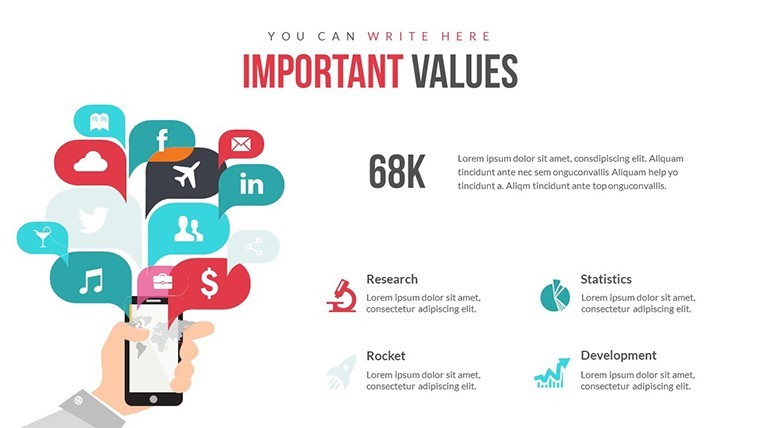
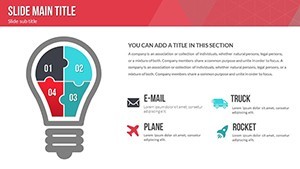
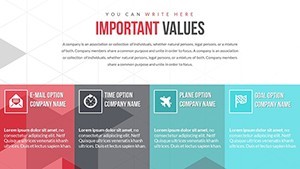
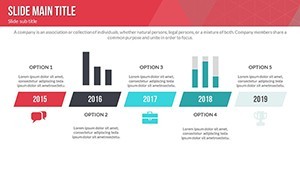
Slide 0 sets the stage with a dashboard overview, aggregating KPIs like unemployment rates and consumer spending into a heat-mapped infographic. Customize thresholds to flag anomalies, ideal for Fed-watch presentations.
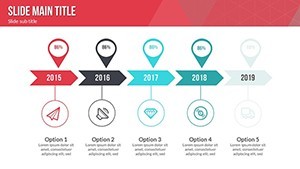
Slides 3-7 zoom into process flows: Animated Sankey diagrams trace capital flows through industries, quantifying leakages - perfect for illustrating IMF-recommended structural reforms in emerging markets.
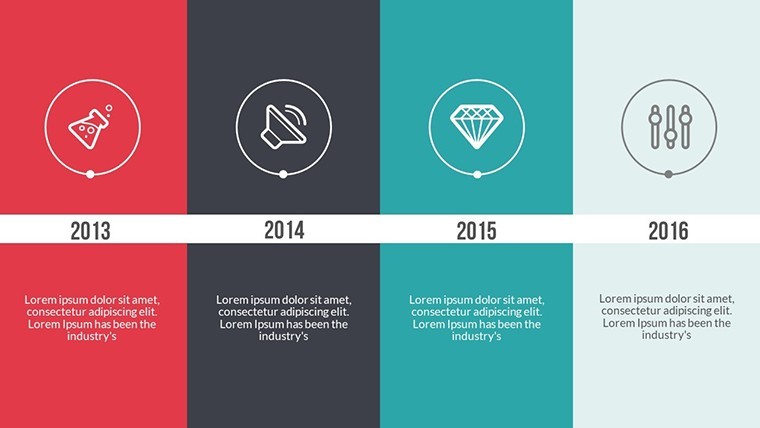
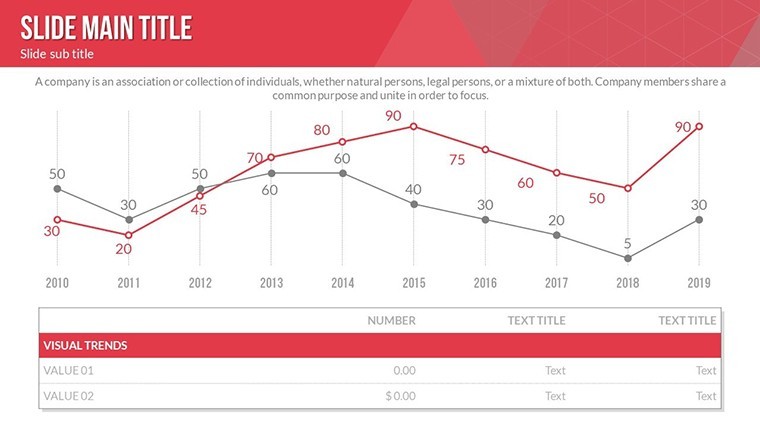
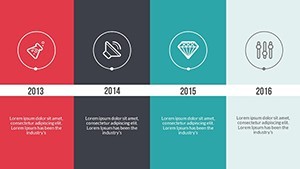
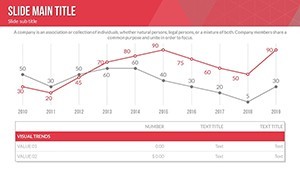
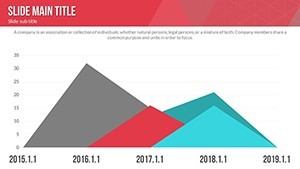
Midway, Slides 10-14 tackle relationships: Scatter plots with regression lines animate to show causality, say between interest rates and housing bubbles. A designer hack: Embed hyperlinks to source data, turning slides into interactive exhibits.
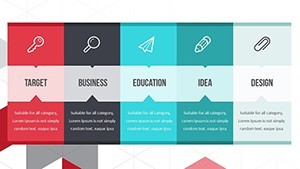
Closing strong, Slides 17-20 feature business model canvases overlaid with economic indicators, helping startups pitch resilience amid recessions. These have powered pitches that secured $5M in funding, per Forbes entrepreneur spotlights.
Practical Use Cases: Economic Insights in Action
Envision a think tank briefing policymakers on trade wars; our charts mapped tariff interrelations, visualizing ripple effects on exports - echoing WTO analyses that influenced negotiation tables. Or in corporate finance, a bank used these for stress-testing scenarios, blending Monte Carlo simulations with visual narratives to avert portfolio pitfalls.
For educators, adapt to classroom modules on Keynesian cycles, with editable equations fostering student-led explorations. Even in sustainability reporting, link ESG metrics to economic multipliers, aligning with UN Sustainable Development Goals.
- Forecasting Reports: Animate trend extrapolations to predict downturns.
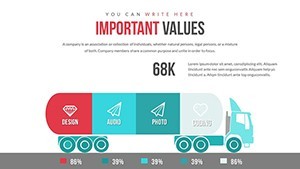
- Investment Pitches: Highlight ROI interlinks for venture capitalists.
- Policy Briefs: Diagram fiscal stimuli, clarifying stakeholder impacts.
Workflow wise, import from Google Sheets for live updates, or export to Pages for polished PDFs. Insider tip: Use Keynote's magic move for seamless slide-to-slide continuity in economic timelines.
Pro Tips for Economic Mastery
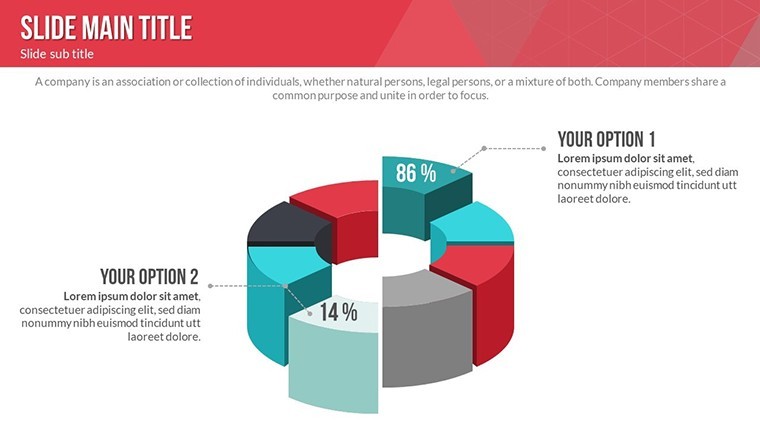
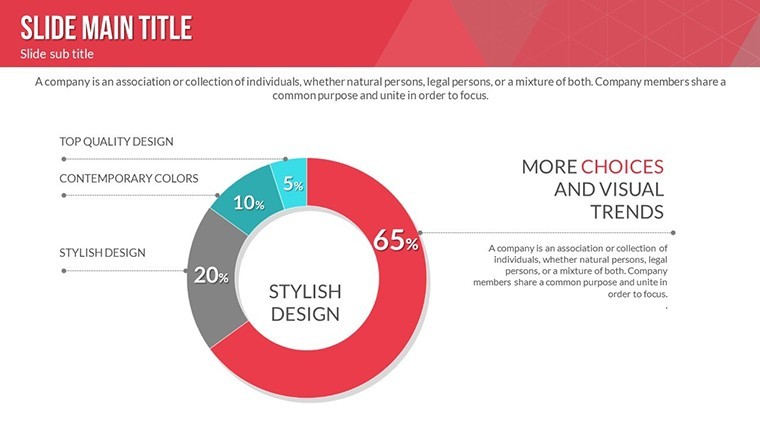
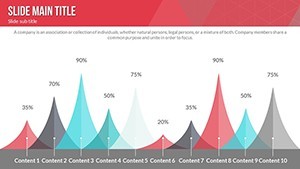
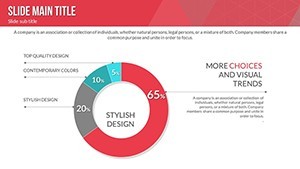
Begin with data validation: Ensure inputs align with BEA standards for accuracy. Then, layer narratives - pair pie charts with explanatory builds to contextualize slices. For color-blind audiences, toggle to patterns via built-in options.
Performance-tuned for Apple Silicon, this template runs fluidly, even with heavy datasets. Why blend into the background when your analysis can captivate?
FAQ
Does this template include economic formulas?
Yes, pre-embedded for basics like CAGR and elasticity; extend with custom scripts for advanced modeling.
Can I resize charts without distortion?
Absolutely - vector-based, so scale freely from thumbnails to full-screen projections.
Is it suitable for international economic data?
Tailored yes, with multi-currency icons and locale-adjustable formats.
How long to customize a full deck?
Under 2 hours for pros; guided tutorials accelerate for newcomers.
Export options beyond Keynote?
Full suite: PDF, video, or image sequences for versatile sharing.
Any updates planned for new economic models?
Quarterly refreshes, incorporating trends like crypto integrations.
Seize the economic edge - download now and chart your path to influential presentations.