Visualize Growth with Dynamics of Development Keynote Charts


In an era where development projects evolve rapidly, capturing the essence of progress through visuals is key. Our Dynamics of Development Keynote Charts template, with 24 editable slides, is ideal for project managers, innovators, and strategists seeking to illustrate cycles of growth and transformation. Featuring cycle diagrams and 3D elements, this template brings abstract development phases to life, helping you communicate milestones effectively. Compatible with Keynote on macOS, it's fully editable for personalized touches like color variations and photo integrations.
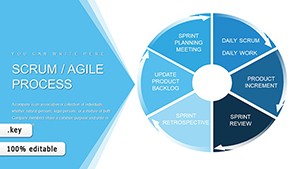
Inspired by agile methodologies from frameworks like Scrum, where iterative cycles drive success, this template empowers users to present with authority, much like how tech giants like Google map product lifecycles.
Standout Features for Developmental Storytelling
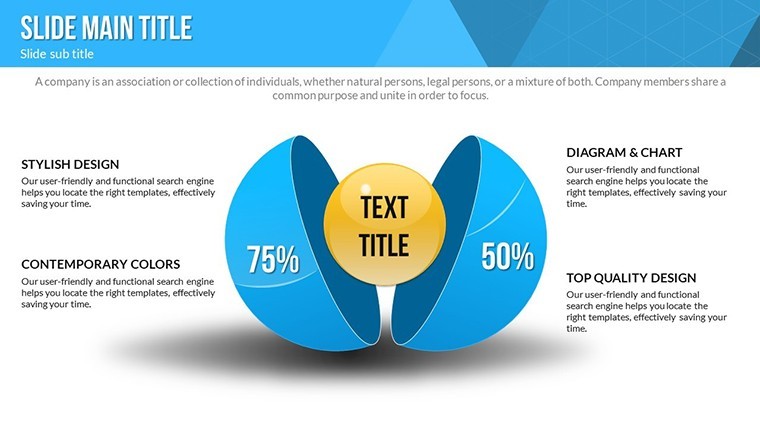
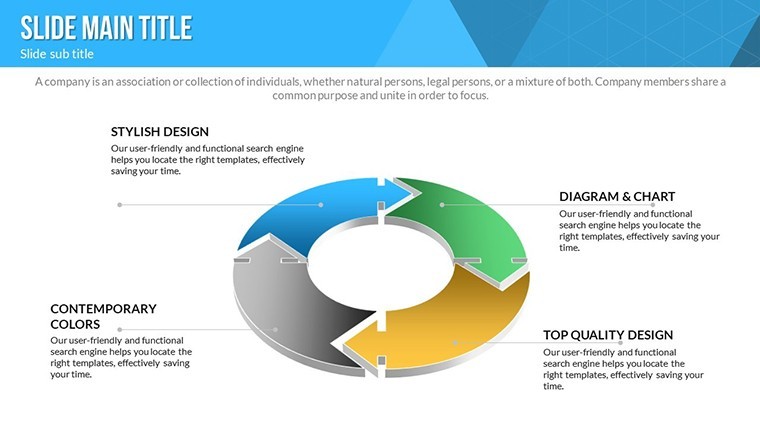
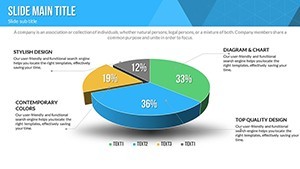
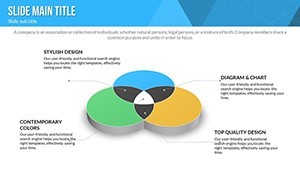
Centered on cycle and 3D designs, the template offers vibrant variations and animations to depict ongoing processes dynamically.
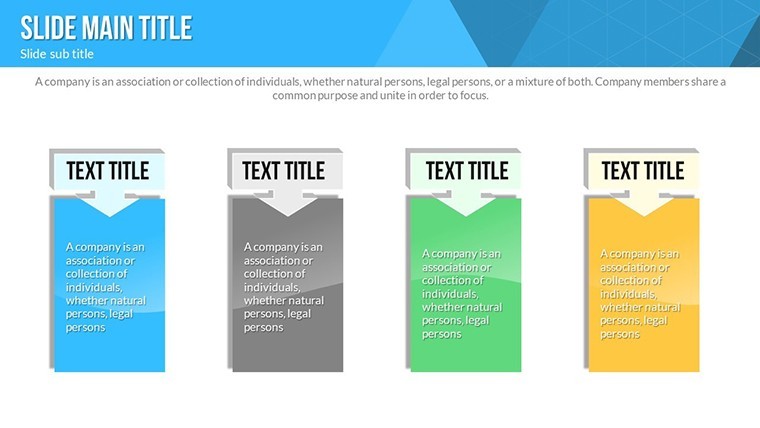
- Colorful Customizations: Full variations for thematic consistency.
- Animated Effects: Custom per slide for vivid narratives.
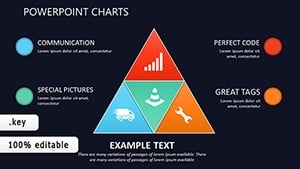
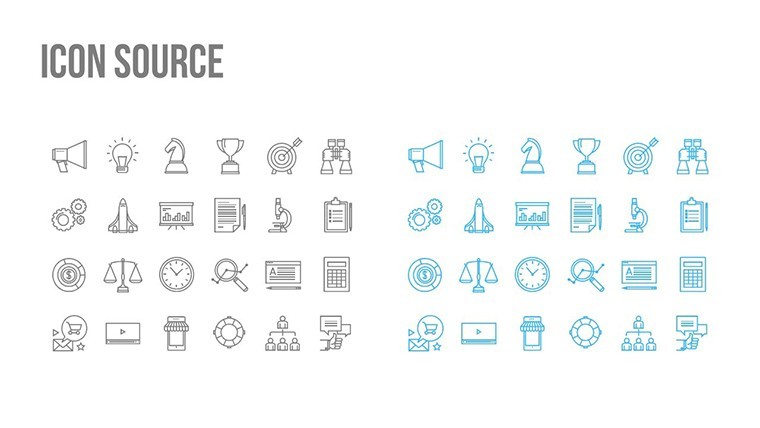
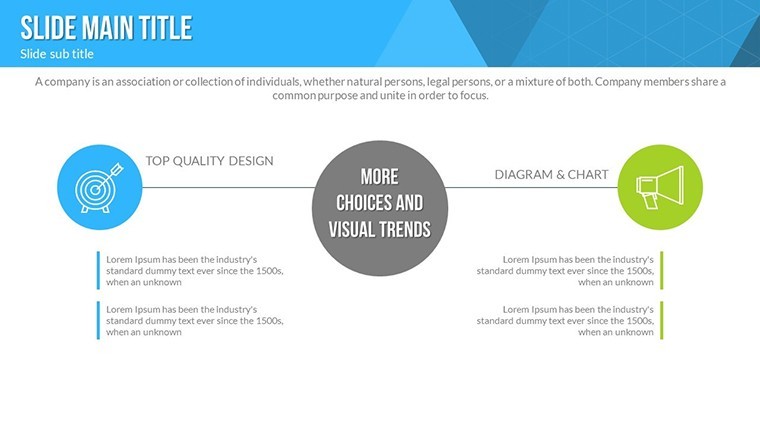
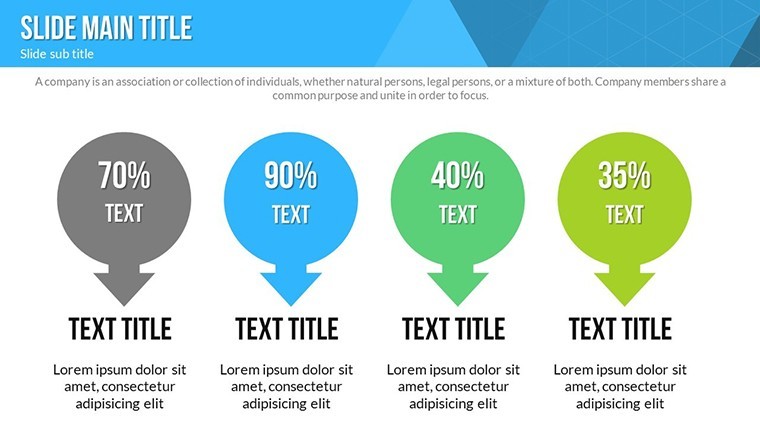
- Vector Icons Included: PNG and vectors for versatile use.
- Easy Edits: Change text, colors, and photos swiftly.
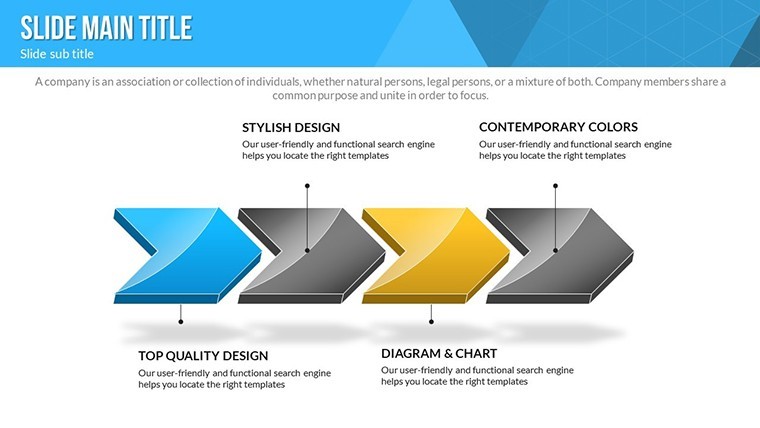
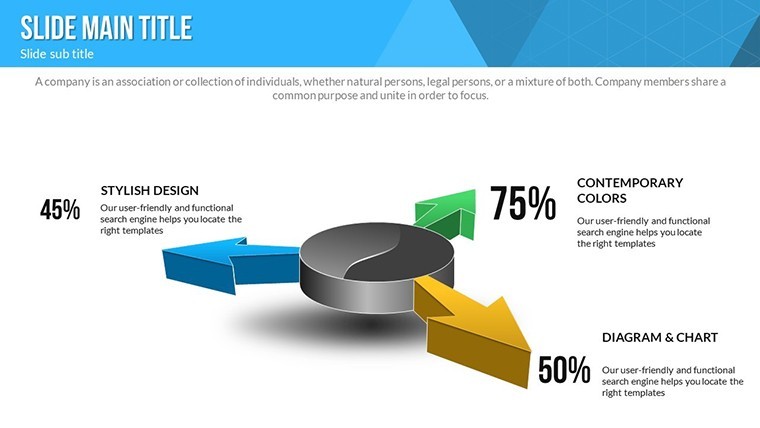
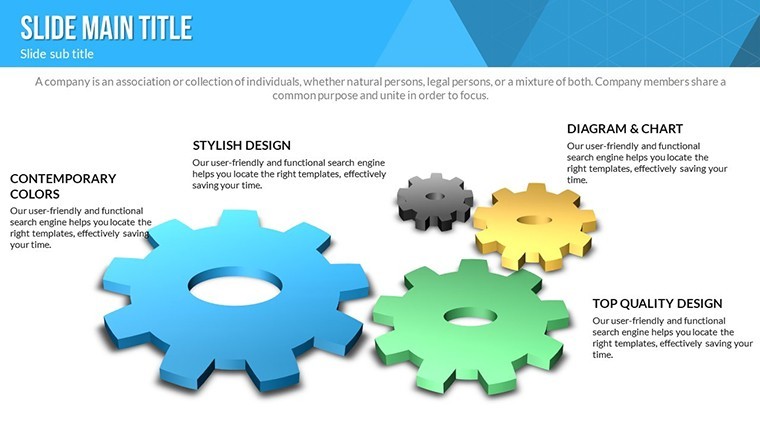
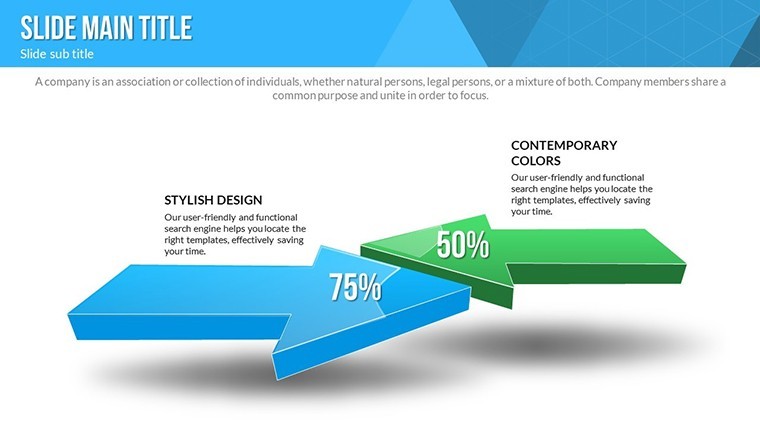
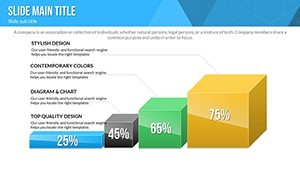
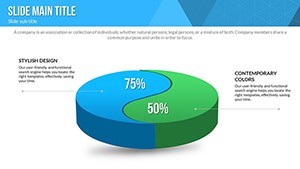
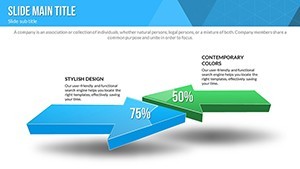
- 3D Depth: Add dimension to cycle representations.
These elements draw from design expertise, ensuring compliance with visual communication standards from bodies like the Project Management Institute.
Slide-by-Slide Insights
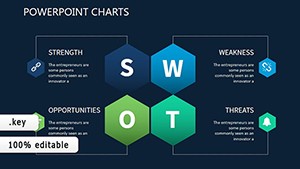
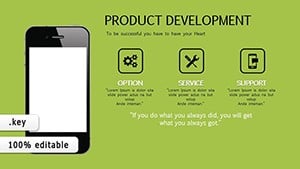
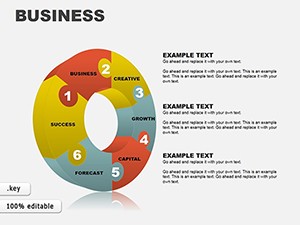
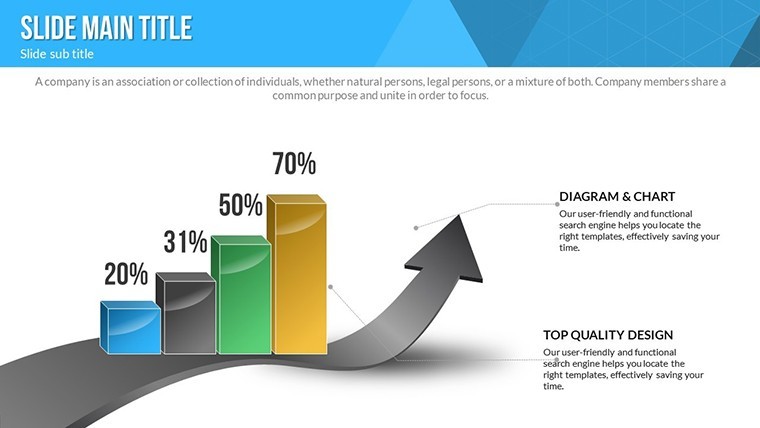
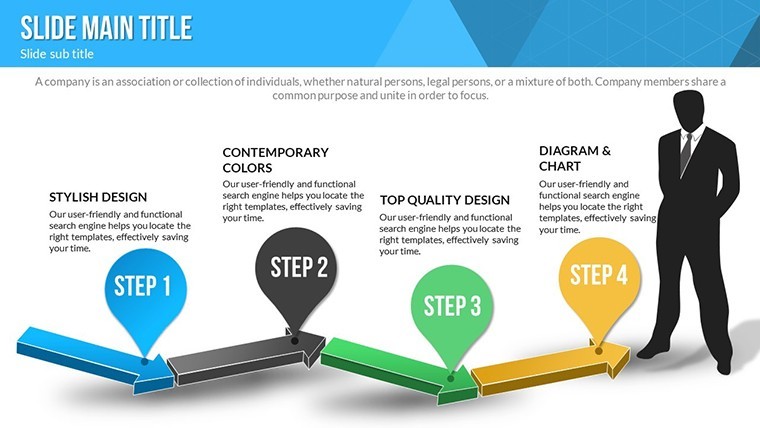
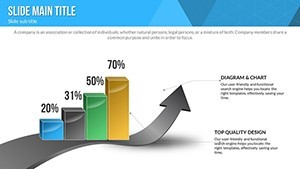
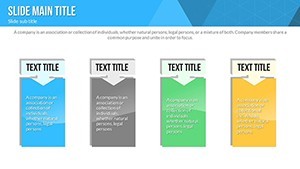
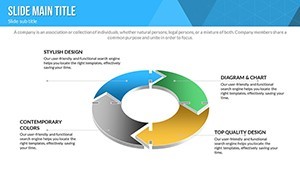
Slide 1 introduces a 3D cycle overview for project phases. Slides 2-8 cover initiation: spiral charts for idea generation, 3D pyramids for foundational builds, and icon-enhanced timelines.
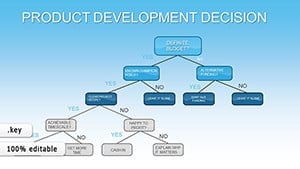
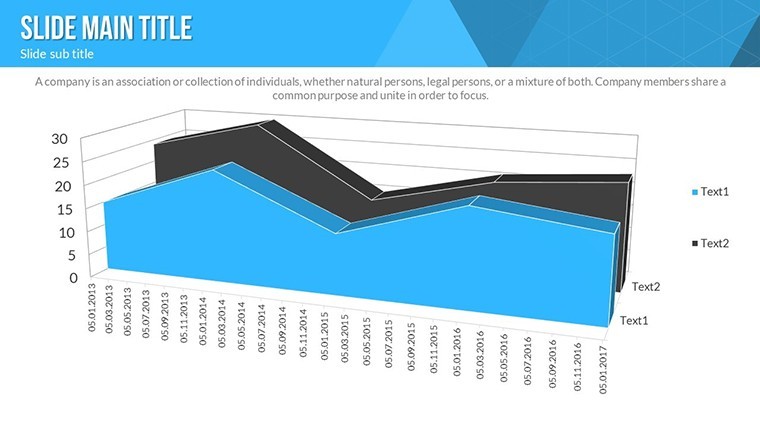
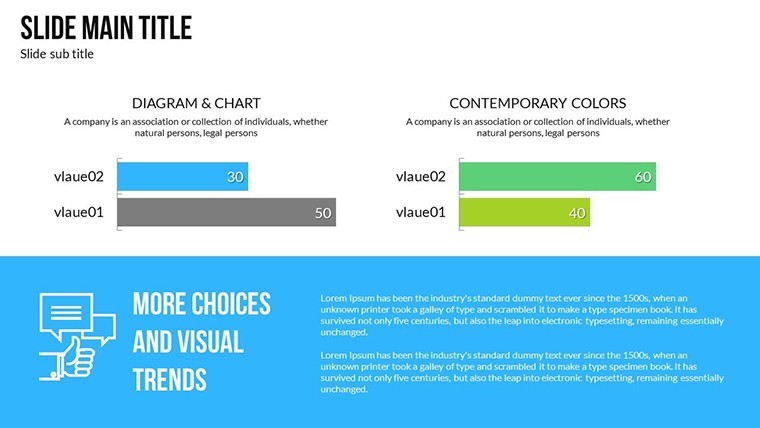
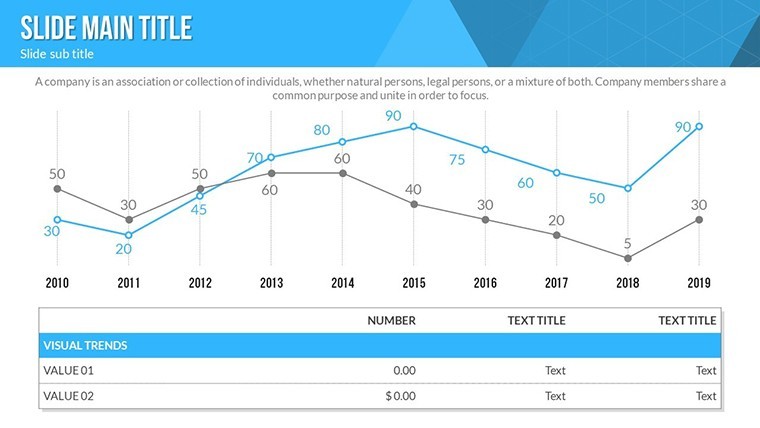
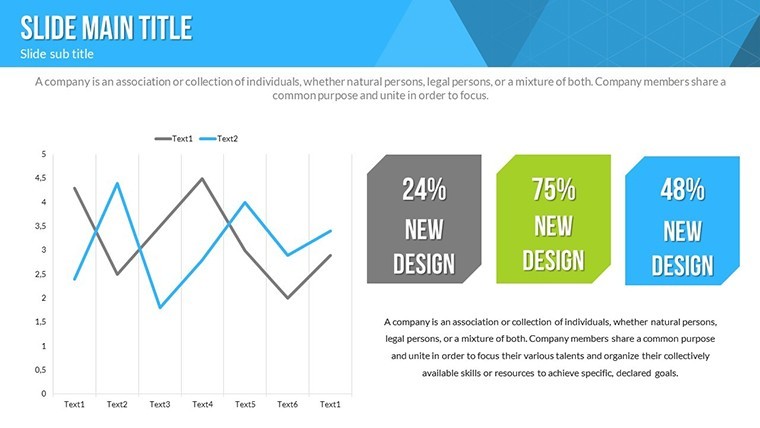
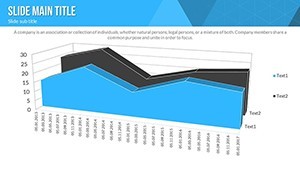
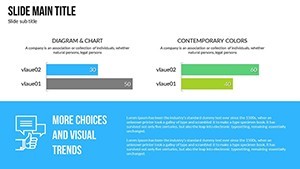
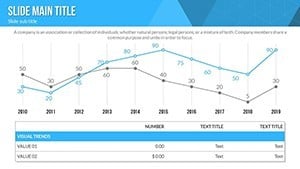
Development cores in Slides 9-16 include loop diagrams for iterations, growth curves with animations, and matrix views for resource allocation. Closing slides 17-24 focus on evaluation: feedback cycles, progress radars, and summary 3D models.
Applications in Development Scenarios
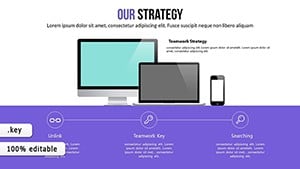
For software devs, map sprint cycles, echoing GitHub's workflow visualizations. Innovators can showcase product evolution, akin to Tesla's iterative designs.
Strategists use for urban planning pitches, illustrating sustainable development loops from case studies like Singapore's smart city initiatives.
Step-by-Step Customization
- Download .key file.
- Open in Keynote.
- Input development data.
- Adjust colors and icons.
- Add animations and media.
- Preview and deploy.
Efficient for tight deadlines.
Tips for Dynamic Presentations
Narrate cycles with real examples, incorporating LSI like "iterative progress models." The 3D animations surpass flat charts, per animation efficacy research.
Foster trust via transparent visuals.
Ignite your development stories - customize this template today.
Frequently Asked Questions
- What animation types are available?
- Custom effects for cycles and transitions.
- Mac-only?
- Yes, Keynote native; export for others.
- Icons customizable?
- Fully, with included vectors.
- For project management?
- Ideal for cycles in PM.
- Handle complex data?
- Yes, with scalable 3D elements.