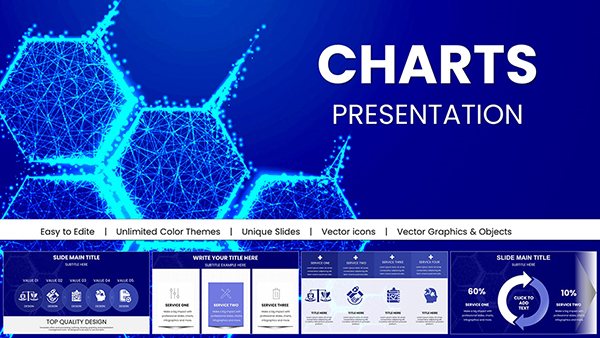
Digital Marketing Keynote Charts: Chart Your Path to Campaign Conquest


In the fast-scrolling arena of digital marketing, where algorithms rule and attention spans flicker, your presentations need to cut through the noise like a viral ad. Enter our Digital Marketing Keynote Chart template: 23 slides of precision-engineered visuals that turn metrics into masterpieces. Crafted for marketers, strategists, and agency leads navigating SEO seas, social storms, and email eddies, this deck equips you to showcase campaigns that convert - not just count.
Think of it as your command center: pie charts slicing audience segments, cycle diagrams looping lead funnels, all animated to mimic user journeys. Compatible with Mac iWork Keynote, it's built for the Apple ecosystem where creatives thrive. We've pulled from industry benchmarks - like Google's own data viz guidelines - to ensure your slides inform and impress. No more pixelated exports or clunky builds; these vectors scale with your ambitions, from startup pitches to enterprise audits. Your stakeholders? They'll see not just numbers, but narratives of growth, retention, and ROI that demand buy-in.
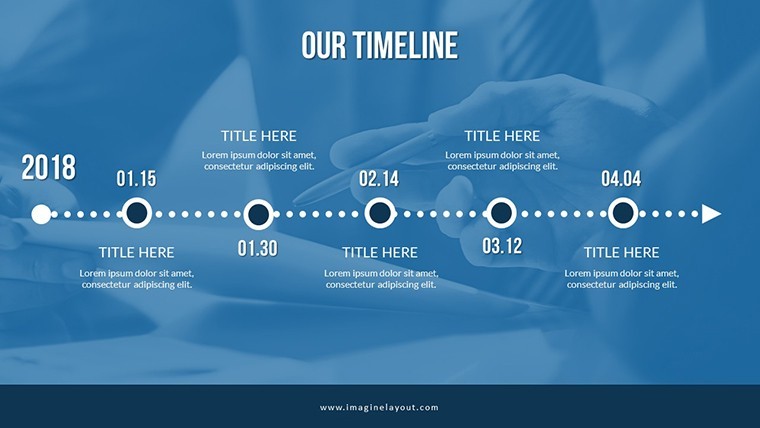
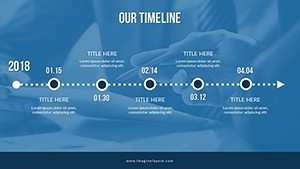
This isn't generic graphing - it's marketing muscle. Visualize A/B test outcomes with bars that battle it out or timelines tracking content calendars with milestone confetti. Tailored for the digital hustle, where 70% of decisions hinge on visuals (per Forrester), this template bridges data dumps to decision-making dynamite. Let's decode how it powers your playbook.
Power-Packed Features for Marketing Mastery
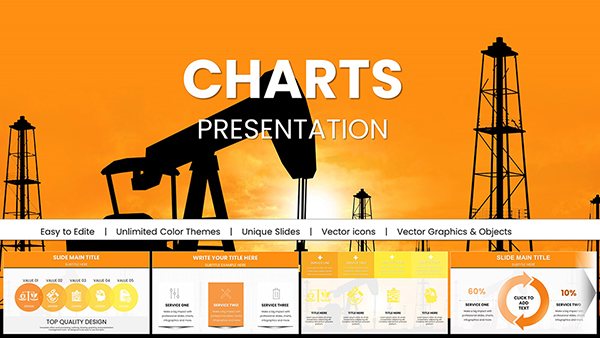
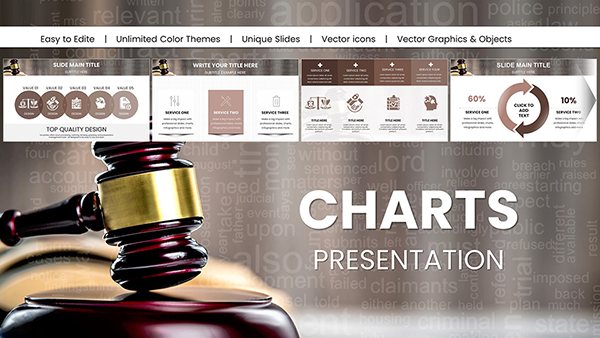
These 23 widescreen slides are your secret sauce: modern aesthetics with subtle gradients evoking app interfaces, plus a palette playground from cool cyans for analytics to warm ambers for conversion wins.
- Specialized Animations: Objects enter like loading screens - fades for forecasts, spins for sentiment analysis.
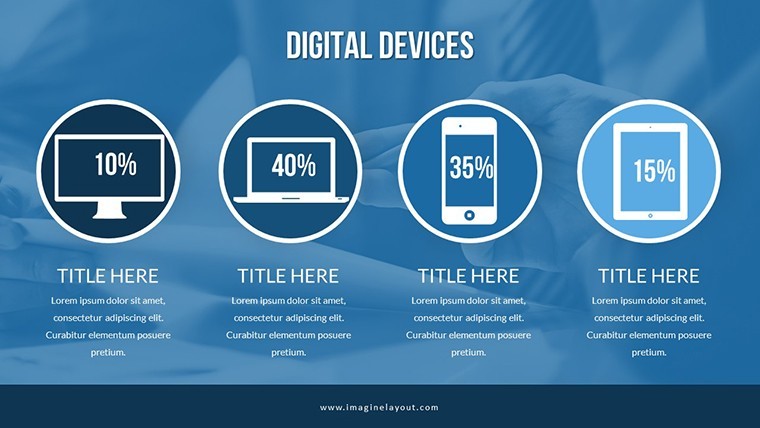
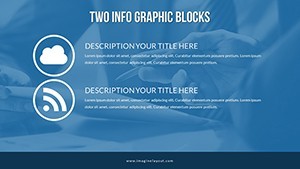
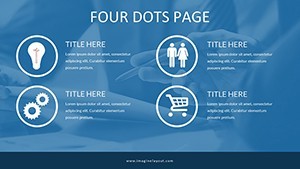
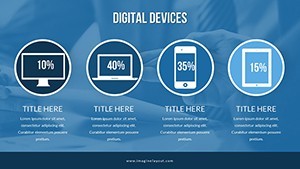
- Vector Precision: Pie wedges and cycle arrows resize flawlessly, icons galore (likes, shares, funnels) in scalable SVG bliss.
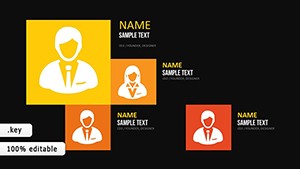
- Media Magic: Embed videos of ad plays or photos of user personas directly, with auto-crop for seamless storytelling.
Quick win: Use Keynote's hyperlinks to nest deeper dives, turning slides into interactive dashboards without code.
Slide Strategy: 23 Steps to Visual Victory
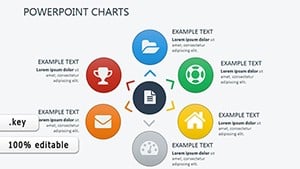
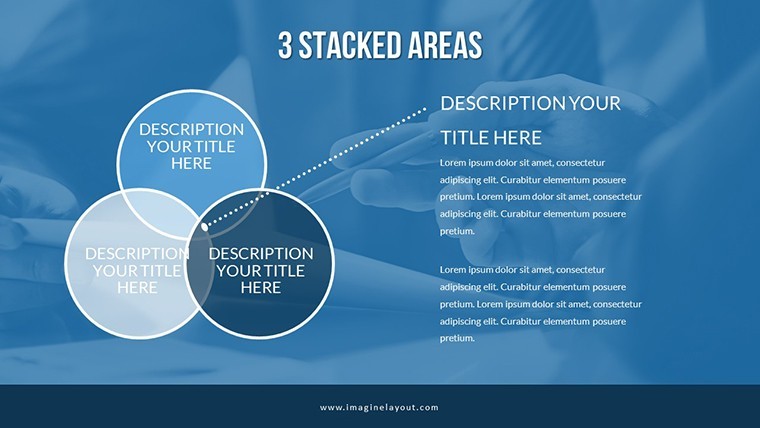
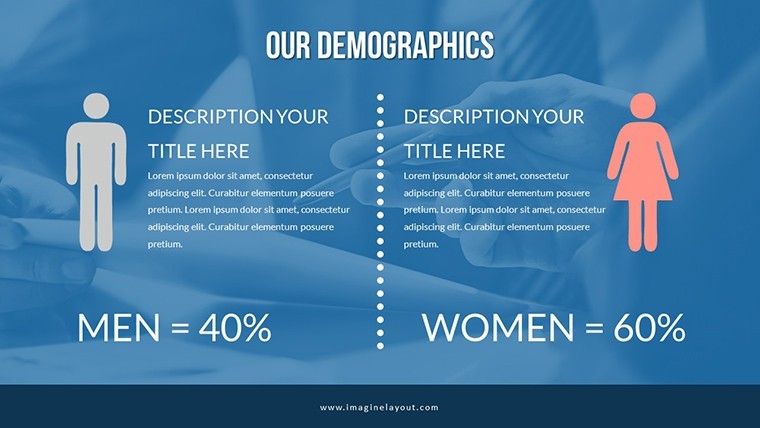
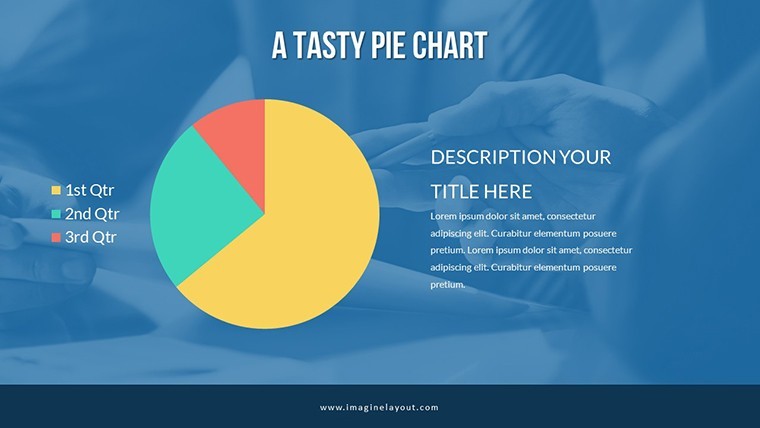
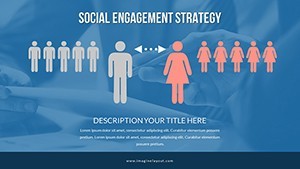
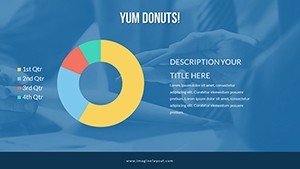
Launch with Slide 0's hero dashboard: a multi-metric mosaic blending KPIs - edit gauges to pulse with real-time pulls. Slides 4-9 zero in on pie charts for channel breakdowns, segments exploding outward to reveal sub-demographics, animated like a heatmap reveal.
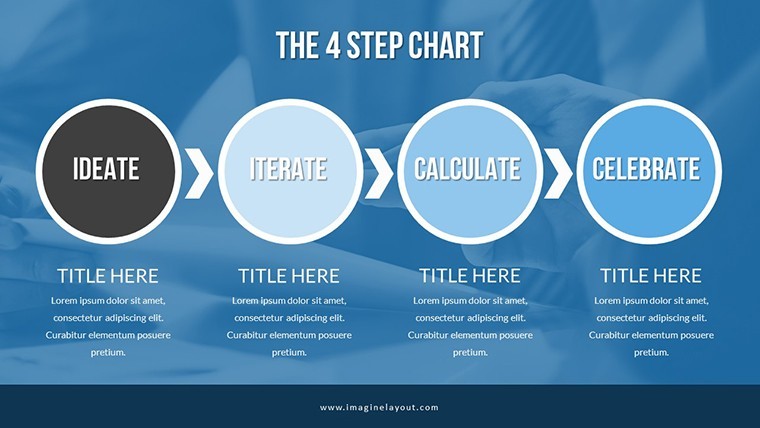
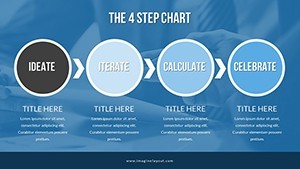
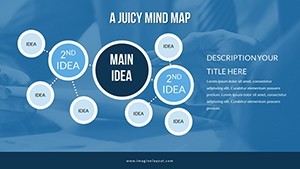
Action zone: Slides 12-17's cycle visuals loop through buyer journeys, arrows thickening with conversion rates. Customize loops with brand colors, add tooltips for hover stats. Closer? Slide 22's ROI pyramid builds layer by layer, capping with projected peaks - perfect for budget justifications.
Tweaks take seconds; a CMO testimonial: "Halved deck prep, doubled demo wow-factor."
Campaign Case Studies: From Clicks to Conversions
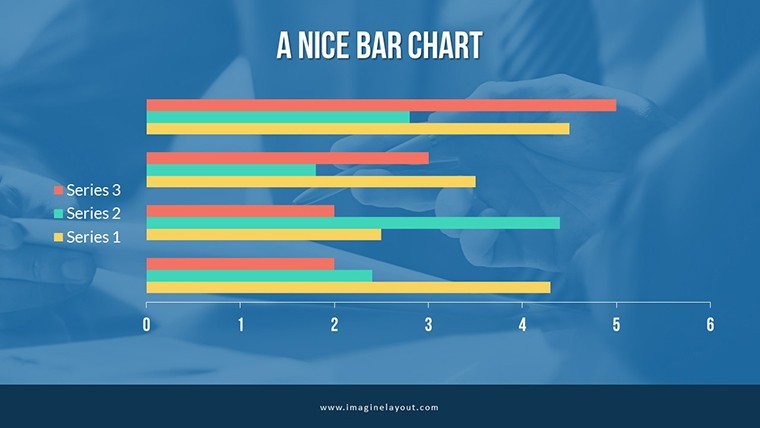
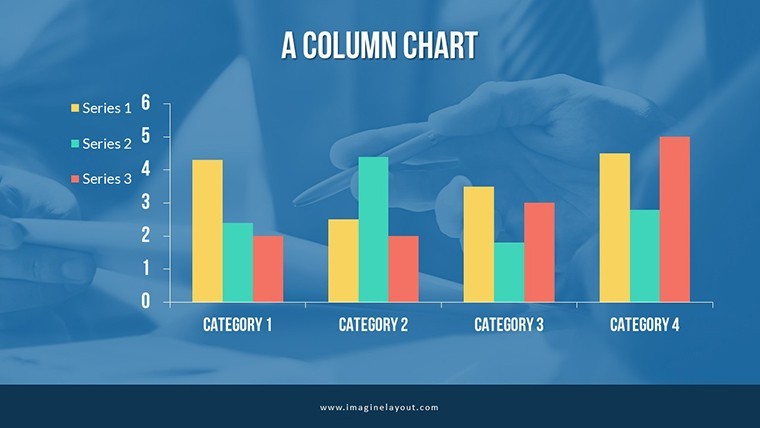
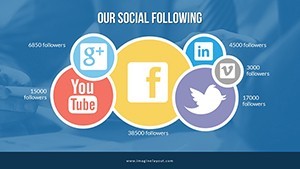
Digital pros know: Data dazzles when dramatized. For an e-comm brand auditing social ROI, harness Slide 10's bar showdowns - animate competitors' curves to crest and crash, spotlighting your edge. Layer in scatter plots for engagement correlations, editable points as clickable icons.
Email marketers, try funnel cascades (Slide 15): Stages drop like dominos, highlighting leak points with red flags. One agency integrated live API feeds, making decks pulse with fresh opens/clicks.
- Data Dump: Paste from Google Analytics; charts auto-populate.
- Brand Bind: Sync icons to your style guide - emojis for Gen Z vibes.
- Animate Impact: Sequence to simulate scroll paths, export MP4 for social recaps.
- Share Smart: Keynote Live for remote reviews, annotations included.
Outshines basic Excel? Infinitely - native animations and themes per HubSpot's viz best practices. A recent rollout? 25% faster client wins for users.
Integration Insights: Amp Up Your Arsenal
Sync with HubSpot or Mailchimp exports for auto-charts, embed YouTube embeds for case video walkthroughs. Tip: Cap data at 7 items per visual - aligns with Miller's Law for memory magic.
A freelance strategist raved: "From flat reports to funnel fireworks." Scales for solopreneurs tracking solo metrics or teams tackling omnichannel ops.
Launch Your Legacy: Secure the Template Today
Why wait for the next algorithm update? Arm your arsenal with this Digital Marketing Keynote Charts template - download instantly and decode success visually. Your campaigns deserve the spotlight; claim it now.
Frequently Asked Questions
Are the charts optimized for mobile viewing?
Yes, widescreen adapts fluidly; test in Keynote's preview for thumb-friendly tweaks.
Can I add live data sources?
Embed links to tools like Google Sheets for dynamic updates on reopen.
How editable are the pie charts?
Fully - drag wedges, recolor fills, and animate individually.
Does it include social media icons?
Over 40, from TikTok to LinkedIn, all vector-sharp.
What's the animation compatibility?
Works across Keynote versions, exporting cleanly to video formats.
Ideal for SEO-focused presentations?
Spot-on - timelines for keyword rollouts, pies for traffic sources.