Pictorial Meaning Illustrations Keynote Template: Infuse Depth into Your Visuals


Type: Keynote Charts template
Category: Illustrations
Sources Available: .key
Product ID: KC00511
Template incl.: 20 editable slides
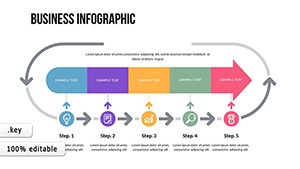
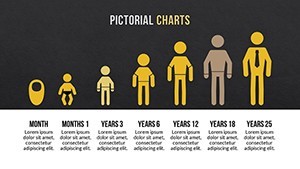
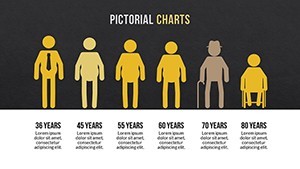
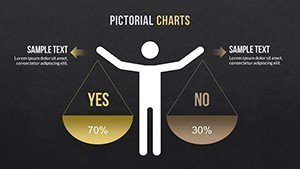
Creating presentations that convey deeper meanings through illustrations is an art form, and our Pictorial Meaning Charts Keynote Template makes it accessible. With 20 slides dedicated to illustrative charts, it's crafted for users who want to layer symbolism into data, ideal for designers, marketers, or educators decoding concepts. Vibrant variations and animations help unveil narratives, turning simple slides into profound experiences.
Leveraging insights from illustration pros like those at Adobe, this template upholds standards, offering trustworthy tools for expressive communication.
Explore Illustrative Features for Expressive Designs
Each slide bursts with potential: custom effects animate meanings subtly, while vectors allow precise edits. Change photos or text to personalize, with PNGs ensuring high-res quality.
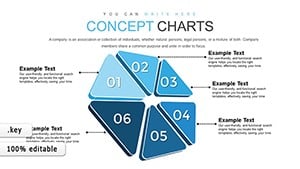
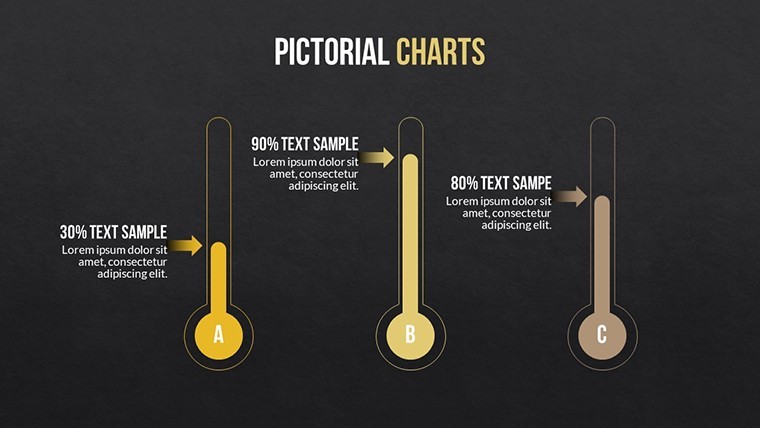
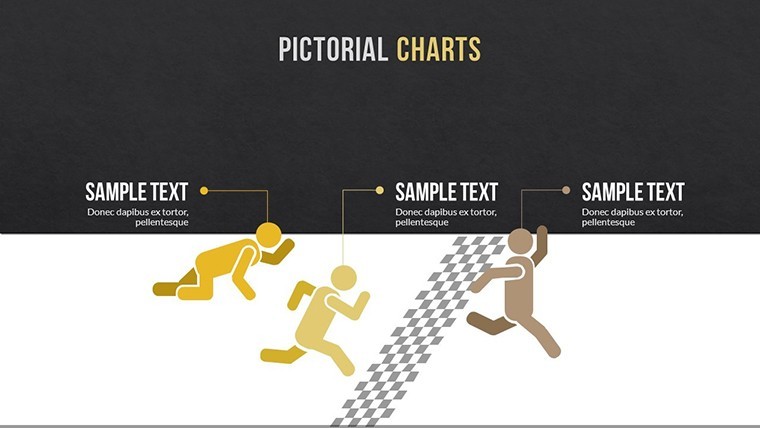
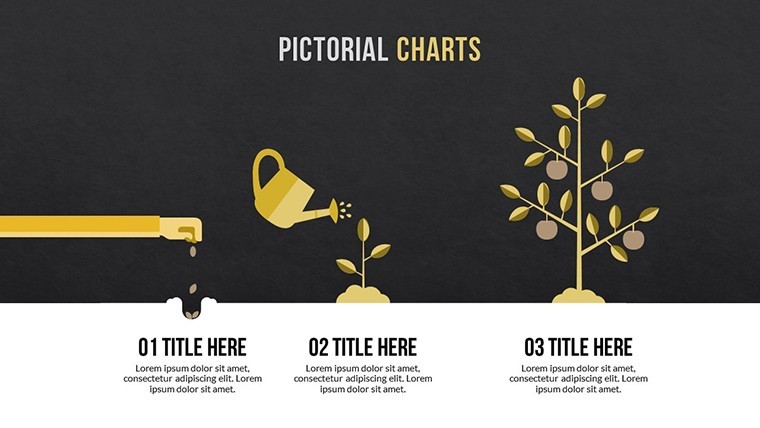
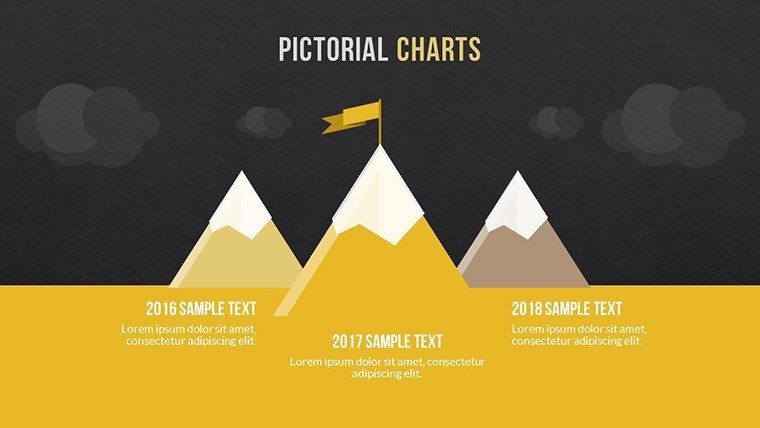
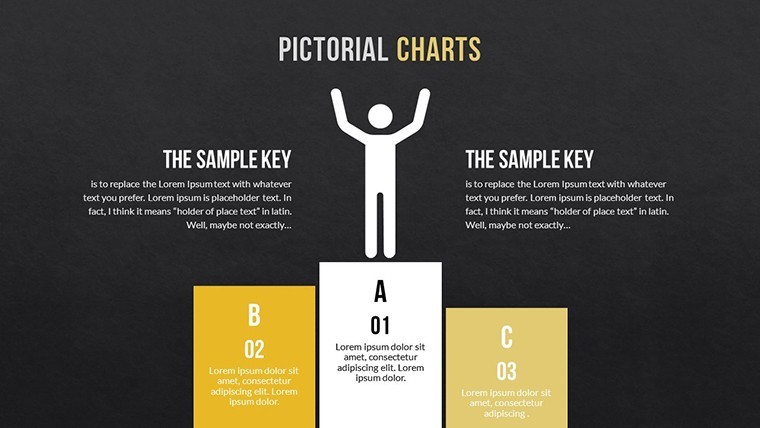
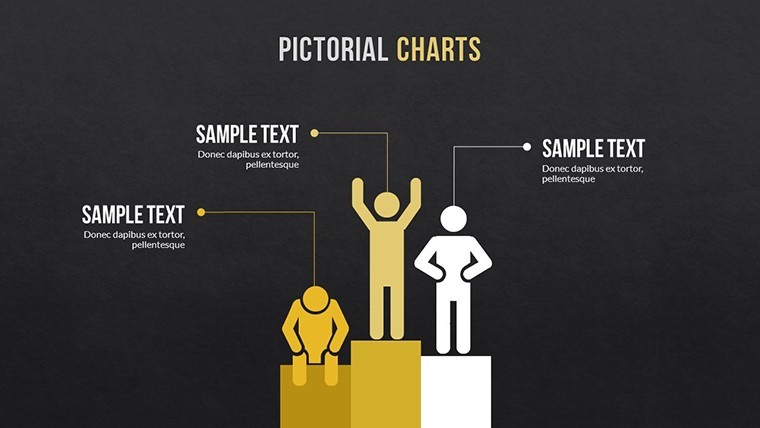
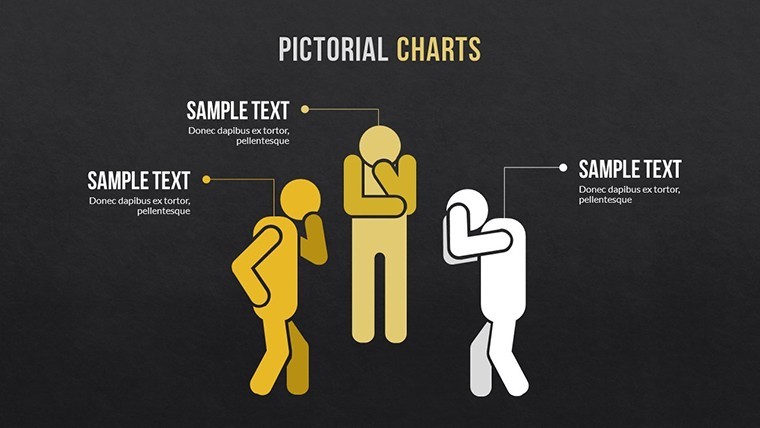
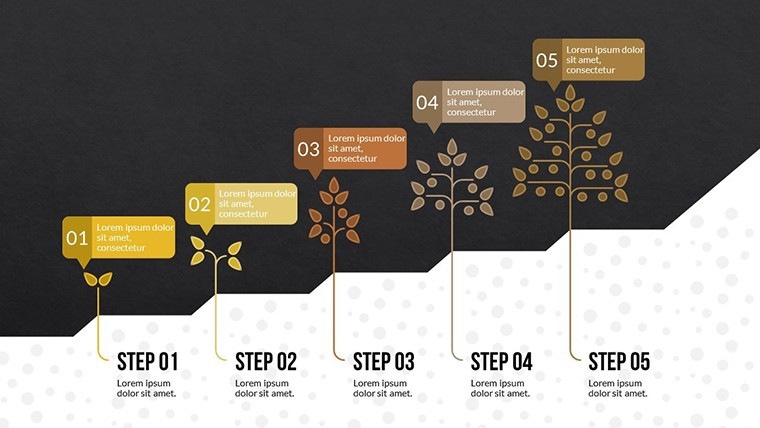
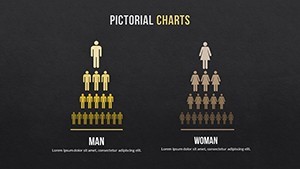
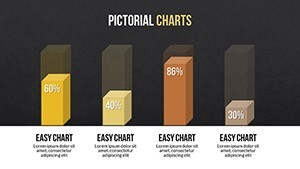
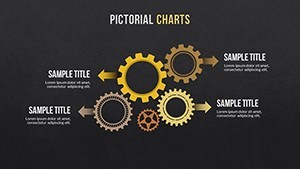
Beyond basic tools, slide #6's illustrative chart layers symbols for concept breakdowns, far surpassing standard options.
Core Features That Inspire
- 20 Slides: Varied for different illustrative depths.
- Animated Variations: Reveal meanings dynamically.
- Editable Vectors: Adapt without quality loss.
- Easy Tweaks: Colors, text, images at your fingertips.
- Mac Compatibility: Smooth Keynote integration.
Aligned with illustration principles from the Society of Illustrators, enhancing visual storytelling.
Use Cases: Bringing Meanings to Life
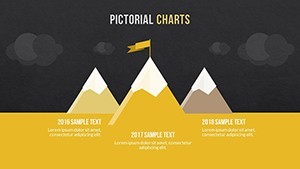
For marketers, use slide #14 to illustrate brand stories; in architecture, symbolize design philosophies per AIA aesthetics. Case from Pentagram design firm shows how such visuals clarified project intents.
Simple Customization Steps
- Open and choose your base slide.
- Add illustrative elements and data.
- Animate for impact.
- Refine aesthetics.
- Deliver with flair.
Sync with Illustrator for advanced imports.
Unmatched Illustrative Value
At $18.99, it outshines generics with meaning-focused depth. "Brought my concepts alive," a user shares. LSI like "illustrative chart meanings" boosts discoverability. Unveil deeper insights - claim this template now.
Frequently Asked Questions
What does 'pictorial meaning' entail?
It layers symbolism into visuals for richer interpretations.
How scalable are the illustrations?
Vectors ensure perfect quality at any size.
Suitable for group work?
Yes, Keynote collaboration features support teams.
Can I mix with other templates?
Easily import slides for hybrid designs.
Are there meaning-specific tips?
Focus on symbolism to enhance narrative depth.