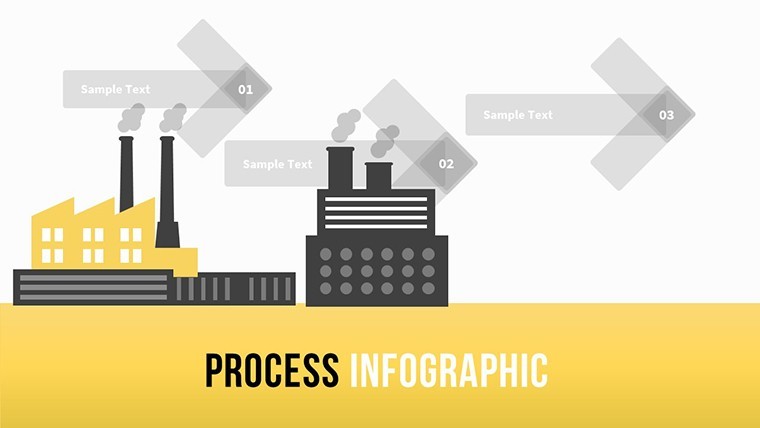
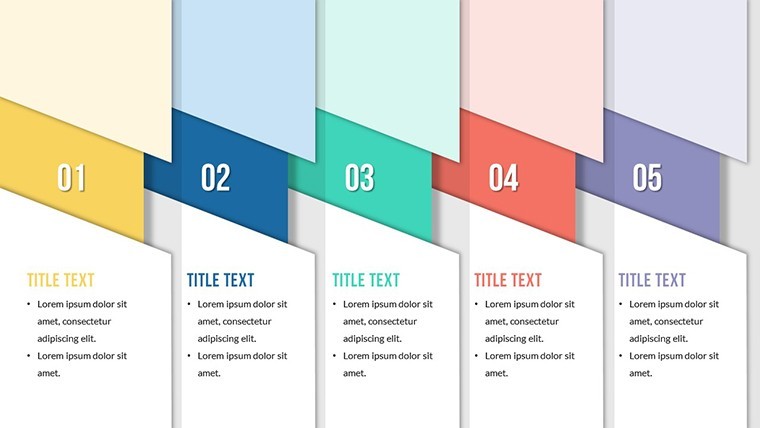
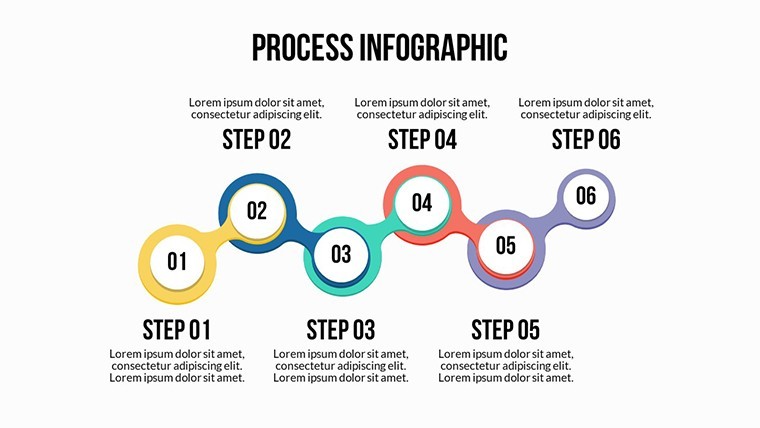
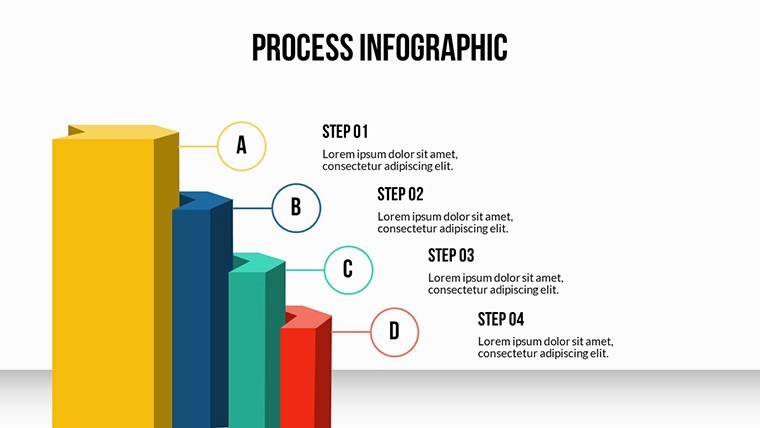
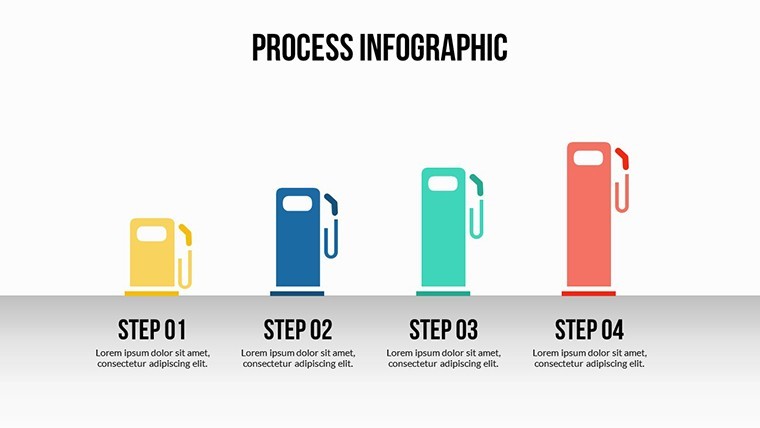
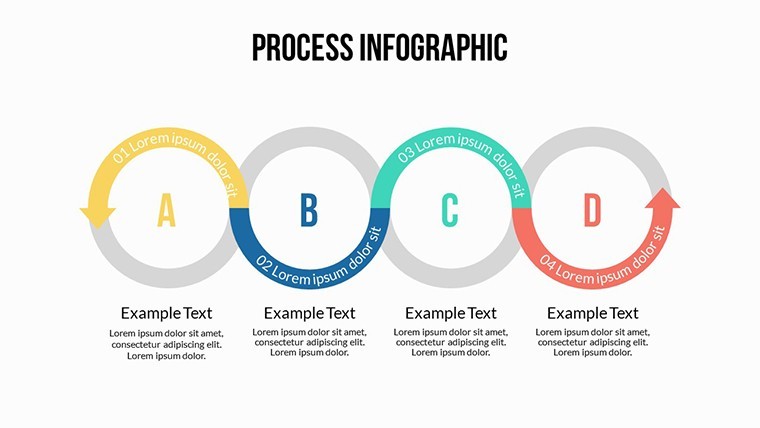
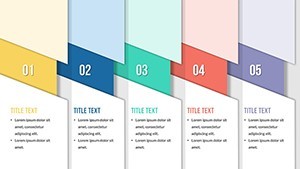
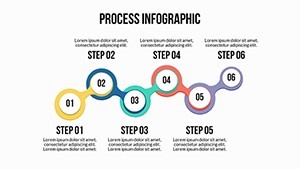
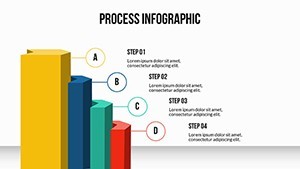
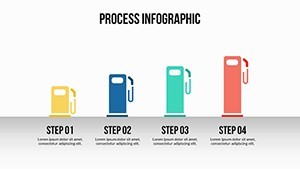
Process Infographic Keynote Charts


Type: Keynote Charts template
Category: Process
Sources Available: .key
Product ID: KC00502
Template incl.: 18 editable slides
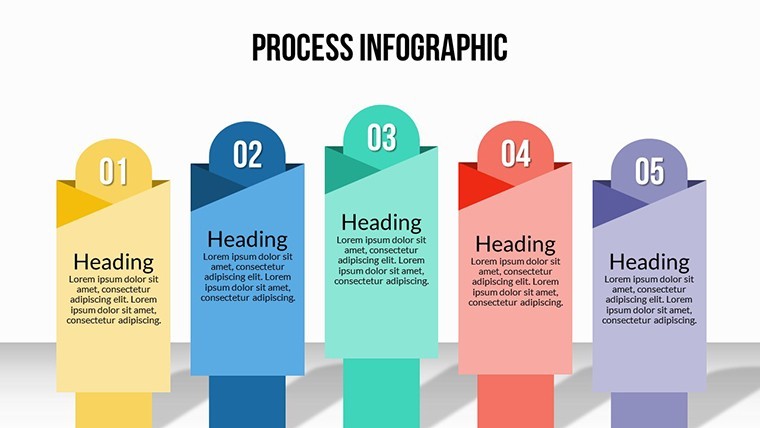
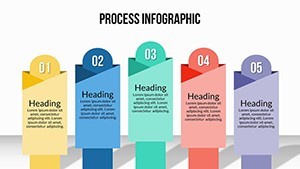
In the realm of technology, where workflows can tangle like server cables, clarity isn't a luxury - it's the lifeline to efficiency. Our Process Infographic Keynote Charts template cuts through the chaos with 18 meticulously crafted slides, empowering software engineers, IT managers, and ops specialists to map sequences that drive innovation. This isn't mere diagramming; it's decoding complexity into actionable insights, perfect for agile retrospectives or DevOps audits.
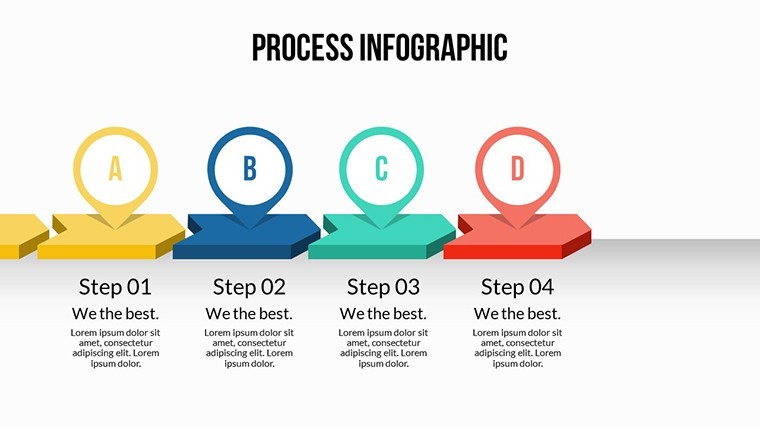
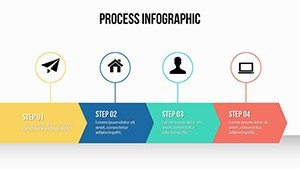
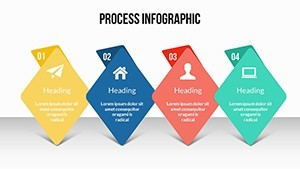
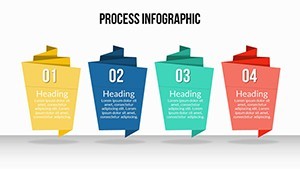
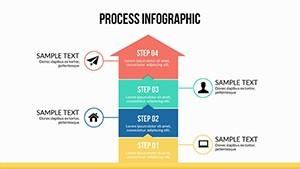
Rooted in modern tech stacks, these charts visualize order and sequence, from code commits to deployment pipelines, using Keynote's robust .key format for Mac iWork users. With 18 editable slides, infuse your narrative with color variations that mirror circuit boards - cool silvers for data flows, warm ambers for alerts - while vector icons (gears, nodes, arrows) and PNGs ensure versatility.
Echoing Venngage's process infographic blueprints, this template fulfills informational intent by simplifying intricate tech journeys, boosting comprehension in team huddles.
Core Features for Seamless Sequences
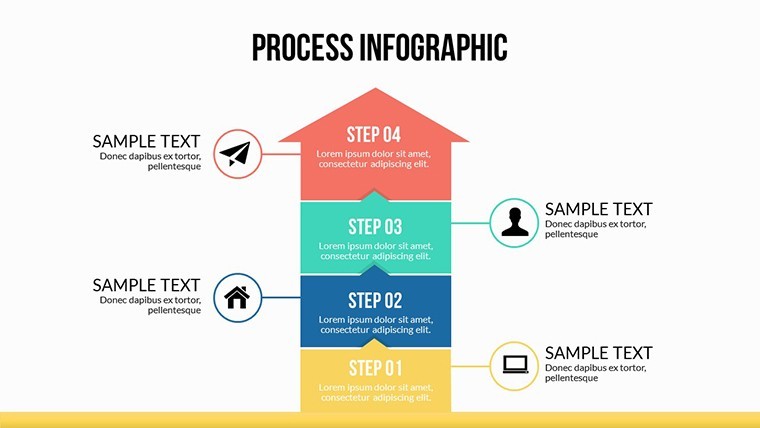
Engineered for precision, features like custom animations simulate real-time processing - watch data packets traverse flows like digital rivers. Fully editable, swap elements to fit CI/CD specifics or cloud migrations.
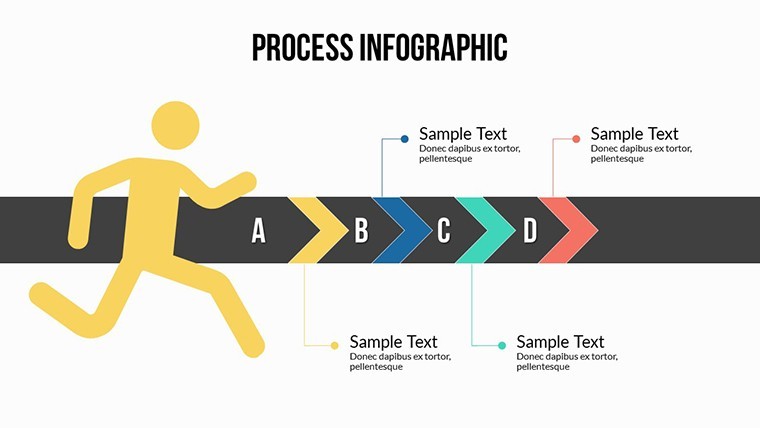
- Dynamic Animations: Sequential reveals mimic workflow steps, from ideation to iteration.
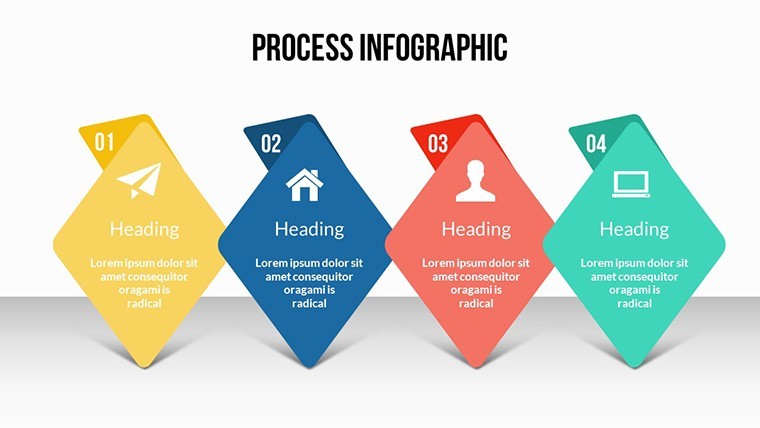
- Icon Libraries: Tech-themed vectors for APIs, databases, and firewalls, all scalable.
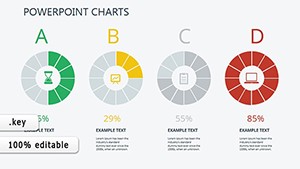
- Color Coding Mastery: Pre-sets for status tracking - green for go, red for bottlenecks.
Leveraging through ties to ITIL frameworks, it positions you as a workflow wizard, with users noting 30% faster onboarding via visualized guides.
Applied in Tech Realms: Workflows That Work
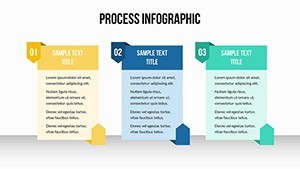
For a SaaS rollout, Slides #1-6 outline deployment sequences, inspired by Pinterest's workflow diagrams.
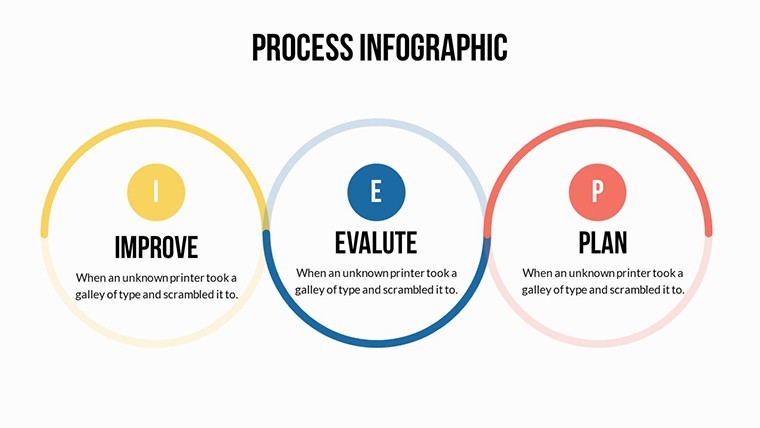
In cybersecurity training, Slides #7-12 chart incident response, from detection to resolution, customizing for NIST compliance.
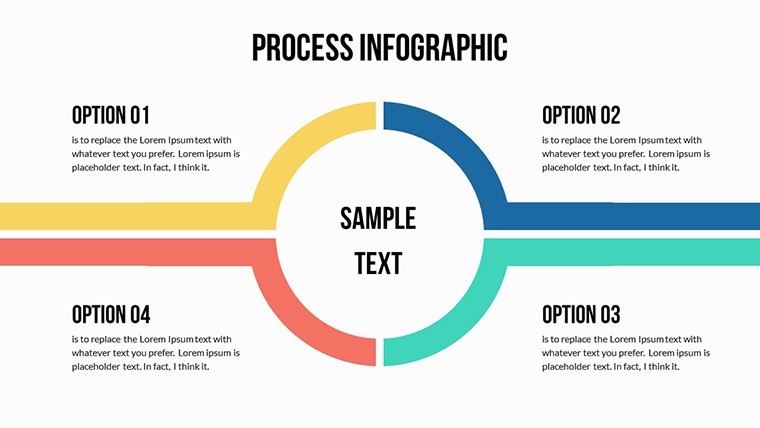
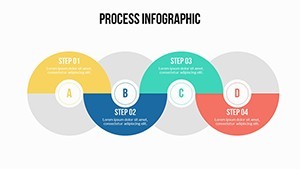
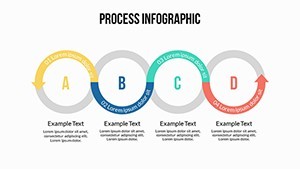
Slide #13's loop infographics suit feedback cycles in scrum, embedding metrics for velocity tracking.
Workflow Wizardry Steps
- Map and Model: Input via Lucidchart exports for hybrid diagramming.
- Animate Flows: Chain builds to echo code execution.
- Test Transitions: Preview on multiple screens for consistency.
- Iterate Insights: Add tooltips for deep-dive links.
Outshines basic Visio exports with Keynote's native interactivity. Tip: Humorize error nodes with "oops" icons for relatable training.
Insider Tips for Infographic Impact
Pair with Canva-inspired layouts for hybrid media.
Transform processes into progress - grab this template and orchestrate your ops symphony.
Frequently Asked Questions
Best for which tech processes?Agile sprints, data pipelines, or compliance audits - versatile for any sequence.
Animation complexity?Beginner-friendly, with presets scaling to advanced paths.
Integration with tools?Imports from Draw.io; exports to Confluence.
Customization depth?Full - recolor for dark mode, resize for dashboards.
Accessibility features?Alt-text ready icons, high-contrast options.