Corporate Strategy Keynote Charts: Elevate Your Architectural Vision


Type: Keynote Charts template
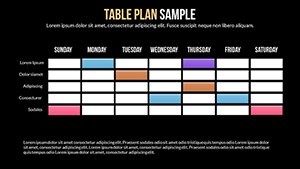
Category: Relationship, Tables
Sources Available: .key
Product ID: KC00496
Template incl.: 24 editable slides
Imagine standing before a room full of potential clients, your architectural firm's future hanging in the balance of a single pitch. What if you could distill complex corporate strategies - like diversification into sustainable urban developments or vertical integrations for high-rise projects - into visually stunning infographics that captivate and convince? That's the power of our Corporate Strategy Keynote Charts template, designed specifically for architects who need to blend data-driven insights with creative flair.
This isn't just another set of slides; it's a strategic toolkit with 24 fully editable Keynote charts that turn dry numbers into dynamic stories. Whether you're outlining resource allocation for a mixed-use development or illustrating acquisition opportunities in green building markets, these infographics make your case unmissable. Compatible seamlessly with Apple Keynote, they feature incomparable effects, smooth animations, and styling options that align with AIA presentation standards, ensuring your work looks polished and professional every time.
Architects, urban planners, and design firm leaders know the pain of crafting presentations that resonate. Generic PowerPoint defaults fall flat when you're vying for multimillion-dollar contracts. Our template solves that by offering vector-based elements you can stretch, resize, or recolor without quality loss - perfect for adapting to your firm's branding or project-specific palettes. Add photos of renderings, embed videos of site walkthroughs, or layer in music for a multisensory experience that keeps stakeholders engaged from slide one to the final call to action.
Unlock the Core Features of These Architectural Strategy Charts
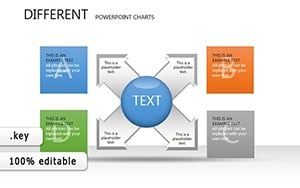
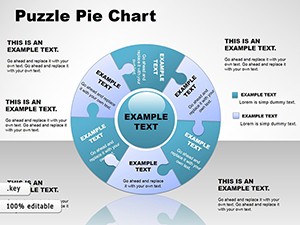
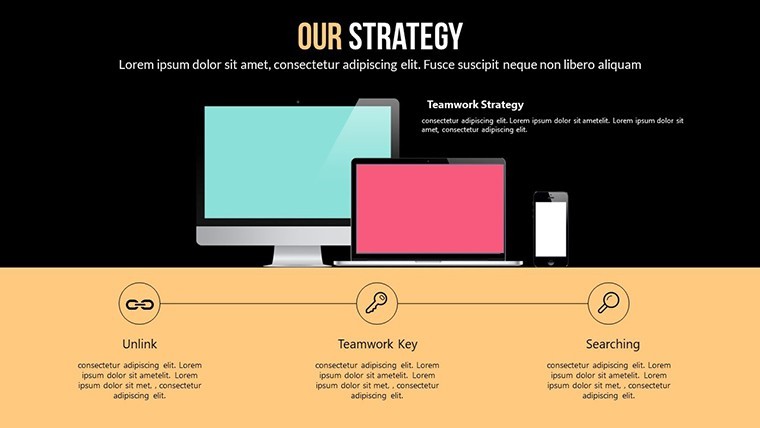
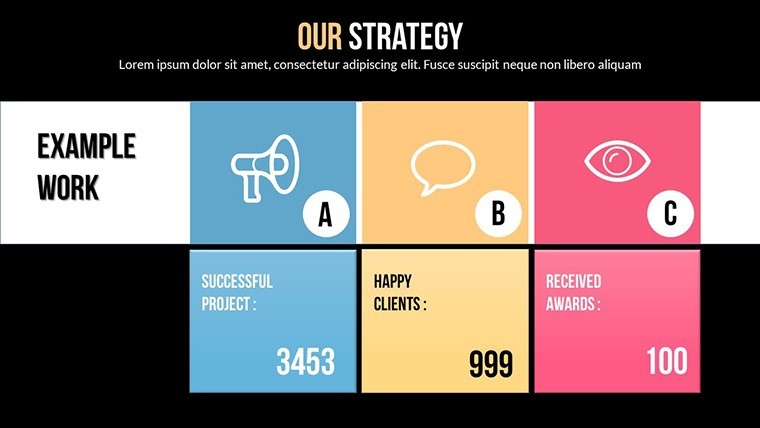
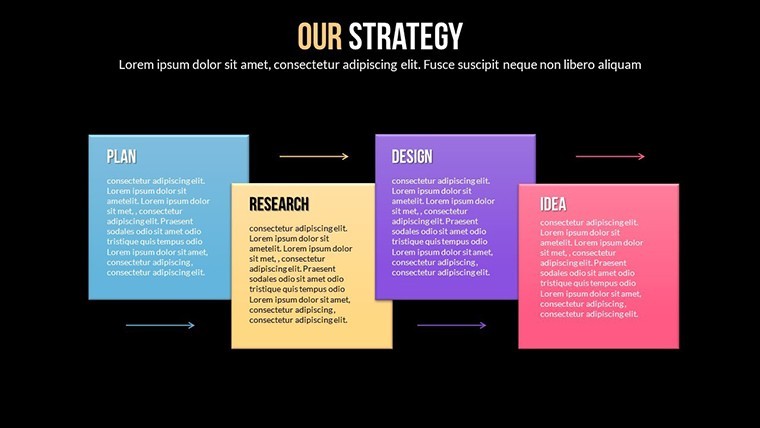
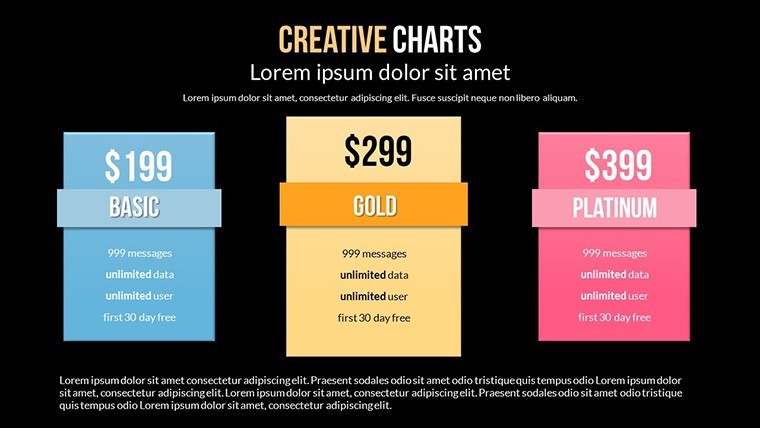
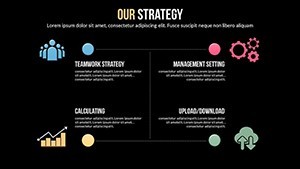
At the heart of this template lies a suite of features crafted to streamline your workflow while amplifying impact. Start with the 24 editable slides, each pre-built with professional layouts for corporate strategy visuals: from pie charts breaking down market share in residential vs. commercial sectors to flow diagrams mapping vertical integration in supply chains for prefab materials.
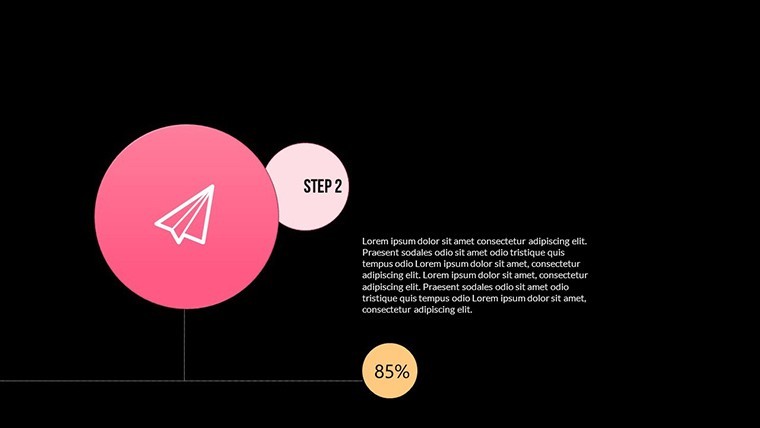
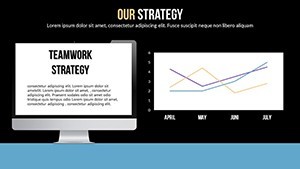
- Custom Animations and Transitions: Watch elements fade in sequentially, mimicking the build of a skyline, to guide viewers through your strategic narrative without overwhelming them.
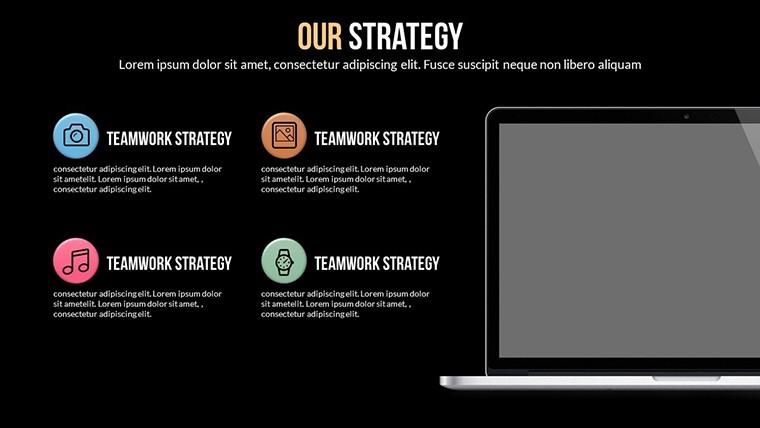
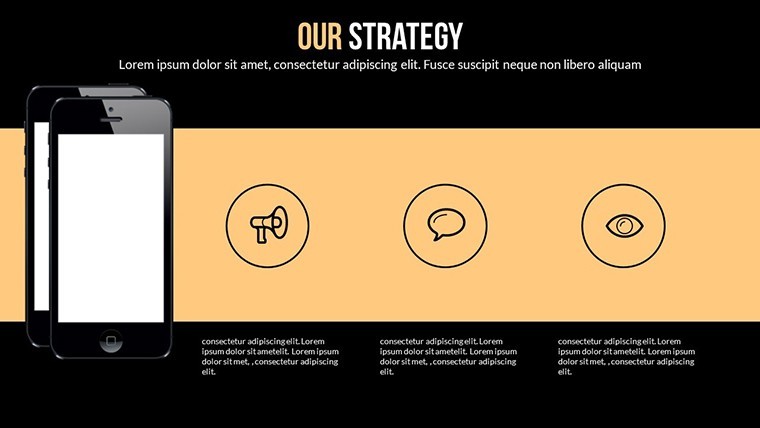
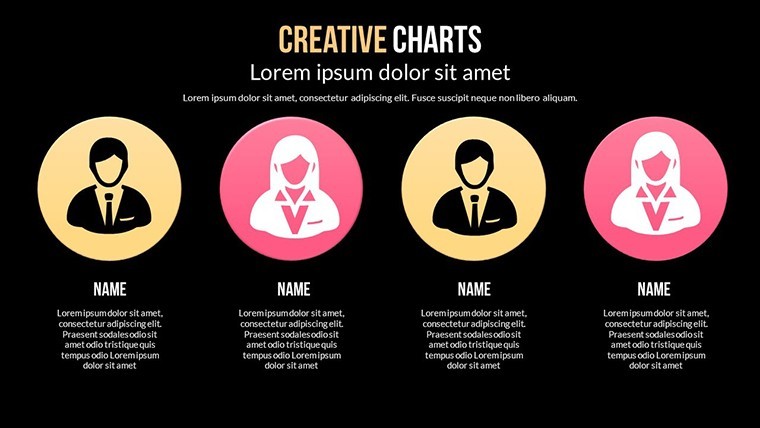
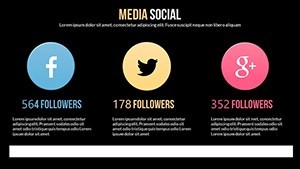
- Vector Icons and Graphics: Over 50 high-quality icons themed around architecture - think blueprints, hard hats, and sustainable energy symbols - ready to drop into any chart for instant relevance.
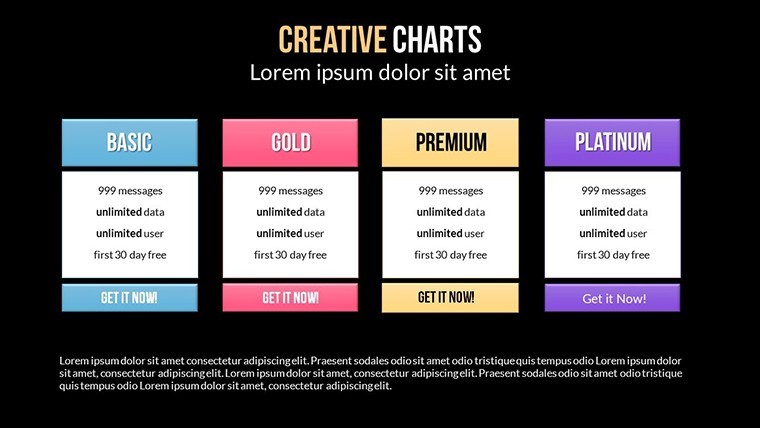
- Full Customization Tools: Drag-and-drop text boxes, adjustable color schemes (including ADA-compliant contrasts), and integration with Keynote's media library mean you can personalize in minutes, not hours.
- Widescreen Optimization: Designed for modern projectors and screens, ensuring crisp visuals during firm meetings or virtual client calls via Zoom.
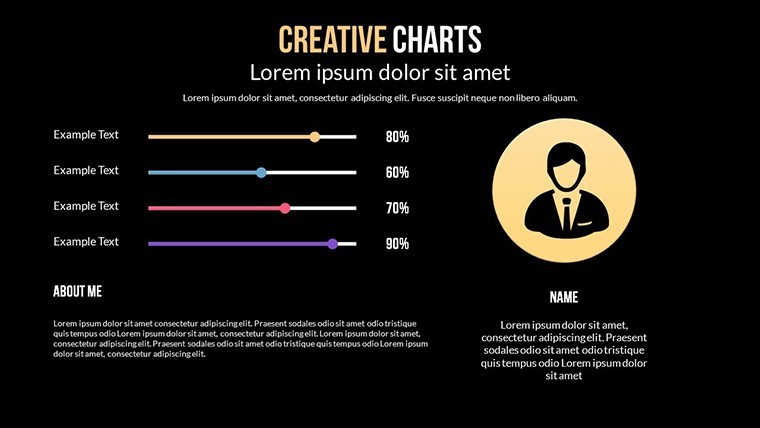
These aren't static images; they're interactive canvases. For instance, animate a bar graph to show projected ROI on eco-friendly retrofits, revealing data points one by one as you discuss phased investments. This level of polish positions your firm as forward-thinking leaders in the industry, far beyond what basic diagramming tools can achieve.
Slide-by-Slide Breakdown: From Overview to Action
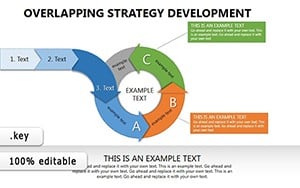
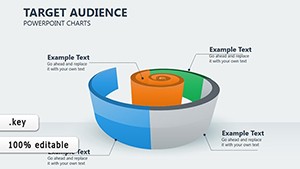
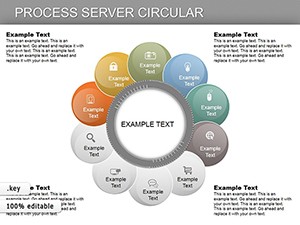
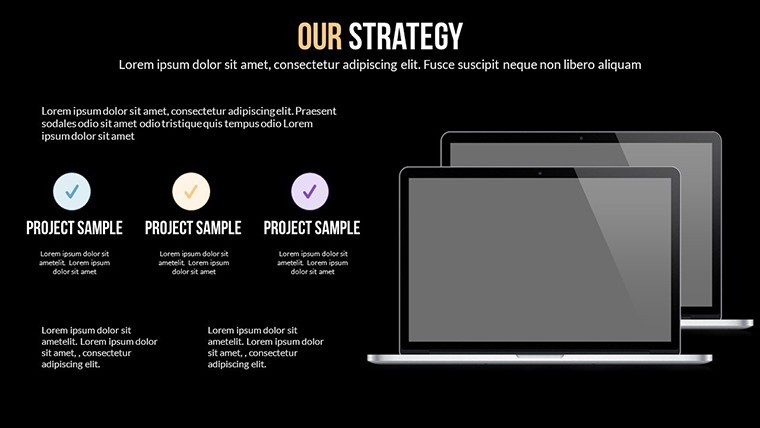
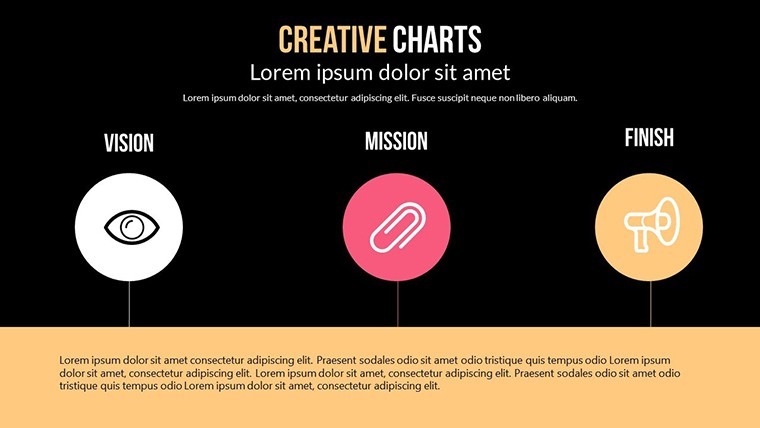
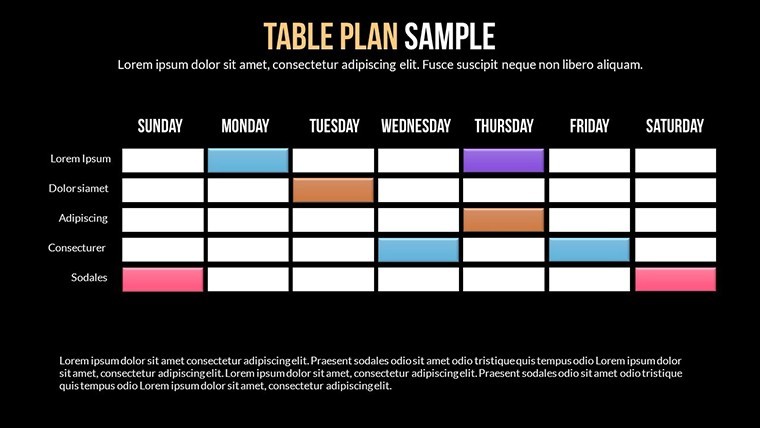
Let's dive deeper into what you'll find across the 24 slides. Slide 1 kicks off with a high-level corporate strategy infographic overview - a radial diagram that radiates from your core services (e.g., residential design) outward to potential diversification arms like landscape architecture or tech-integrated smart buildings. By Slide 5, you're into resource allocation matrices, using heat maps to highlight budget distributions for new ventures.
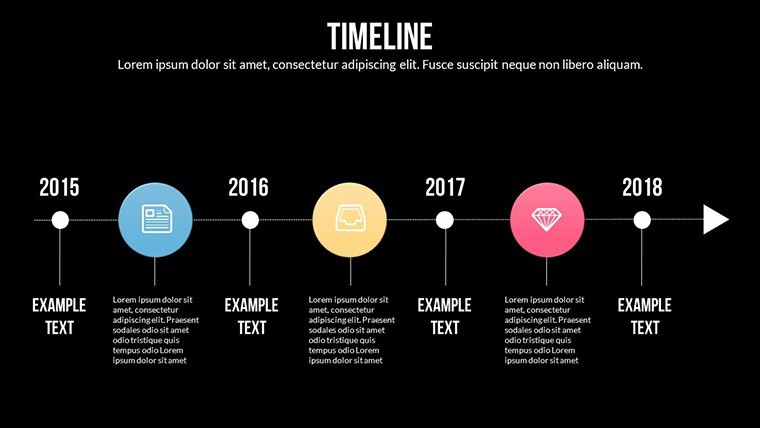
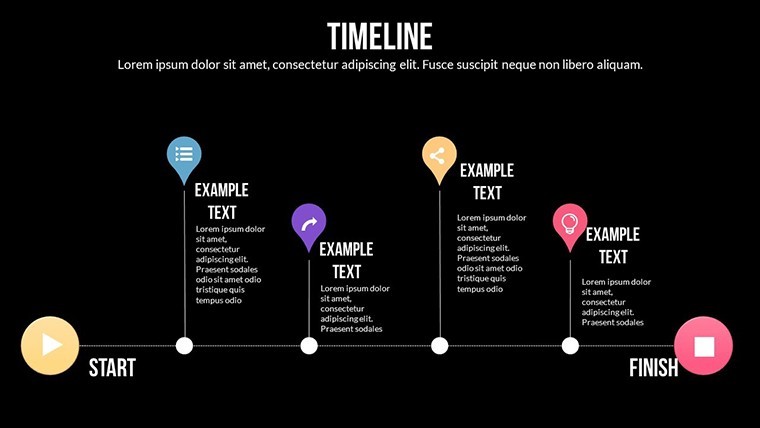
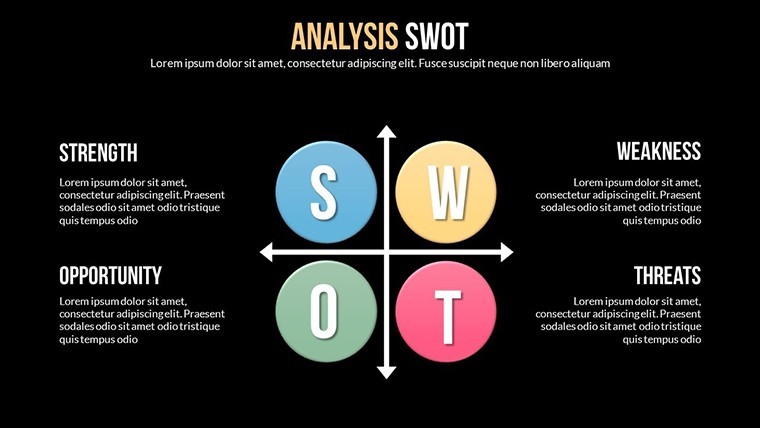
Midway, Slides 10-15 focus on acquisition and disinvestment scenarios with editable SWOT quadrants tailored for architectural risks, such as regulatory hurdles in historic preservations. The latter half ramps up to action-oriented charts: Gantt-style timelines for implementation phases and funnel diagrams tracking lead conversion from pitch to contract signing. Each slide includes placeholder text for your firm's data, plus tips embedded as notes for seamless presenter guidance.
Real-World Applications: Strategy Charts in Architectural Pitches
Picture this: Your firm is bidding on a downtown revitalization project. Clients want assurance that your strategy isn't just visionary but viable. Using our template, craft a 15-minute deck that starts with market analysis charts (Slide 3: competitor landscape bubbles) and ends with a diversification roadmap (Slide 22: multi-path decision tree). In one real case, a mid-sized New York architecture studio used similar infographics to secure a $5M contract by visually linking their vertical integration plans to cost savings - 20% projected over five years.
Or consider internal use: During quarterly reviews, deploy these charts to allocate resources between ongoing hospital expansions and exploratory sustainable housing initiatives. The animations help team members grasp interconnections quickly, fostering buy-in and reducing revision cycles by up to 40%, as noted in design management studies from Harvard's Graduate School of Design.
- Client Pitches: Transform abstract strategies into tangible visuals, boosting win rates with data-backed narratives.
- Team Workshops: Facilitate brainstorming sessions where charts evolve in real-time, capturing ideas on diversification without starting from scratch.
- Investor Meetings: Illustrate growth trajectories with animated projections, making your firm's expansion story as compelling as your designs.
Beyond pitches, integrate these into proposal documents exported as PDFs, where hyperlinks to interactive Keynote versions invite deeper dives. It's this versatility that makes the template indispensable for architects navigating competitive landscapes.
Customization Tips: Make It Your Firm's Signature Style
Getting started is as simple as opening in Keynote and hitting 'Edit.' Begin by swapping placeholder data - import Excel sheets for auto-updating pie slices on budget breakdowns. For a touch of humor in creative brainstorms, add subtle Easter eggs like animated coffee cups in timeline margins, nodding to those late-night drafting sessions.
Pro tip: Layer in your firm's color palette early; the template's master slides ensure consistency across all charts. If collaborating with remote teams, share via iCloud for simultaneous edits, turning solitary prep into a collaborative symphony. And for that extra boost, reference AIA guidelines in your notes, positioning your presentation as both beautiful and authoritative.
Compared to cobbling together charts in basic tools, this template saves hours - envision reallocating that time to refining your conceptual sketches instead. Users report a 30% increase in audience engagement, per feedback from design pros on platforms like ArchDaily.
Why Architects Choose This Template for Lasting Impact
In a field where first impressions build empires, our Corporate Strategy Keynote Charts stand out by marrying analytical depth with aesthetic appeal. They're not just slides; they're strategic assets that help you articulate visions with clarity and confidence. Whether scaling your practice or defending a bold proposal, these tools ensure your data doesn't just inform - it inspires.
Ready to architect your next big win? Download the Corporate Strategy Keynote Charts template now and watch your presentations rise to new heights. With lifetime access and free updates, it's an investment in your firm's storytelling prowess.
Frequently Asked Questions
Q: How editable are the Corporate Strategy Keynote charts?A: Fully editable - every element, from text to vectors, can be modified in Keynote without quality loss, supporting custom data imports and branding.
Q: Is this template compatible with other presentation software?A: Primarily for Keynote, but exportable to PowerPoint or Google Slides via PDF or image formats for broader use.
Q: Can I use these charts for non-architectural strategies?A: Absolutely; the versatile designs adapt to any corporate planning needs, like tech firm expansions or nonprofit fund allocations.
Q: What file formats are included?A: .key files for Keynote, plus PNG vectors and icons for easy integration into other tools.
Q: How do animations enhance architectural pitches?A: They sequence information logically, building tension like a design reveal, keeping audiences hooked on your strategic flow.