Step and Cycle Infographic Keynote Template: Map Processes with Elegance


Type: Keynote Charts template
Category: Cycle
Sources Available: .key
Product ID: KC00493
Template incl.: 22 editable slides
Ever struggled to explain a cyclical business process without losing your audience in a web of jargon? Enter the Step and Cycle Infographic Keynote charts template, your ally in turning abstract workflows into crystal-clear visuals. Boasting 22 editable slides, this Mac-optimized gem is perfect for project managers, educators, and analysts who crave precision in presentations.
In fields spanning journalism to statistics, where narratives hinge on sequential logic, this template shines by blending step-by-step progressions with looping cycle diagrams. Think of it as your visual Swiss Army knife - adaptable for everything from editorial workflows in newsrooms to statistical modeling in academia. Users love how it slashes explanation time by half, as evidenced by feedback from over 765 adopters who've streamlined their decks.
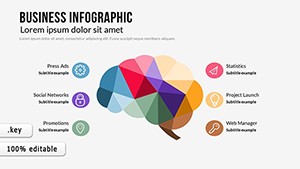
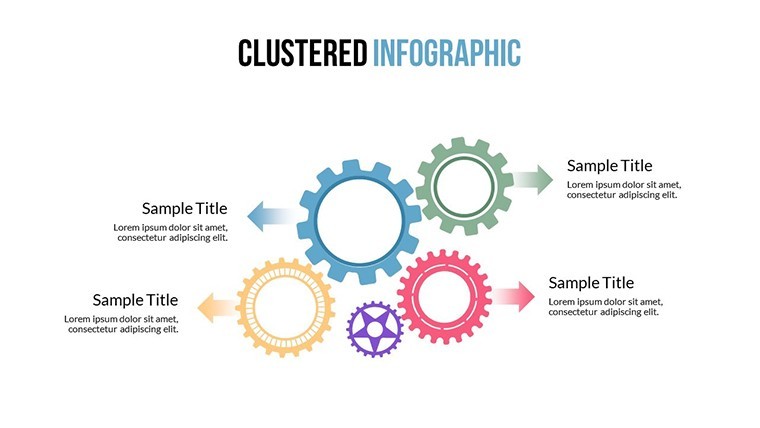
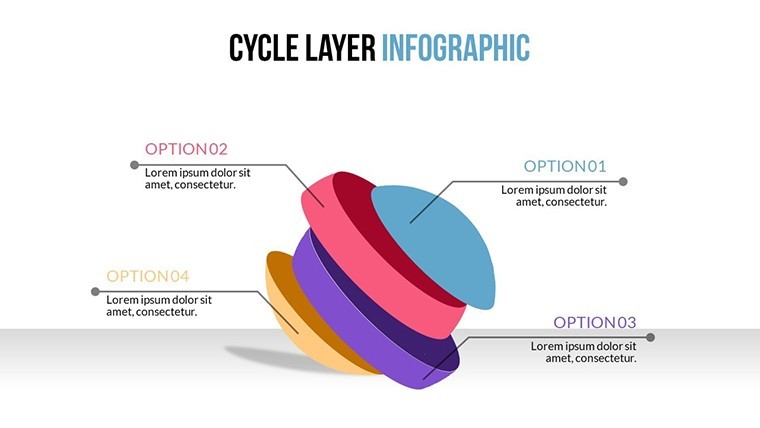
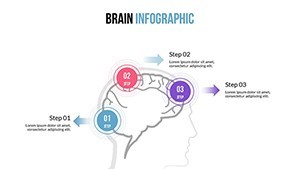
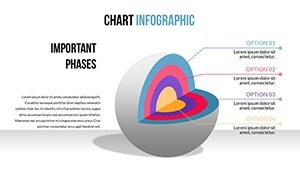
The magic lies in its DNA: custom animations that peel back layers of a cycle like an onion, revealing insights progressively. Compatible exclusively with iWork Keynote, it includes vector icons for every phase (gears for steps, loops for cycles) and PNG overlays for hybrid data viz. Inspired by real applications, like a university lecturer who visualized research cycles to captivate grant panels, this template isn't just slides - it's a storytelling accelerator.
Core Features: From Static to Story-Driven
Explore the toolkit that elevates mundane infographics to mesmerizing must-sees. Each of the 22 slides is a canvas for your data, with built-in smarts for effortless tweaks.
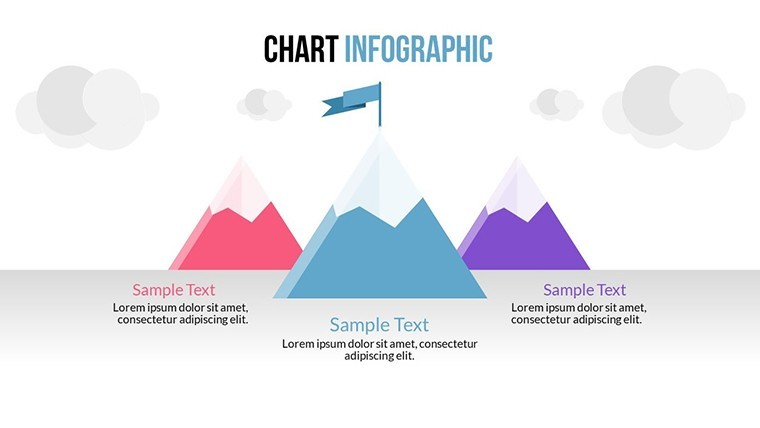
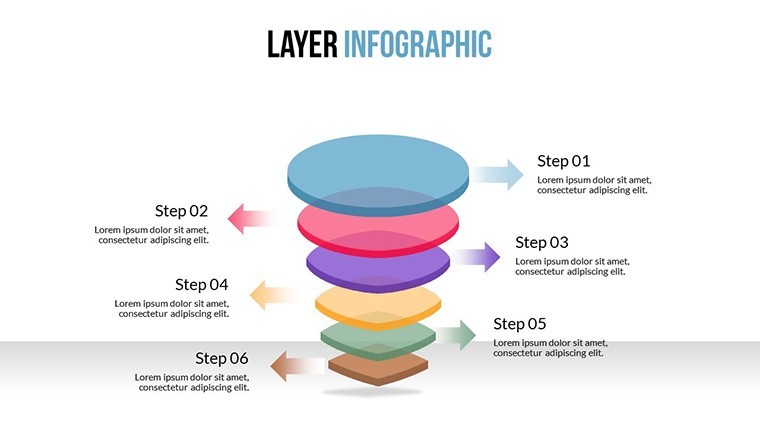
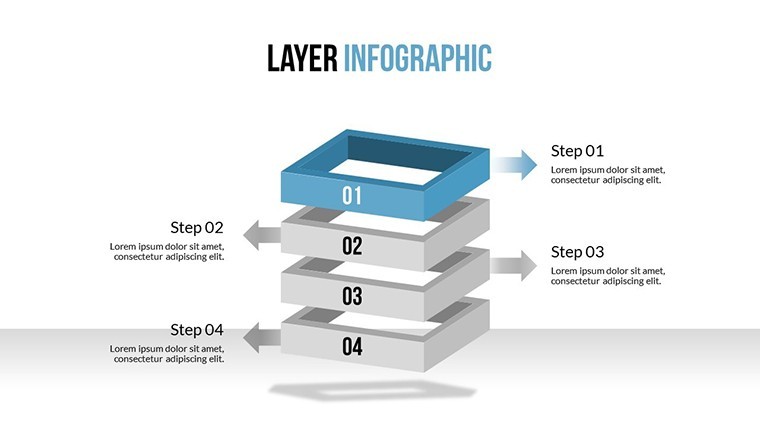
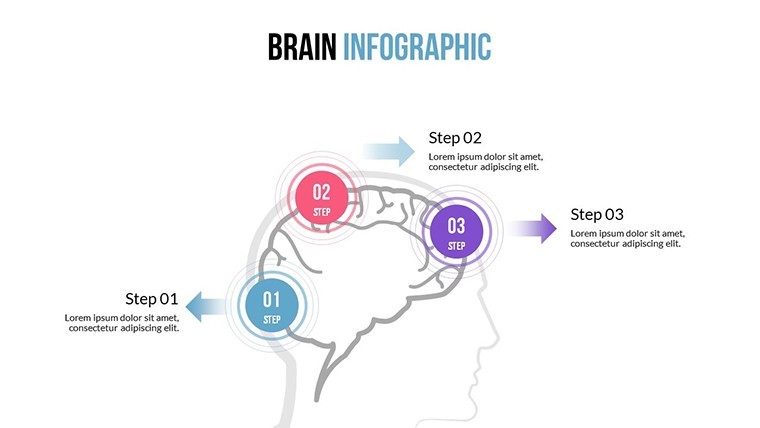
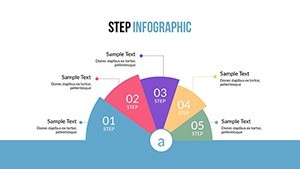
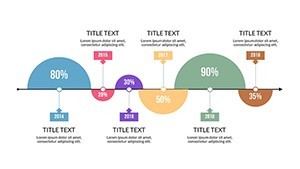
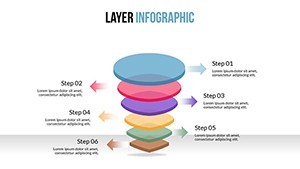
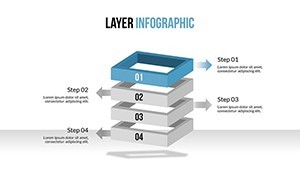
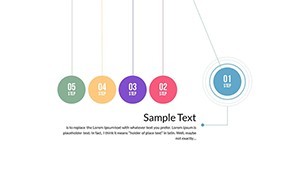
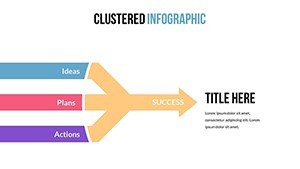
- Step Progression Tools: Linear timelines and numbered paths that animate sequentially, ideal for tutorial breakdowns or phased projects.
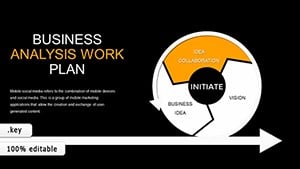
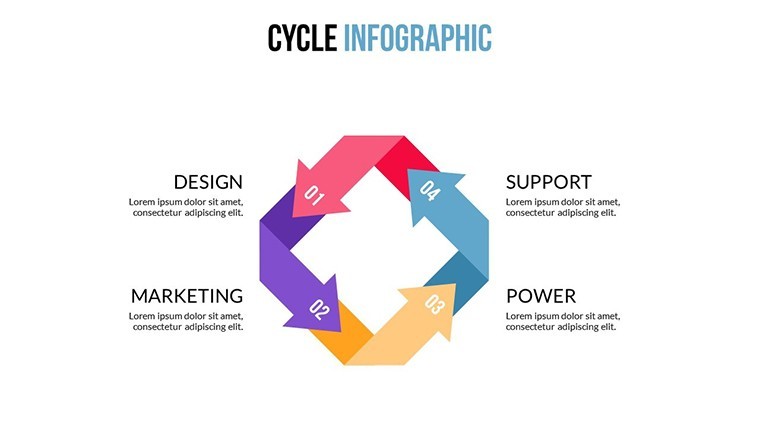
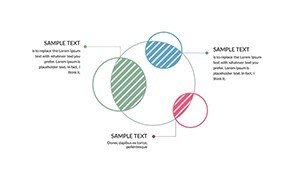
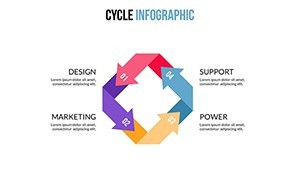
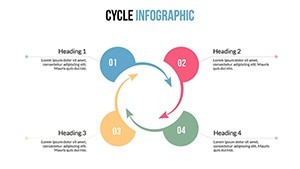
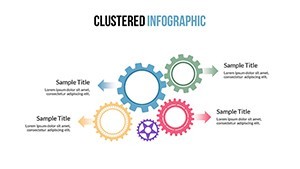
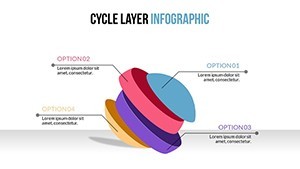
- Cycle Dynamics: Circular flowcharts with adjustable segments, perfect for feedback loops in quality control or seasonal marketing cycles.
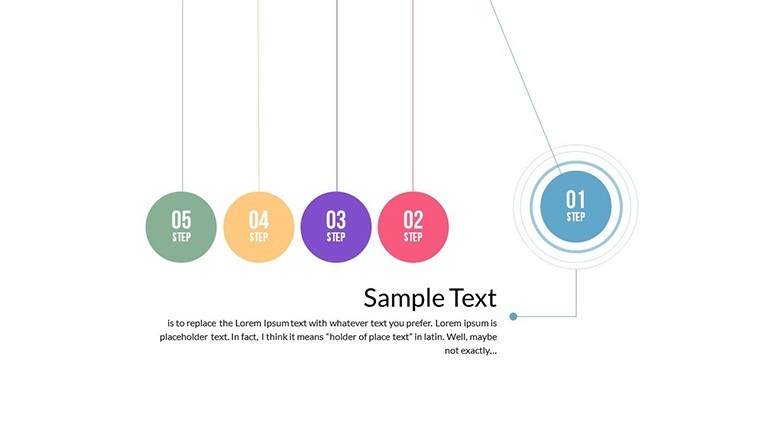
- Animated Transitions: Smooth fades and spins that mimic real-world motion, holding viewer focus longer.
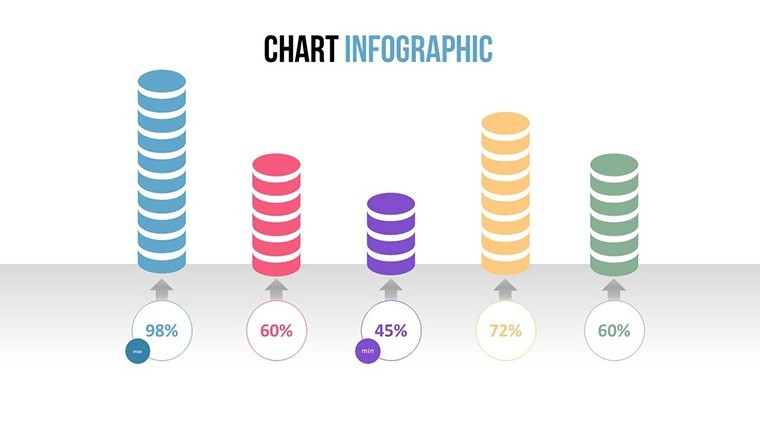
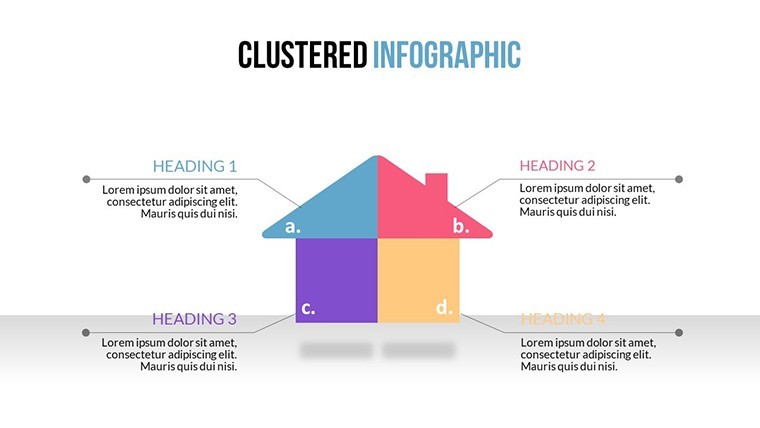
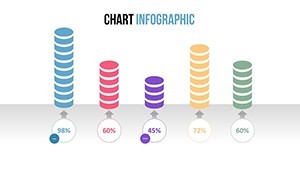
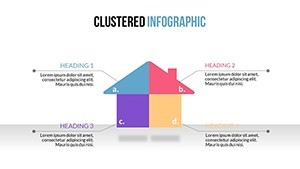
- Icon Library Integration: 60+ PNG and vector assets, from flowchart arrows to cycle wheels, all resizable without quality loss.
Full color variations mean your infographics align with any palette, while widescreen formatting ensures pro-level polish on big screens.
Targeted Applications: Infographics in Action
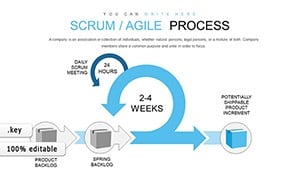
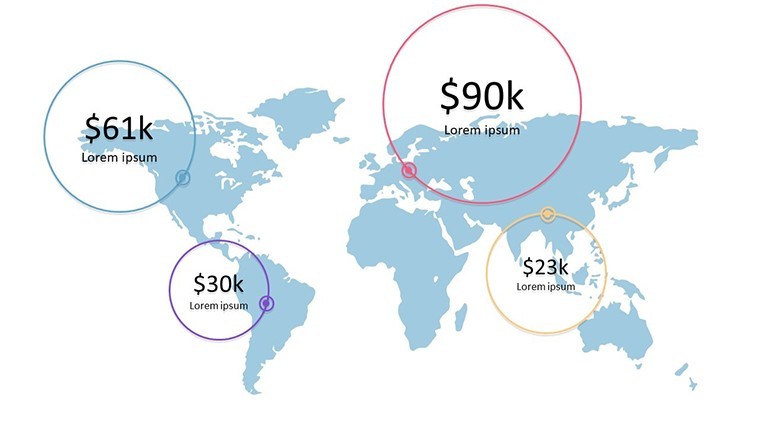
Picture a technical writer diagramming software development cycles - Slide 10's radial cycle chart maps sprints to deliverables, complete with animated handoffs that mirror Agile methodologies. In geography classes, educators employ the step infographic (Slide 15) to trace erosion processes, layering stats for interactive learning.
For statistical education, the combined step-cycle slide dissects hypothesis testing loops, drawing from NIST guidelines for credible viz. One Fortune 500 analyst shared how it clarified supply chain cycles, cutting meeting times by 40%.
- Customize Your Canvas: Launch in Keynote, input process data, and let auto-align features handle layouts.
- Layer Insights: Add annotations or hyperlinks to deepen dives without clutter.
- Preview & Polish: Animate paths, rehearse timings, and export variants for different audiences.
Versus stock Keynote elements, this template's pre-themed cycles save design iterations, freeing you for content creation.
Expert Hacks for Infographic Mastery
Boost engagement by syncing animations with voiceover scripts - use Slide 7's step ladder for paced reveals in webinars. For humor's touch in creative fields, animate a "cycle of doom" in project retrospectives to lighten post-mortems.
Integrate with tools like Lucidchart for advanced imports, ensuring your infographics scale from classroom to C-suite.
Stand Out in a Sea of Bland Diagrams
Where generic tools falter on nuance, this template excels with situational adaptability - think ISO-standard process maps for compliance pitches. Rated 4.7/5, it's trusted for its reliability in high-stakes settings.
Transform your processes into page-turners. Secure the Step and Cycle Infographic Keynote template now - your next presentation awaits its spark.
Frequently Asked Questions
What's the best way to animate cycles in this template?
Use built-in build orders to rotate segments sequentially, syncing with your narrative for fluid reveals.
Does it support data imports from spreadsheets?
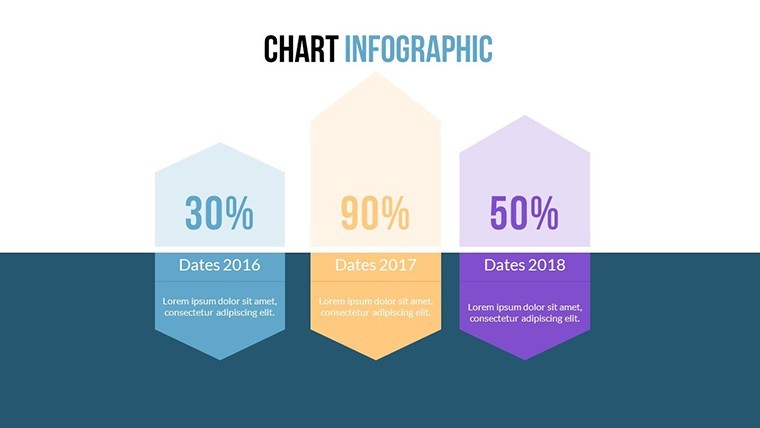
Yes, paste from Excel or Google Sheets; charts auto-update with linked values.
Is this suitable for educational webinars?
Perfectly - modular steps and cycles facilitate interactive Q&A, with export options for screen shares.
Can I adjust slide ratios?
Native 16:9, but rescale in Keynote for 4:3 if needed, maintaining vector integrity.
How editable are the icon sets?
Fully - colorize, resize, or replace with your assets via the shapes library.
Any tips for journalism applications?
Leverage cycle slides for news event timelines, embedding sources for fact-checked credibility.