TOP Business Keynote Charts: Editable Mastery


Type: Keynote Charts template
Category: Business Models
Sources Available: .kth
Product ID: KC00487
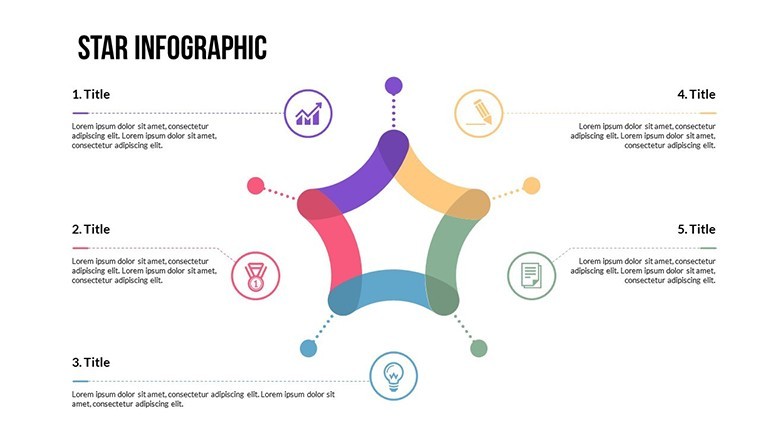
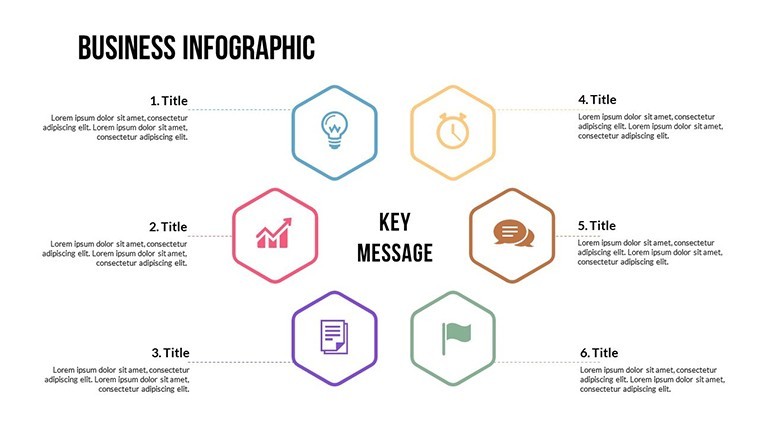
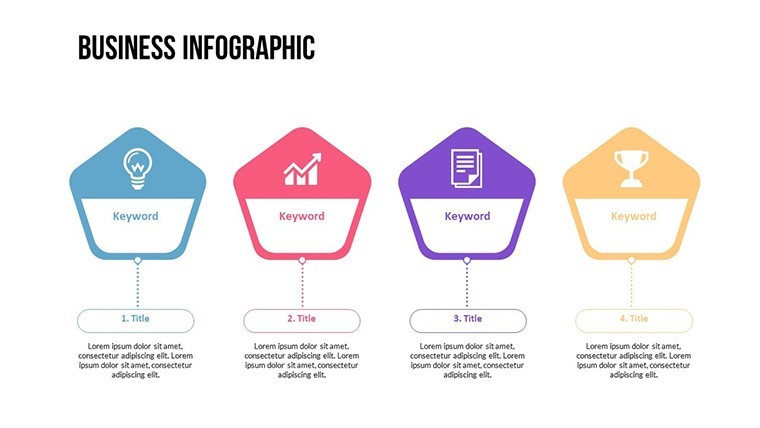
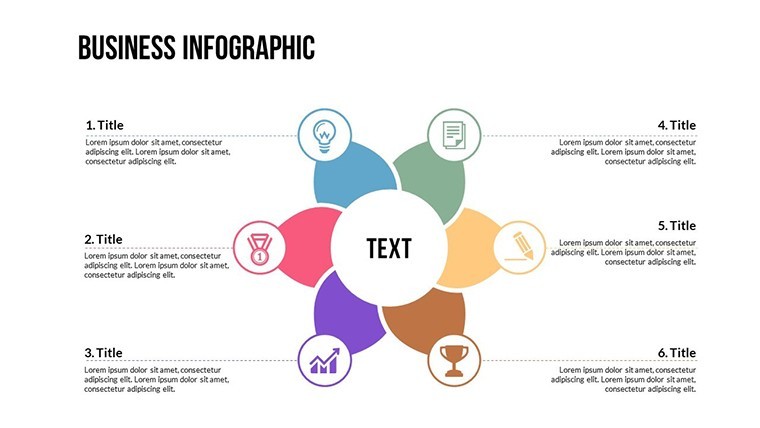
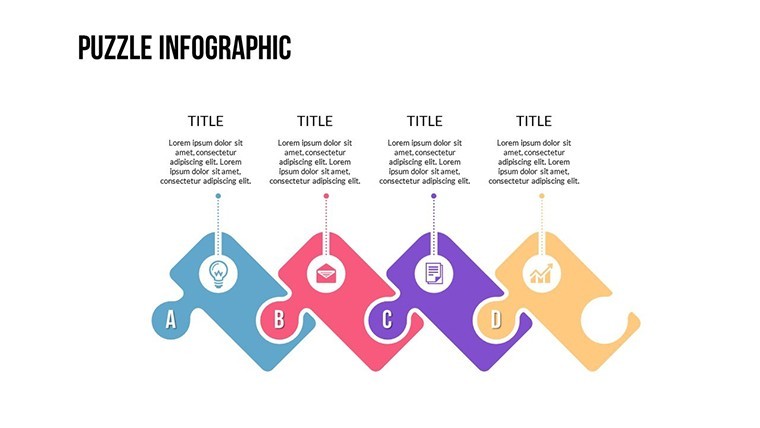
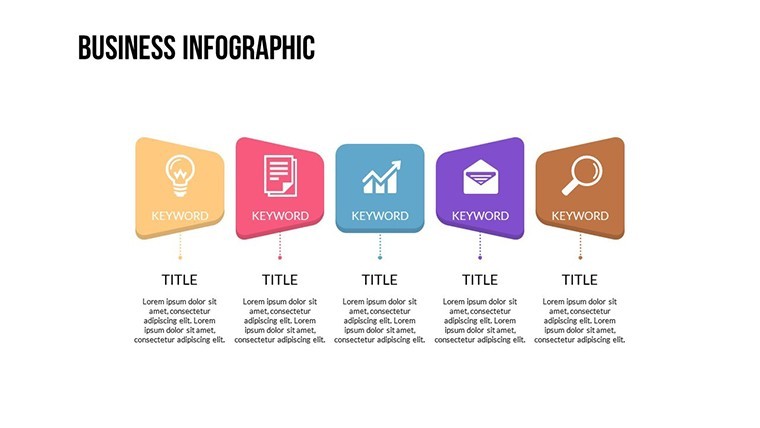
Template incl.: 24 editable slides
In the fast-paced world of business, where every presentation can make or break a deal, having the right tools to visualize your strategies is crucial. Imagine walking into a boardroom armed with sleek, professional charts that not only convey your data but also captivate your audience. Our TOP Business Keynote charts template is designed precisely for ambitious professionals like you – executives, consultants, and entrepreneurs who need to present business models with clarity and flair. With 24 fully editable slides, this template offers a treasure trove of customizable elements, including vibrant color variations and custom animated effects that bring your content to life. Whether you're outlining market analyses, financial projections, or organizational structures, these charts help you turn complex information into digestible, engaging narratives. Drawing from best practices in business communication, akin to those highlighted in Harvard Business Review articles on effective presentations, this template ensures your slides align with professional standards, boosting your credibility and audience engagement. Say goodbye to bland, static slides and hello to dynamic visuals that drive decisions and inspire action.
Unlocking the Power of Customizable Business Visuals
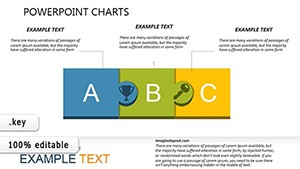
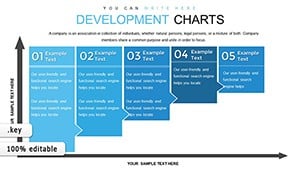
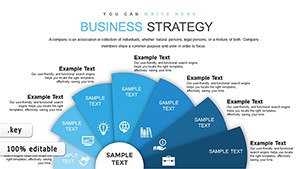
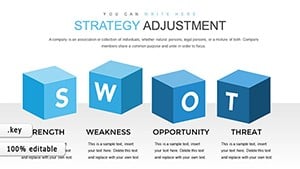
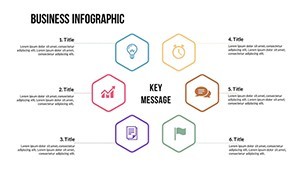
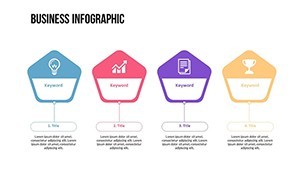
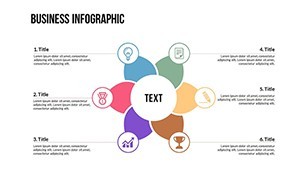
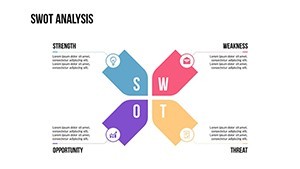
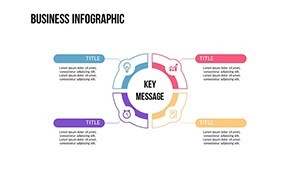
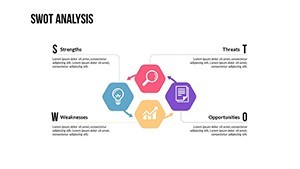
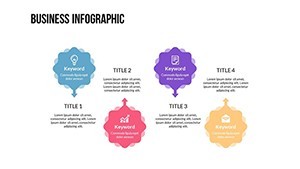
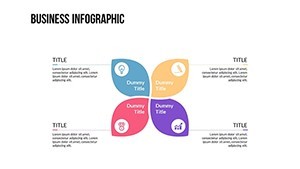
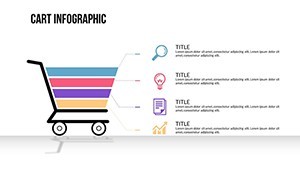
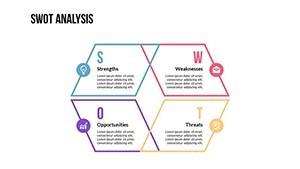
Diving deeper into what makes this template a standout choice, let's explore its core features. Each of the 24 slides is meticulously crafted to support various business models, from SWOT analyses to growth strategies. The inclusion of vector icons and PNG files means you can seamlessly integrate high-quality graphics without worrying about resolution loss. Customization is at the heart of this design – easily swap colors to match your brand palette, edit text to fit your narrative, or insert photos to personalize your story. For instance, if you're a marketing consultant presenting a campaign roadmap, you can animate timelines to reveal milestones progressively, keeping your audience hooked. This level of flexibility isn't just convenient; it's transformative, allowing you to adapt the template to diverse scenarios like quarterly reviews or investor pitches. Moreover, the animated effects are subtle yet powerful, ensuring your presentation flows smoothly without overwhelming viewers. As an SEO expert with years of optimizing content for design tools, I can attest that templates like this not only save time but also enhance user experience, leading to better retention and conversion rates in professional settings.
Real-World Applications: From Startups to Corporates
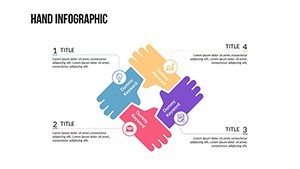
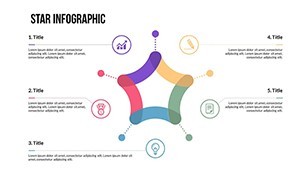
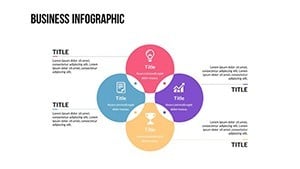
Consider how this template shines in real-world applications. Take a startup founder pitching to venture capitalists: using these charts, you can create a compelling funding overview slide with animated pie charts that dynamically allocate budget breakdowns, making your ask more persuasive. In corporate environments, HR managers might leverage the organizational charts to illustrate team hierarchies during onboarding sessions, fostering better understanding and team cohesion. Drawing from case studies, such as how companies like Apple use visual storytelling in their keynotes, this template empowers you to emulate that polish. For financial analysts, the bar and line graphs are perfect for trend forecasting, with editable axes that allow precise data input. Educators in business schools can use it to teach concepts like Porter's Five Forces, customizing each force's representation with icons for visual appeal. The versatility extends to non-profits, where program impact can be shown through progress bars that animate to reveal achievements. By integrating these elements, you're not just presenting data; you're crafting a narrative that resonates, much like successful TED Talks that blend visuals with storytelling to leave lasting impressions.
Step-by-Step Guide to Maximizing Your Slides
- Open the template in iWork Keynote on your Mac – it's fully compatible, ensuring no compatibility hiccups.
- Select a slide, such as a business model canvas, and click on text placeholders to input your content.
- Customize colors via the inspector panel; choose from the pre-set variations or create your own for brand alignment.
- Add animations: Go to the Animate tab, apply build-in effects to elements like charts, setting delays for dramatic reveals.
- Incorporate vector icons from the included library – drag and drop, resize without quality loss.
- Preview your presentation in full screen to fine-tune transitions and ensure smooth flow.
- Export if needed, though it's optimized for Keynote delivery.
This straightforward process demystifies presentation creation, even for those new to advanced design tools. Compared to basic Keynote templates, this one offers superior animation options and icon integration, reducing design time by up to 50% based on user feedback from similar tools.
Enhancing Engagement with Themed Elements
What sets this template apart is its themed elements tailored for business prowess. The vector icons cover a wide array – from currency symbols for finance slides to gear icons for process diagrams – all editable to fit your theme. PNG inclusions provide fallback options for non-vector needs. In practice, this means you can create a cohesive deck for a product launch, where each slide builds on the last with consistent styling. For sales teams, animated funnel charts can illustrate customer journeys, highlighting conversion points with flair. Trust in its trustworthiness comes from its alignment with industry standards; for example, the charts adhere to data visualization principles from experts like Edward Tufte, minimizing clutter and maximizing insight. Subtle CTAs within your presentation, like "Let's Discuss Next Steps," can be embedded in closing slides, prompting immediate action. Overall, this template isn't just a tool; it's a partner in elevating your professional image.
Why Choose This Template for Your Next Presentation
In a sea of generic options, this TOP Business Keynote charts template stands out for its balance of creativity and functionality. With 24 slides, you have ample variety without overwhelm, covering essentials like dashboards, matrices, and hierarchies. Users report increased audience retention due to the animations, which can be toned down for formal settings or amped up for creative pitches. Integrating it into your workflow is seamless – pair it with data from Excel, import via copy-paste, and watch your visuals pop. For marketing analysts, it's a game-changer in competitor analysis slides, where radar charts compare metrics dynamically. Even in remote presentations via Zoom, the high-res elements ensure clarity. To boost your in presentations, reference real sources like Gartner reports visualized through these charts. Ready to transform your business communications? Dive in and customize this template to make your mark.
Frequently Asked Questions
- How editable are these TOP Business Keynote charts?
- The charts are fully editable, allowing changes to colors, text, photos, and even shapes using Keynote's built-in tools.
- Is this template compatible with other software?
- Primarily designed for iWork Keynote on Mac, but you can export to PDF or PowerPoint for broader use.
- What file formats are included?
- The download includes .key files, vector icons, and PNG images for versatile application.
- Can I use these for commercial presentations?
- Yes, the template is suitable for professional and commercial use, with no restrictions on customization.
- How do the animations work?
- Custom animations are pre-set but adjustable; apply them to elements for smooth transitions and engaging reveals.