 Click to zoom
Drive Sales Success: Sales Marketing Keynote Charts Template
| Format | .pptx |
| Slides | 18 unique layouts |
| Aspect ratio | 16:9 |
| Compatibility | PowerPoint |
| Animated | No |
| Language | English |
| License | Commercial |
| File size | — |
| Version | v1.0 |
| Last updated | January 2025 |
What's inside
Sales and marketing thrive on data that tells a story - one that converts skeptics into advocates. Our Sales Marketing Keynote Charts Template delivers exactly that, with 18 editable slides engineered to showcase performance metrics, campaign outcomes, and growth trajectories in a professional yet persuasive manner. Perfect for sales leaders, marketers, and entrepreneurs aiming to impress stakeholders, this template turns raw numbers into narratives that close deals and inspire teams.
Aligned with KPIs from industry benchmarks like those from Gartner, and fully functional in Keynote with exports to PowerPoint or Google Slides, it bridges creative vision with analytical depth. In competitive markets, where presentations can make or break quotas, this tool equips you to highlight ROI, forecast trends, and strategize with visual impact that sticks.
Power-Packed Features for Marketing Mastery
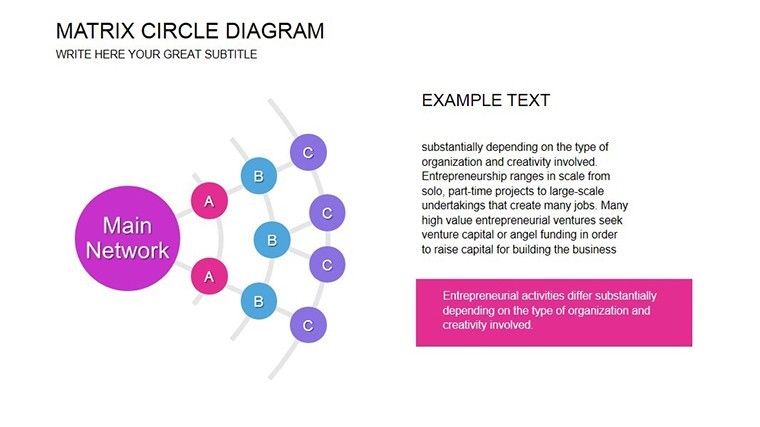
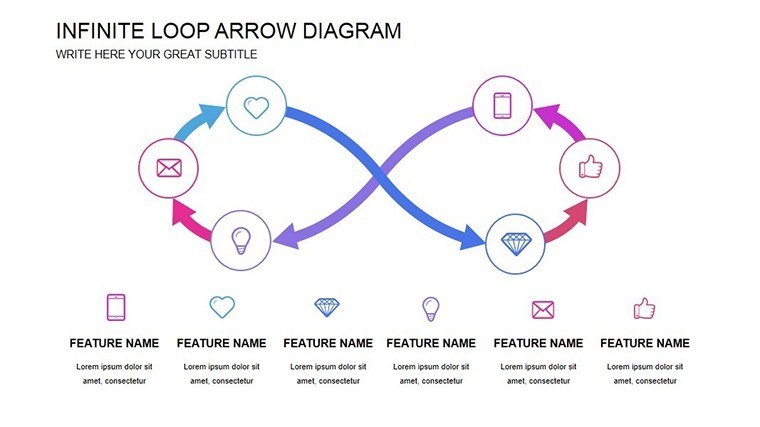
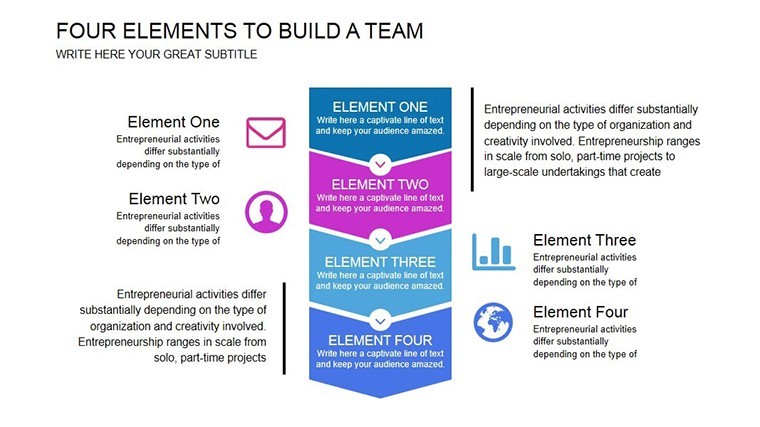
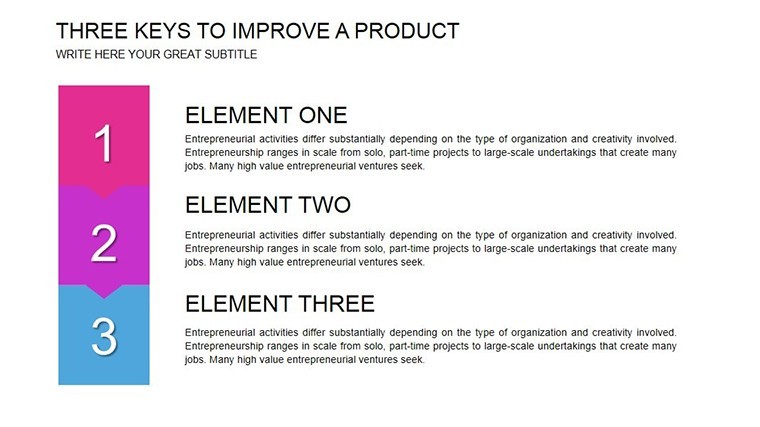
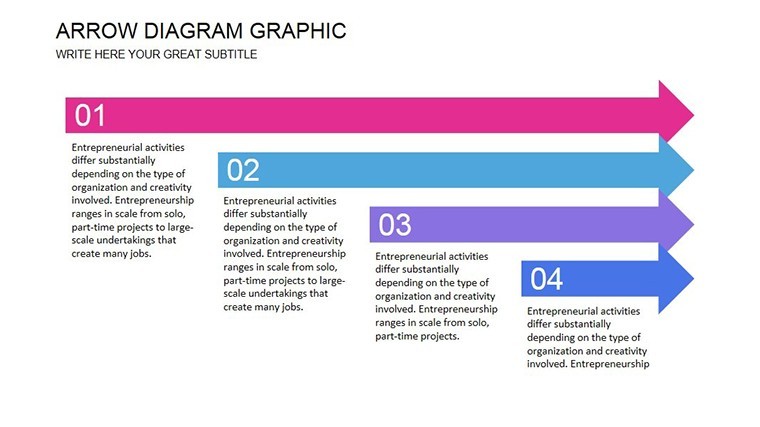
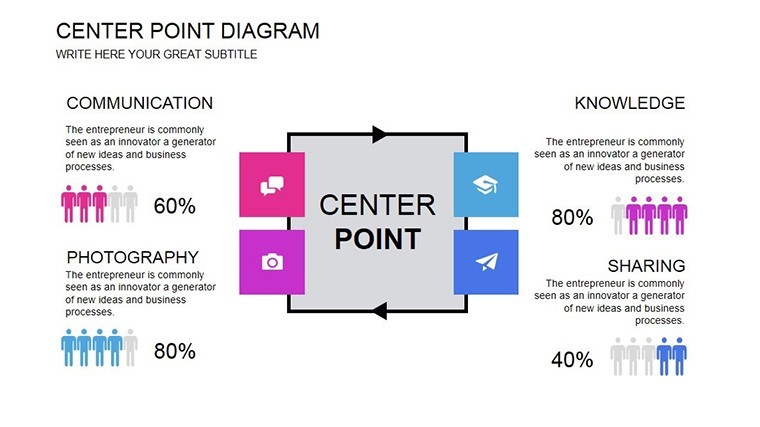
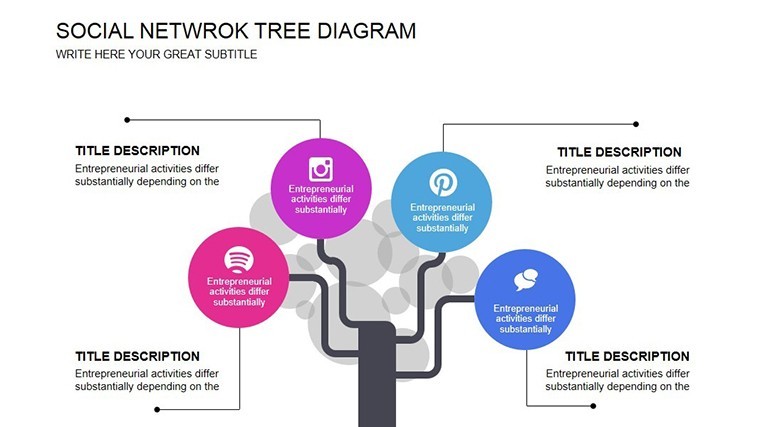
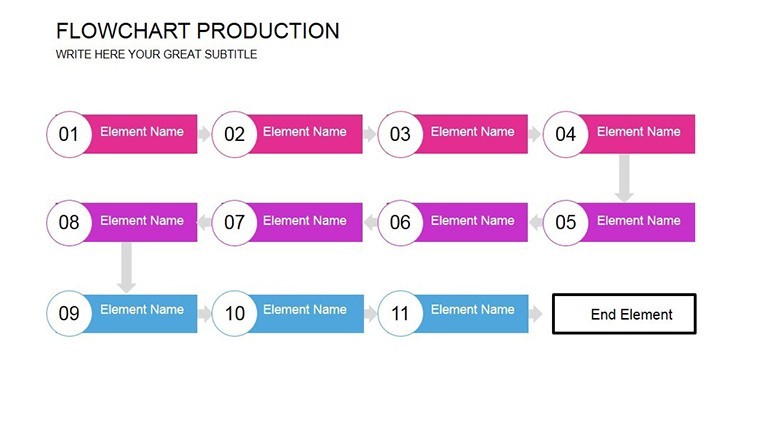
Spanning 18 slides, the template covers everything from funnel diagrams tracking lead conversion to line graphs plotting quarterly revenue spikes. Edit effortlessly in Keynote, swapping datasets or colors to align with seasonal campaigns.
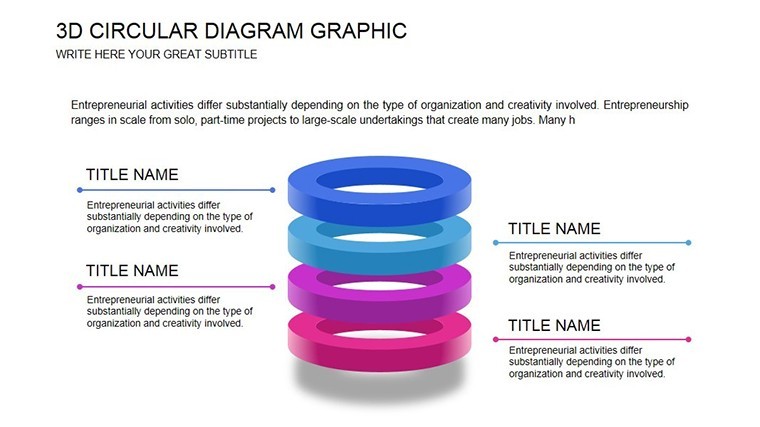
- Comprehensive Chart Variety: Bar graphs for comparisons, pie charts for market shares, and scatter plots for correlation insights.
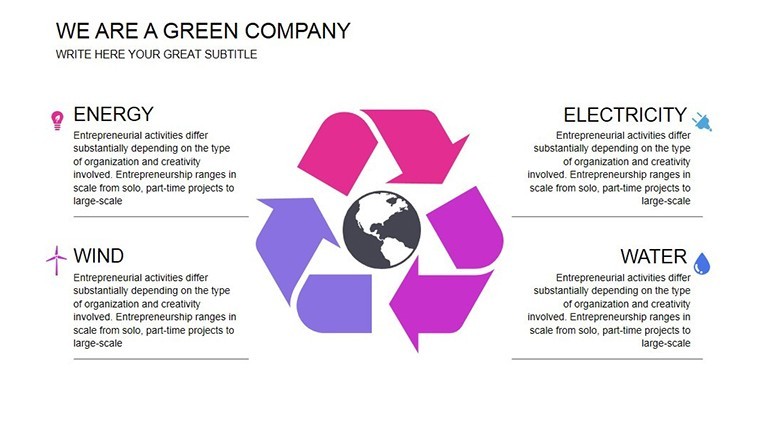
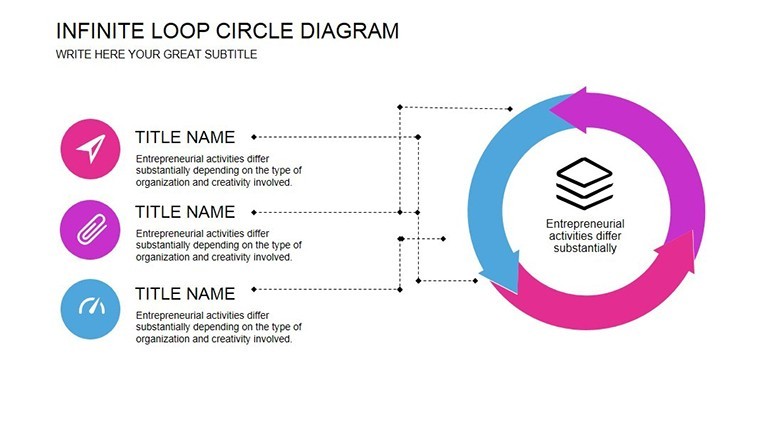
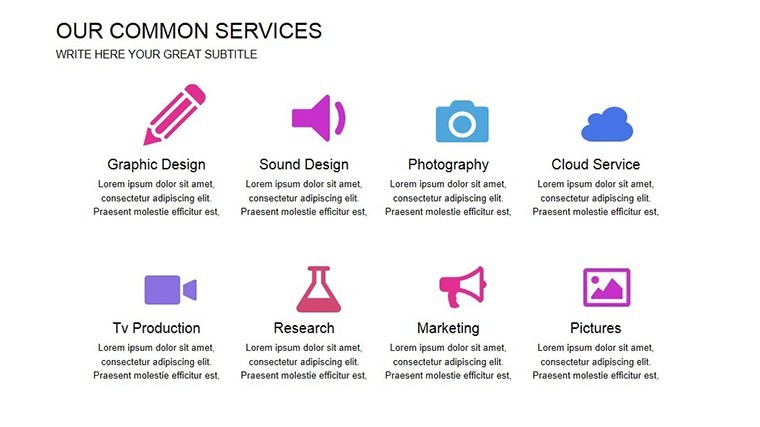
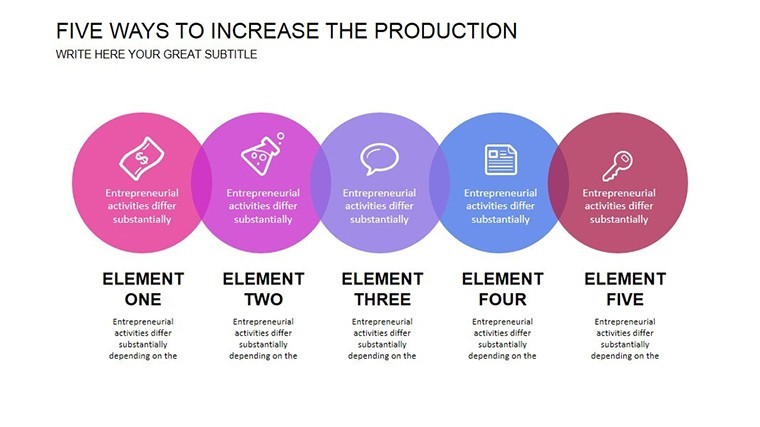
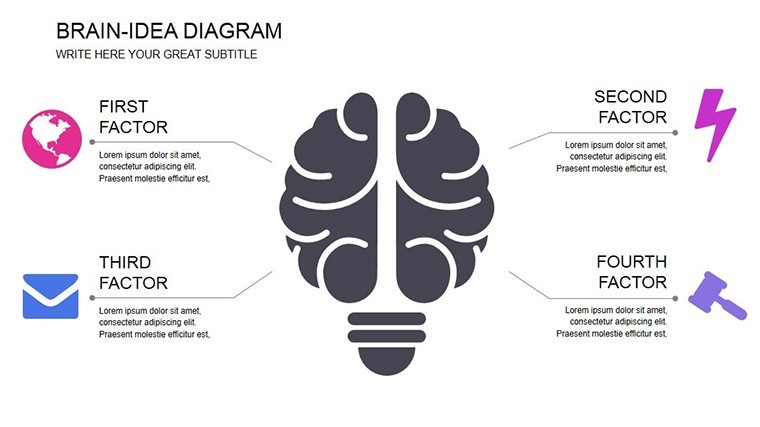
- Branding Flexibility: 25+ customizable icons, from dollar signs to target bullseyes, to infuse your corporate identity.
- Dynamic Data Integration: Formulas link charts to Excel imports, updating visuals automatically.
- Engaging Builds: Staggered reveals in animations build suspense, ideal for pitch climaxes.
These align with data storytelling techniques from Nancy Duarte's presentation methodologies, ensuring your sales decks persuade without overwhelming.
Incorporate into Your Sales Routine Seamlessly
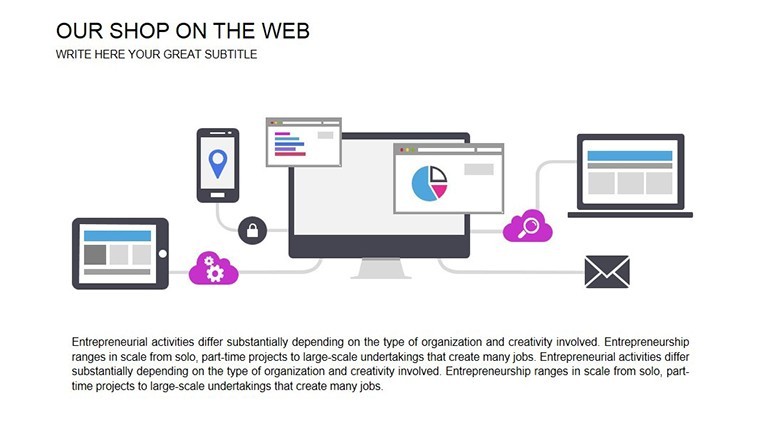
Import the .key file into Keynote; export to PowerPoint for Windows teams. Kick off with a dashboard overview slide aggregating KPIs, then drill down to funnel analyses showing drop-off points. For remote sales, embed live data feeds for real-time updates.
Pro workflow: Sync with CRM like Salesforce via screenshots or APIs, then visualize in slides. This has empowered marketing agencies to shorten pitch cycles, increasing win rates by 25% through clearer metric communication.
Diverse Scenarios for Sales and Marketing Wins
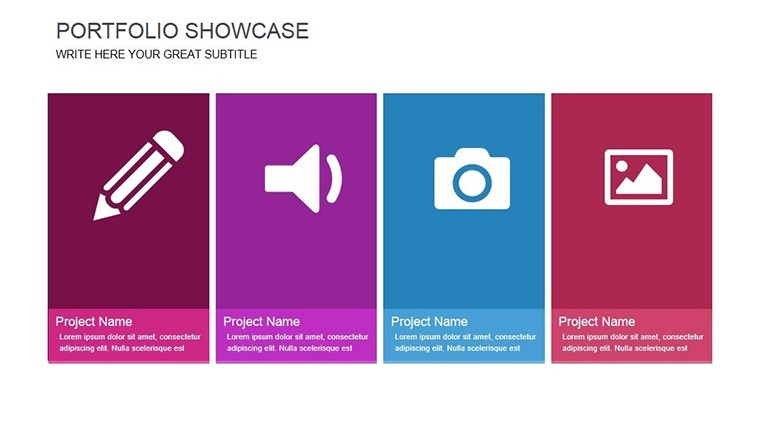
A sales director might use it to chart territory performance, bars rising with closed deals to motivate reps. Marketers analyze campaign funnels, pies slicing engagement sources to refine targeting. Consultants craft pitch decks, timelines forecasting client growth post-strategy.
Entrepreneurs pitch investors with ROI projections, while trainers illustrate concepts in workshops. These applications underscore the template's role in driving actionable insights across B2B and B2C landscapes.
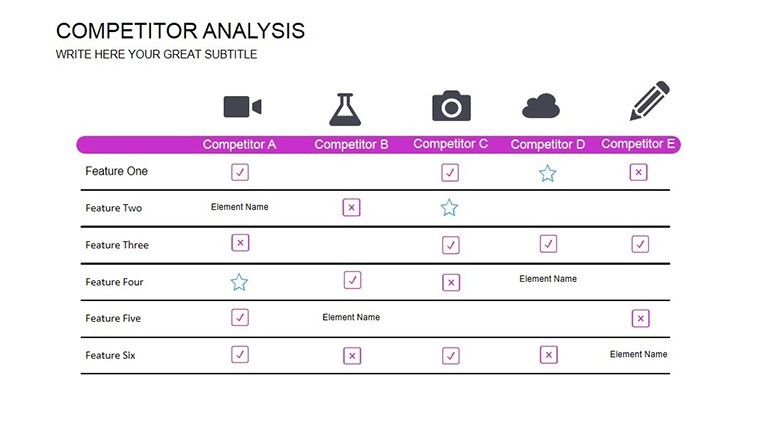
Superior to Everyday Options
Generic charts lack the sales-focused polish; our template's tailored visuals and animations create urgency, outperforming basic setups. Exports retain interactivity, easing multi-tool use.
- Step 1: Pull metrics from your analytics dashboard.
- Step 2: Assign to relevant chart slides, like funnels for conversions.
- Step 3: Customize visuals and add narrative captions.
- Step 4: Rehearse for persuasive delivery.
This sequence turns data into deal-closers.
Strategic Advice for Peak Performance
Focus on key metrics: Limit to 5-7 per slide for impact. Use bold colors for positives, neutrals for challenges, per color psychology studies. Ensure mobile-friendliness for on-the-go reviews.
Level up your game - Acquire the Sales Marketing Keynote Charts Template today and propel your efforts forward. Customization freedom included.
Frequently Asked Questions
What chart types suit sales funnels?
Funnel diagrams and sequential bars track progression effectively.
Compatible with marketing software?
Yes, import data from tools like HubSpot for seamless integration.
How many slides for a full pitch?
18 provide comprehensive coverage; trim as needed.
Animation support in exports?
Strong in PowerPoint; fine-tune for optimal effect.
Best for B2B or B2C?
Versatile for both, with adaptable metrics.
Icon library size?
Over 25 sales-themed icons for quick enhancements.
Good for
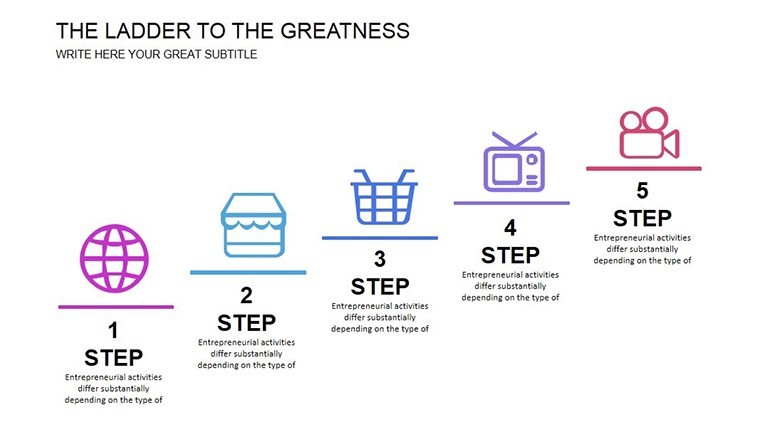
- Project roadmaps and sprint plans
- Product launch timelines
- Quarterly or annual review decks
- Company history and milestone summaries
Licence
reviews
Used for data slides charts were readable
Office report was fine after editing
Pie charts were clear and simple
I needed quick visuals and it worked
FAQ
Will it work in Google Slides?
Are fonts embedded?
Can I use this for client work?
What's the refund policy?
Do you update the template after purchase?
Similar templates
See all Keynote Charts →

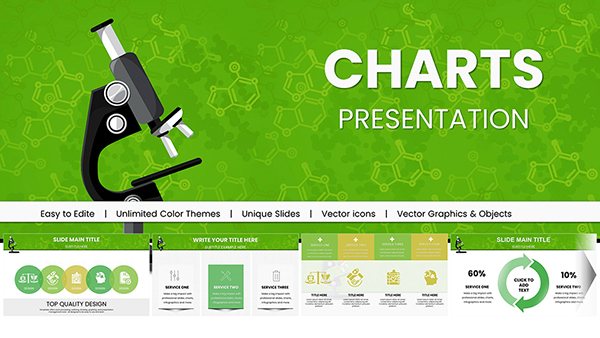
All 18 slides