Visualize Victory: Graphic SWOT Keynote Charts Template


Type: Keynote Charts template
Category: Analysis
Sources Available: .key
Product ID: KC00454
Template incl.: 12 editable slides
In the high-stakes world of business strategy, a well-crafted SWOT analysis can be the difference between stagnation and breakthrough. Our Graphic SWOT Keynote Charts Template empowers you to do just that, with 12 vibrant, editable slides that turn abstract concepts into graphic masterpieces. Ideal for executives, students, and educators seeking to illuminate strengths, weaknesses, opportunities, and threats, this template blends creativity with analytical rigor to make your insights pop.
Rooted in frameworks from strategy gurus like Michael Porter, and compatible with Keynote while exportable to PowerPoint or Google Slides, it's a versatile ally for any presentation platform. Whether dissecting a startup's market position or evaluating a classroom project, these graphics foster deeper understanding, helping users move from analysis to action with confidence and style.
Key Graphic Elements That Drive Engagement
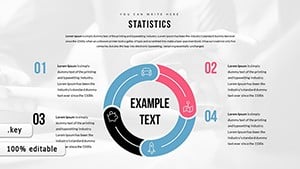
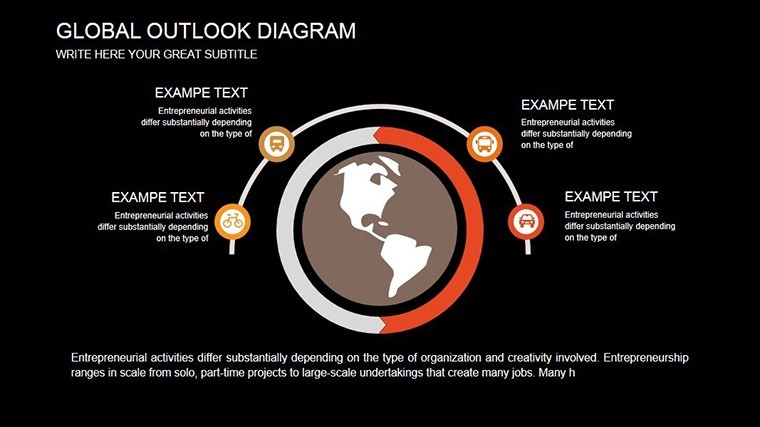
The template's strength lies in its diverse chart arsenal, from infographic-style matrices to dynamic Venn diagrams overlapping internal and external factors. Each of the 12 slides is primed for personalization - alter fonts to match your style guide or inject data via simple tables that auto-generate visuals.
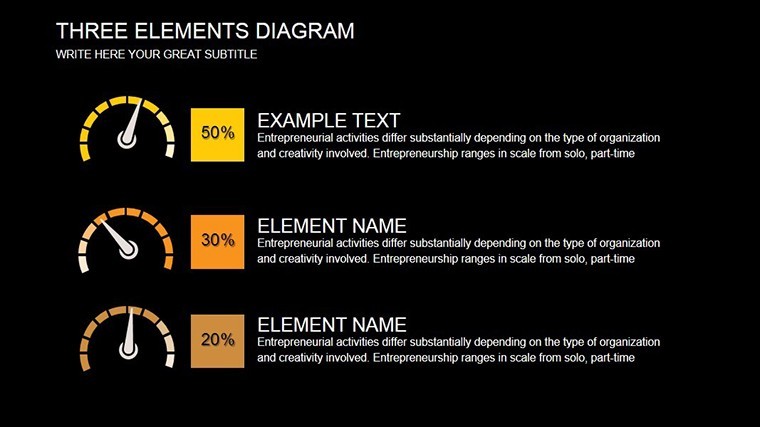
- Diverse Visualization Options: Bubble charts for prioritizing opportunities, flowcharts for threat mitigation paths.
- Customizable Graphics Library: 30+ icons, including balance scales for SWOT equilibrium and lightbulbs for innovative strengths.
- Interactive Data Features: Hover effects in Keynote reveal sub-details, perfect for digital walkthroughs.
- Cohesive Design Theme: Minimalist layouts with ample white space, inspired by infographic trends from Canva's design labs.
Unlike plain text reports, these graphics adhere to Nielsen's usability principles, ensuring scannability and reducing cognitive load for faster comprehension.
Streamline Your Creation Process
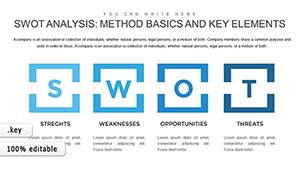
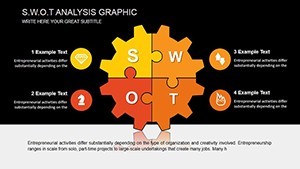
Open in Keynote for native editing; export to PowerPoint preserves layered elements for further tweaks. Begin with the central graphic slide - a stylized quadrant divided by icons - then branch to specialized charts, like a radar plot comparing weaknesses across departments. For teams, share via cloud links for collaborative input.
Efficiency tip: Use the template alongside SWOT workshops with tools like Miro, importing visuals directly to amplify group sessions. This method has transformed how consultants like those at Bain deliver findings, slashing revision cycles by half.
Targeted Applications for Maximum Impact
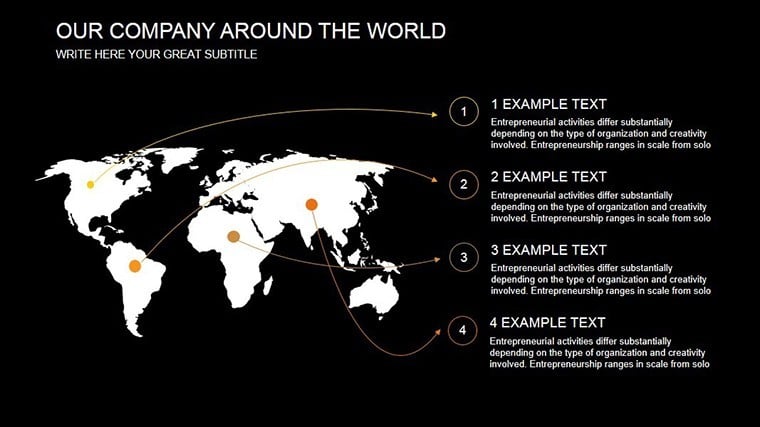
Business pros might deploy it for quarterly reviews, graphing sales strengths against competitive threats to rally teams. Students in strategy courses visualize case studies, such as Amazon's ecosystem, making abstract theories tangible. Educators craft lesson plans around it, using graphic threats to discuss risk in real-world scenarios like environmental policy.
Even in creative fields, marketers apply it to campaign audits - opportunities from social trends visualized against content weaknesses. These uses highlight the template's broad appeal, always centering on graphic clarity to spark dialogue and decisions.
Outshining Standard Alternatives
Basic Keynote charts lack the thematic cohesion; our template's integrated graphics create a unified story, far surpassing fragmented DIY efforts. In PowerPoint exports, animations retain smoothness, unlike clunky conversions from other formats.
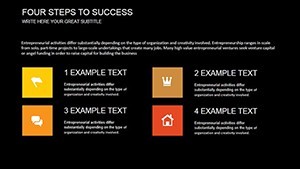
- Step 1: Compile your SWOT list from stakeholder inputs.
- Step 2: Map to graphic slides, selecting visuals that best represent each factor.
- Step 3: Refine aesthetics and add explanatory notes.
- Step 4: Present with confidence, using builds to reveal insights gradually.
This roadmap ensures professional polish every time.
Design Tips from the Pros
Emphasize balance: Use symmetric graphics to mirror SWOT's equilibrium. Opt for sans-serif fonts for readability, and test contrasts for accessibility. To add , cite sources in footnotes, building trust like in peer-reviewed journals.
Transform your strategy sessions - Secure the Graphic SWOT Keynote Charts Template immediately and let graphics lead the way to smarter choices. Endless customization awaits.
Frequently Asked Questions
What types of graphics are included?
A mix of matrices, radars, bubbles, and icons tailored for SWOT elements.
Is it beginner-friendly for students?
Yes, simple edits and guides make it accessible for academic projects.
How does it handle large datasets?
Scalable charts accommodate extensive data without losing clarity.
Export quality to other software?
High fidelity to PowerPoint/Google Slides, with minimal adjustments needed.
Can graphics be animated?
Built-in Keynote animations; adaptable in exports.