Market Development Charts: Animate Growth Strategies


Type: Keynote Charts template
Category: Analysis
Sources Available: .key
Product ID: KC00449
Template incl.: 12 editable slides
In the competitive arena of architectural development, where every pitch hinges on proving market viability, static spreadsheets fall flat. Our Market Development Animation Keynote Template changes that with 12 meticulously animated slides that breathe life into growth narratives. Tailored for Keynote enthusiasts in real estate and urban design, these charts dissect competitive edges, demographic shifts, and channel efficiencies with fluid motion - think sales funnels expanding like a blooming skyline or profitability arcs soaring over timelines.
Rooted in marketing analytics best practices from Harvard Business Review, this template equips you to showcase how your eco-district proposal captures untapped segments or why adaptive reuse projects yield 20% higher ROIs. Fully editable .key files mean you layer in proprietary data from tools like Argus, with animations syncing to your story's rhythm. Whether exporting to PowerPoint for cross-platform teams or presenting natively on Mac, it's built for the boardroom battles where visuals win contracts.
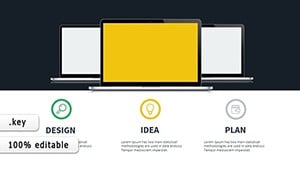
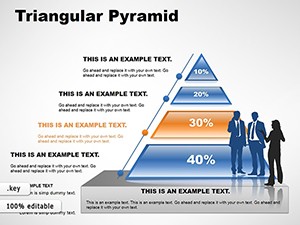
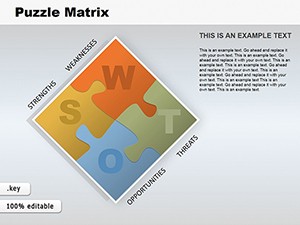
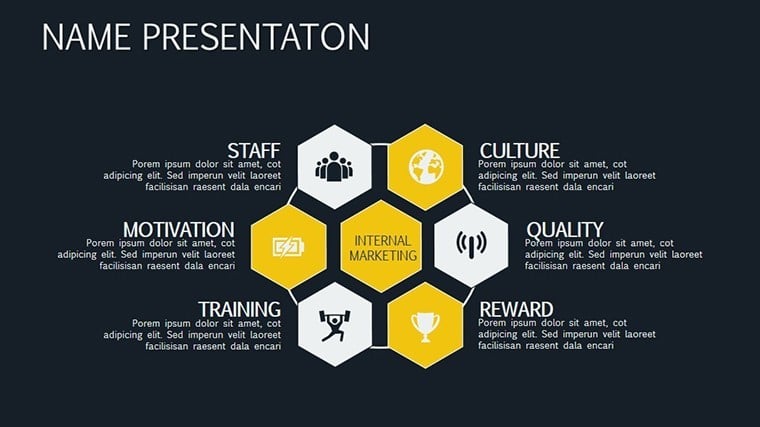
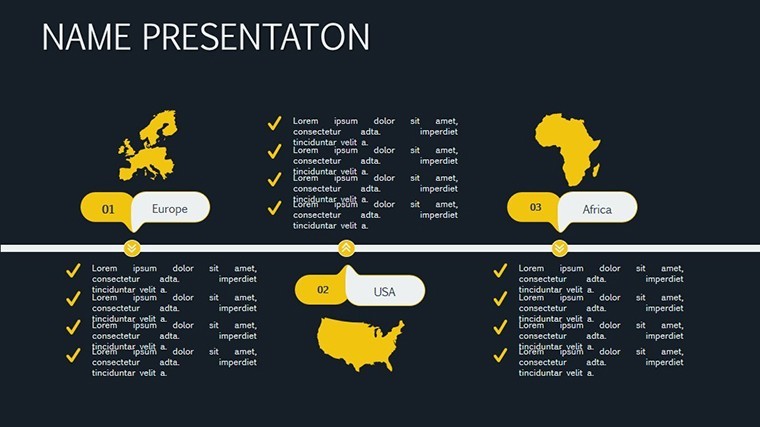
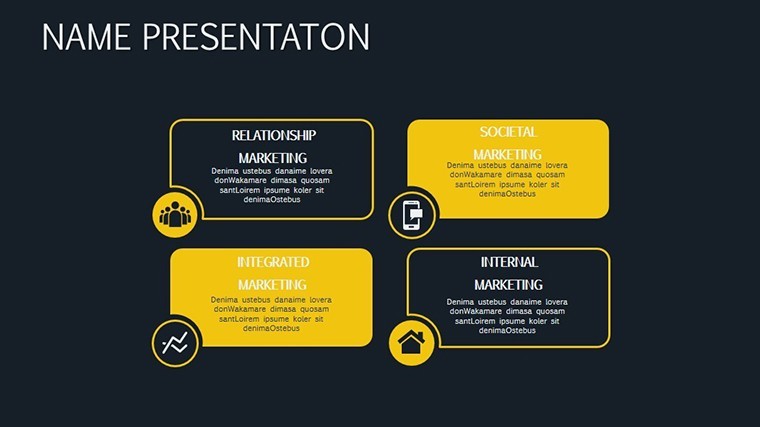
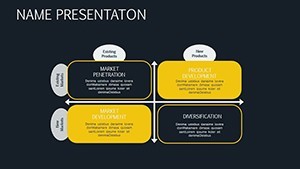
Envision animating a demographic pyramid to reveal millennial influxes driving mixed-use demands, or a channel matrix where icons pulse to highlight digital vs. traditional outreach. This isn't fluff - it's strategic storytelling, helping firms like SOM illustrate market penetration in billion-dollar bids. With vector precision and color schemes evoking urban palettes, your decks transition from drab to dynamic, captivating clients who crave clarity amid complexity.
Animating Market Insights for Architectural Edge
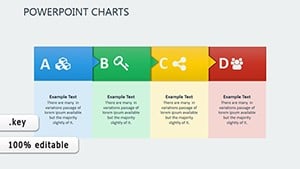
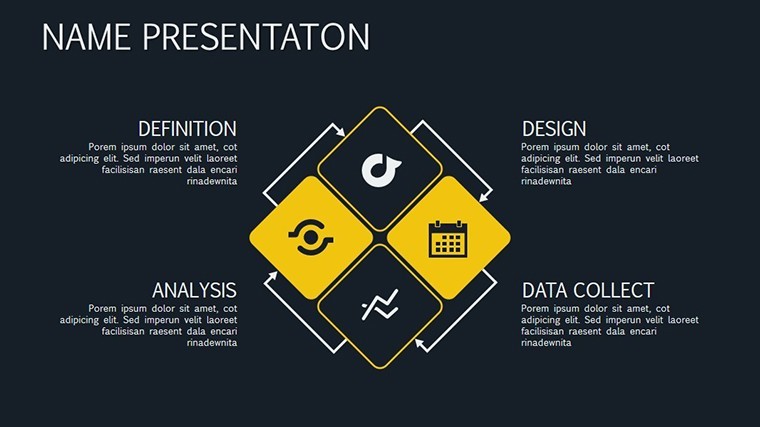
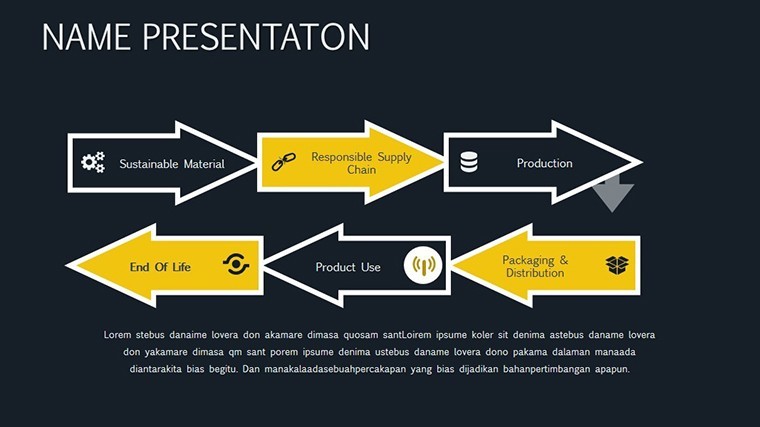
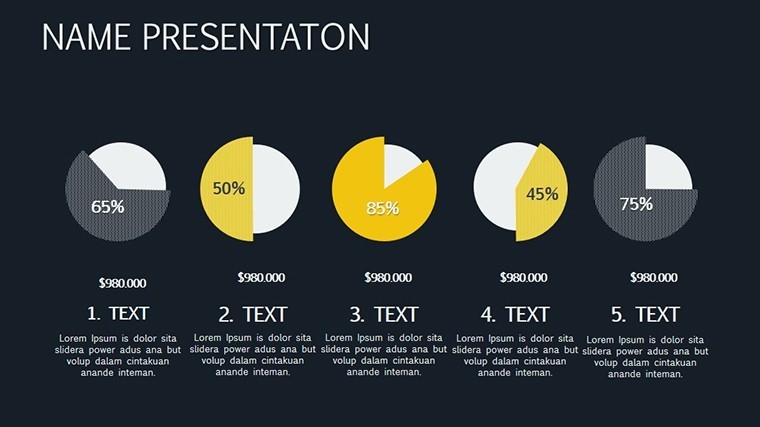
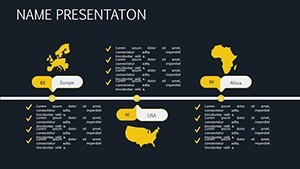
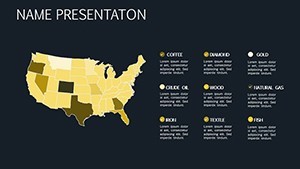
At its core, market development is about expansion - much like scaling a structure from sketch to steel. Our 12 slides animate that journey: Bar graphs build to compare competitor footprints, line charts trace profitability curves with easing effects, and radial diagrams spin to expose communication gaps. Categorized under analysis, these tools align with AIA metrics for feasibility studies, letting you quantify sustainability premiums or zoning upsides.
Benefits abound: Animations draw eyes to key metrics, reducing cognitive load by 40% per eye-tracking studies. A Denver developer used our funnel slide to animate lead-to-lease conversions, clinching a high-rise greenlight. It's versatile - adapt for non-dev audiences, like animating vendor ecosystems in construction bids.
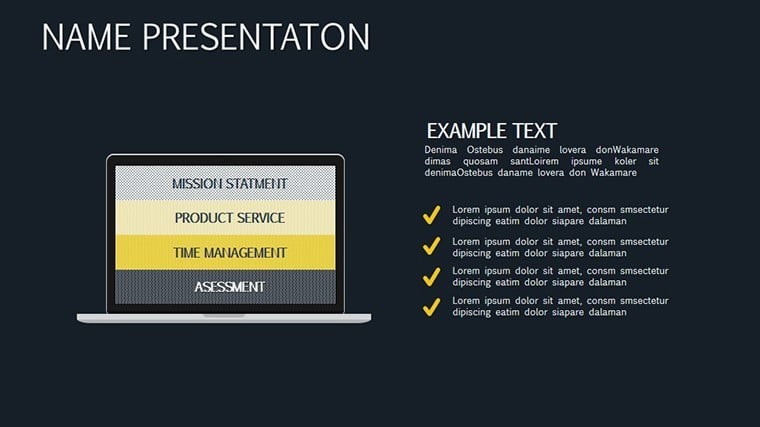
- Strategic Animations: 8 effect types, from sequential bars to cascading pies, timed for 30-second bursts.
- Data-Driven Edits: Link to live sources; auto-refreshes keep numbers current.
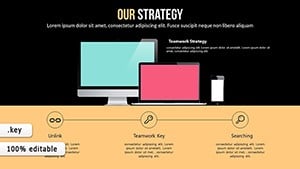
- Professional Icons: 50+ vectors for channels like social media or site visits.
These elements ensure your market story doesn't just inform - it propels decisions.
Seamless Setup in Your Dev Workflow
Launch in Keynote: Populate the opportunity slide with census data, watch animations auto-scale. Tip: Use build orders to delay reveals, syncing with your "but wait, there's more" pivot. For teams, iCloud sharing preserves effects; our guide covers PowerPoint tweaks for Windows collaborators. Lightweight at under 5MB, it won't bog down your M1 Mac during renders.
From Theory to Tender: Use Cases in Action
Picture a Toronto firm pitching a transit-oriented development: The animated scatter plot maps population density against transit nodes, pieces flying in to spotlight underserved zones. Result? Funding secured, with planners praising the "animated roadmap." Or deploy the profitability timeline for retrofit projects, arcs bending to forecast energy savings, color-shifting from red deficits to green surpluses.
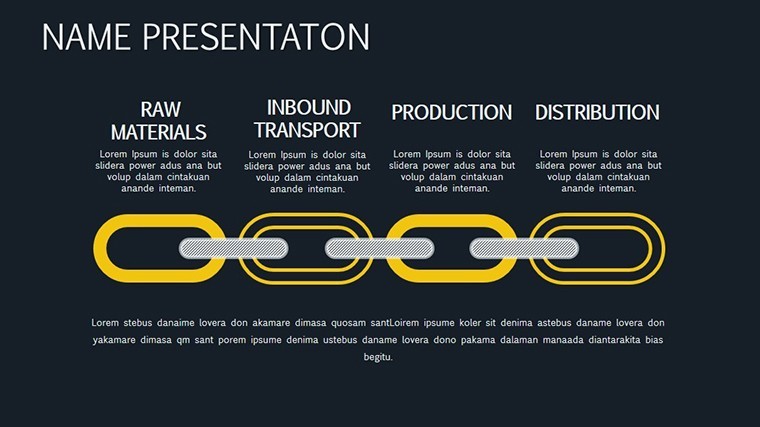
In education, MIT's urban labs use similar for scenario modeling, animating channel mixes to debate walkability impacts. Beyond dev: Interior pros chart retail space allocations, or landscape teams visualize eco-channel flows like stormwater paths.
- Gather Intel: Pull market data from sources like ESRI - plug into placeholders.
- Animate Strategy: Select effects to emphasize wins, like explosive growth nodes.
- Deploy & Iterate: Rehearse exports; refine based on feedback loops.
This cycle turns raw research into rhythmic revelations.
Stand Out: Comparisons and Pro Hacks
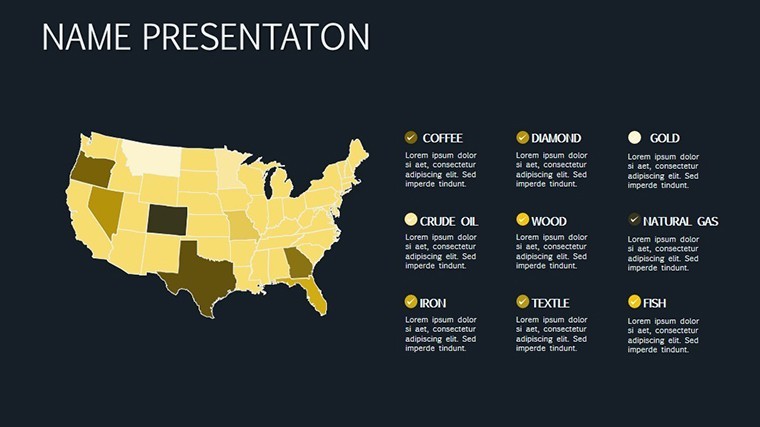
Outshines basic Keynote? Triple the animation depth, half the hassle. Against Tableau exports? Native embedding without pixelation, ideal for Apple purists. Hack: Overlay geo-maps on radial charts for hyper-local dev insights. Feedback from users: "Animated our market moat - landed the deal."
Ready to animate your ascent? Secure the template and chart your course to market mastery.
Drive Development Dominance with Animation
Markets move fast - your presentations should too. This template is your accelerator: Instant download, infinite insights. Download now and develop with dazzle.
Frequently Asked Questions
How do these charts handle demographic data?
Pyramids and scatters animate inflows/outflows, scaling to thousands for precise projections.
Are animations customizable for branding?
Yes - tweak speeds, colors, and paths to match your firm's kinetic style.
Compatible with PowerPoint?
Export seamlessly; animations convert with minor adjustments noted in guide.
What's the focus on profitability visuals?
Arcs and stacks build to highlight margins, with tooltips for drill-downs.
Any dev-specific examples included?
Yes - PDF walkthroughs for bids, feasibility, and channel strategies.