Market Dev Analysis Charts: Keynote Templates


Type: Keynote Charts template
Category: Analysis
Sources Available: .key
Product ID: KC00448
Template incl.: 12 editable slides
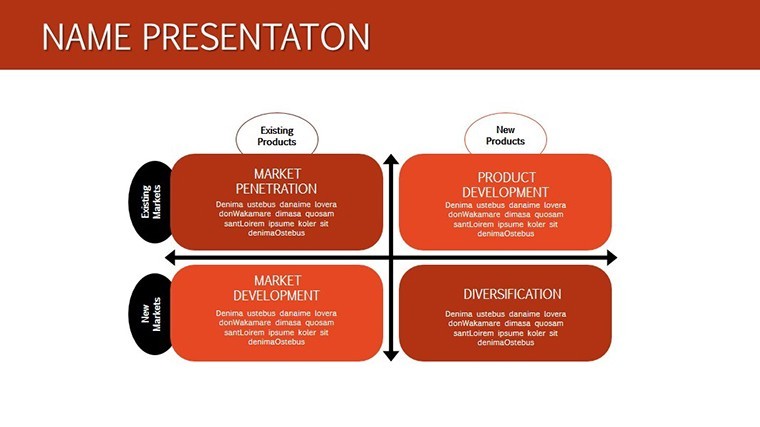
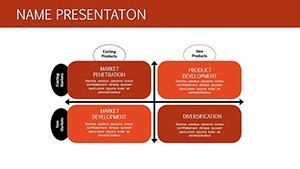
Navigating market landscapes demands precision and insight. Our Market Development Keynote charts template provides exactly that with 12 editable slides focused on analysis, ideal for financial managers and marketers. Categorized under analysis, it equips you to visualize strategies like penetration and share maximization. Benefits: Sharpen competitive edges, inform pricing decisions, and fortify segment presence. Tackle issues such as undervalued market potentials by offering charts that dissect data meaningfully. Rooted in principles from Michael Porter's competitive strategies, this tool transforms numbers into narratives. For Apple Keynote users, it's a seamless fit with iWork compatibility. From boardroom analyses to strategy workshops, these charts empower decisions that drive growth. Discover how targeted visuals can redefine your market approach.
Features Tailored for Market Mastery
Depth in analysis sets winners apart. This template's 12 slides include specialized charts for market metrics, with editable elements for custom insights. Adjust for scenarios like below-competitor pricing or dumping strategies. As an SEO specialist, I've seen how such tools, aligned with CIM marketing standards, enhance strategic planning. Benefits: Data-backed decisions without design hassles. A finance team, for instance, uses these to chart penetration paths, highlighting ROI potentials. Beyond basics, it offers analytical layers like trend lines and comparisons.
Exploring Chart Varieties and Edits
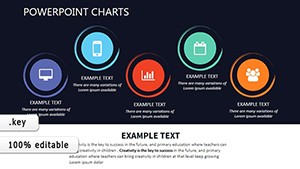
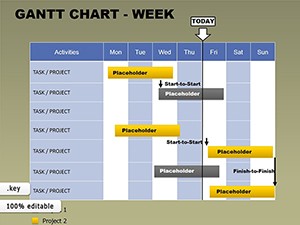
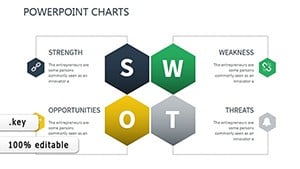
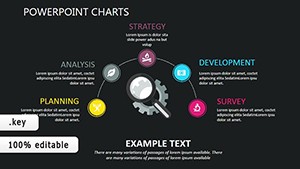
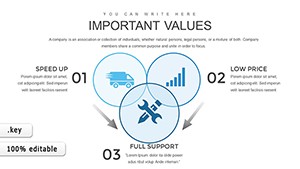
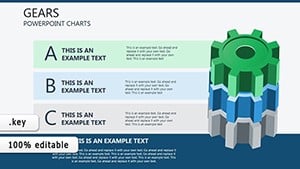
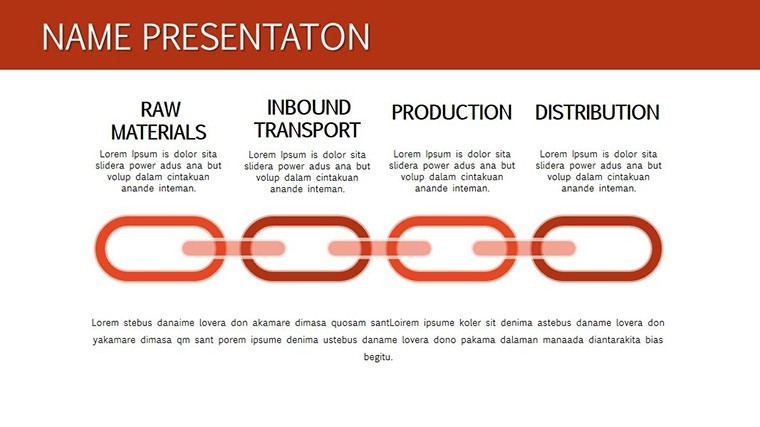
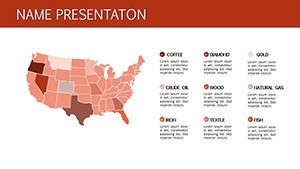
- Share Breakdowns: Segmented charts for market portion visuals.
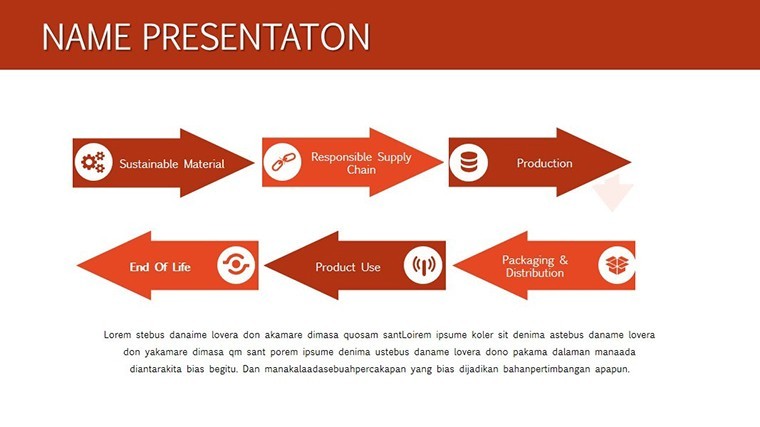
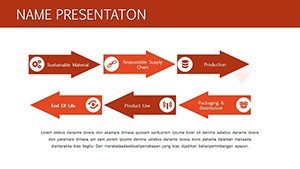
- Penetration Models: Graphs showing entry strategies.
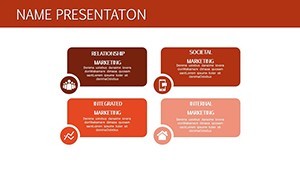
- Pricing Analyses: Comparative bars for competitive edges.
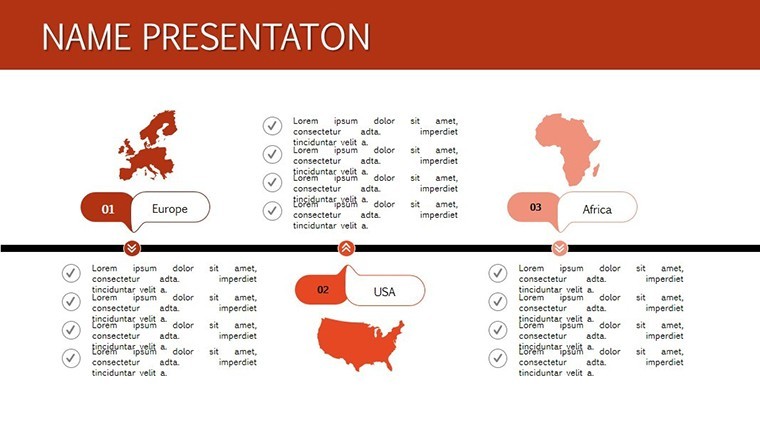
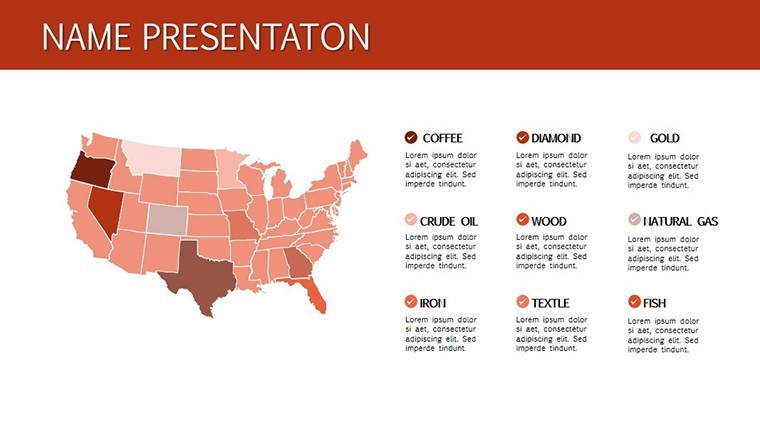
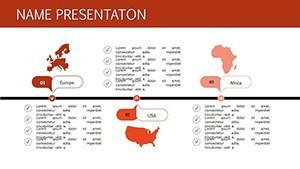
- Segment Focus: Maps pinpointing presence strengths.
- Growth Projections: Lines forecasting developments.
Tip: Use Keynote's data editor for real-time updates, ensuring accuracy per FASB standards.
Strategic Applications and Case Insights
Apply these in action-oriented settings. Marketers craft penetration plans with visual aids, akin to Coca-Cola's segment expansions. In finance, analyze dumping impacts on shares. Step-by-step: Choose a chart, input market data, refine visuals. Outperforms free tools by providing analysis-specific precision. Add engagement: Highlight "junk price" risks humorously in notes. Workflow: Integrate with Excel imports for robust analyses. Terms like "market share visuals" enhance discoverability.
Implementation Steps for Success
- Open in Keynote and select an analysis slide.
- Populate with segment data.
- Customize axes and legends.
- Review for strategic alignment.
- Present or share insights.
Grounded in Kotler's marketing texts for efficacy.
Advancing Your Market Position
Generic charts inform; these analyze deeply. Edge: Focused on development dynamics. Trust via instant access. For twists, overlay economic indicators.
Claim your market advantage - download today.
FAQ
How do these aid market penetration?
By visualizing pricing and share strategies effectively.
Compatible with latest Keynote?
Yes, fully optimized for current versions.
Can I export analyses?
Easily to PDF or images, preserving quality.
Suitable for global markets?
Yes, adaptable for international data.
What if I need more charts?
Duplicate and expand as required.