Decisive Definition Keynote Charts: Unlock Impactful Infographics


Imagine stepping into a boardroom where your data doesn't just speak - it captivates. The Decisive Definition Keynote Charts template is your gateway to creating professional infographic presentations that turn complex information into crystal-clear visuals. Designed specifically for Keynote users, this template features 11 editable slides packed with timelines, puzzles, and dynamic charts that help you define decisions with precision and flair. Whether you're a marketing executive outlining campaign strategies or an educator simplifying lesson plans, these charts empower you to communicate ideas that resonate and inspire action.
At its core, this template addresses the common pain point of bland presentations that fail to engage audiences. Instead of starting from scratch in Keynote, you get a ready-to-use foundation that's fully customizable. Edit colors to align with your company's palette, tweak fonts for readability, and resize shapes to fit your narrative - all without losing the professional polish. This isn't just about aesthetics; it's about strategy. By leveraging these infographics, you can highlight key decision points, such as project milestones or risk assessments, making your pitches more persuasive and memorable.
Key Features That Set This Template Apart
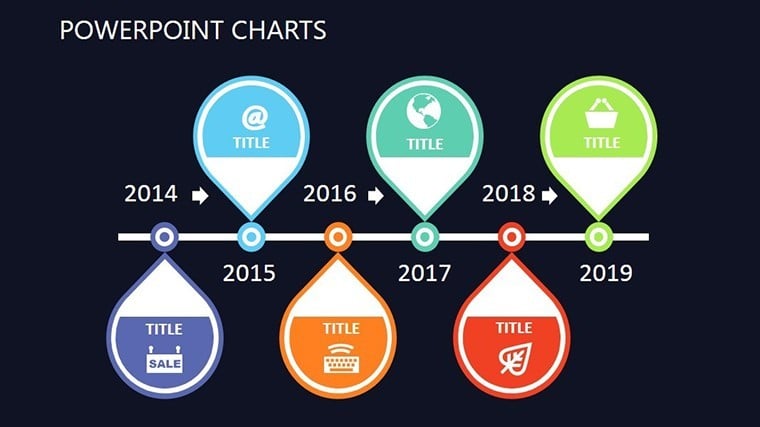
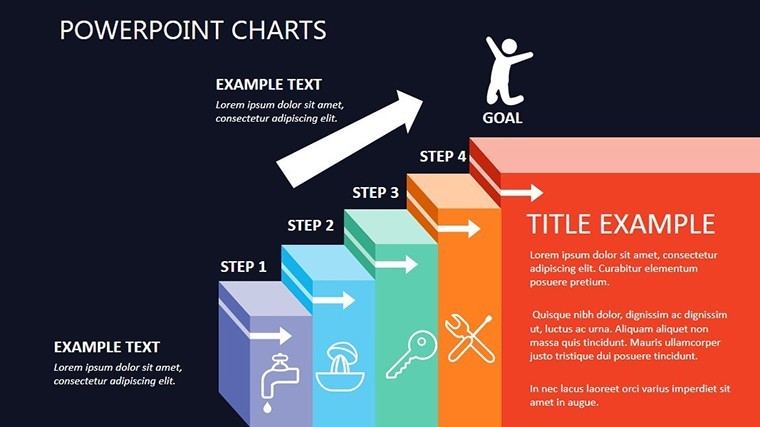
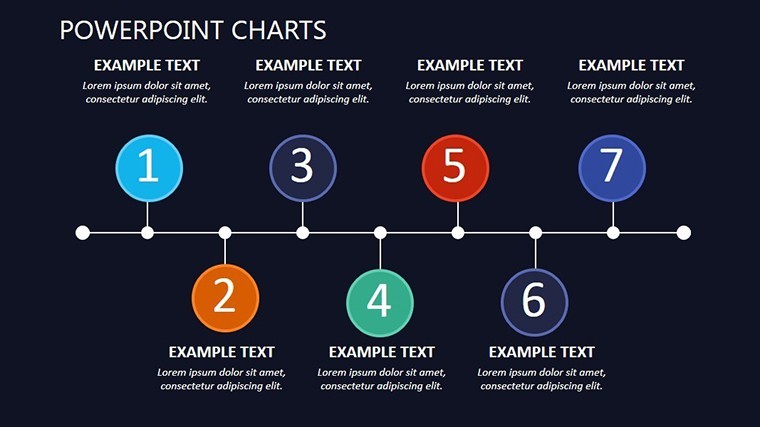
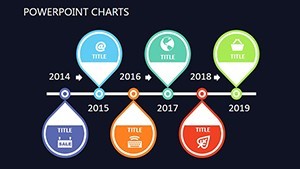
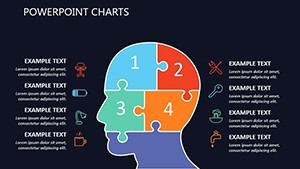
What makes the Decisive Definition Keynote Charts stand out in a sea of generic templates? It's the thoughtful integration of versatile elements tailored for decision-making scenarios. Each of the 11 slides includes high-quality icons, vector graphics, and animation-ready components that work seamlessly in Keynote's environment. For instance, the timeline slides allow you to map out sequential events with drag-and-drop ease, while puzzle charts visualize interconnected ideas, perfect for brainstorming sessions.
- Fully Editable Elements: Every chart, graph, and infographic is vector-based, ensuring scalability without quality loss. Change data points in seconds using Keynote's built-in tools.
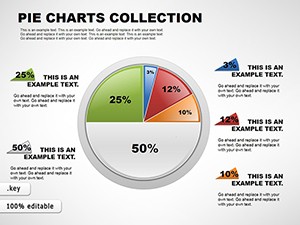
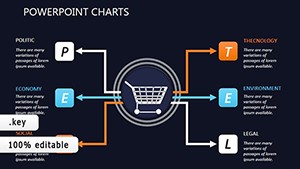
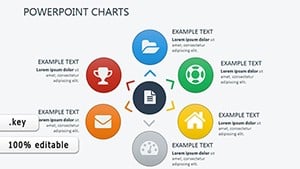
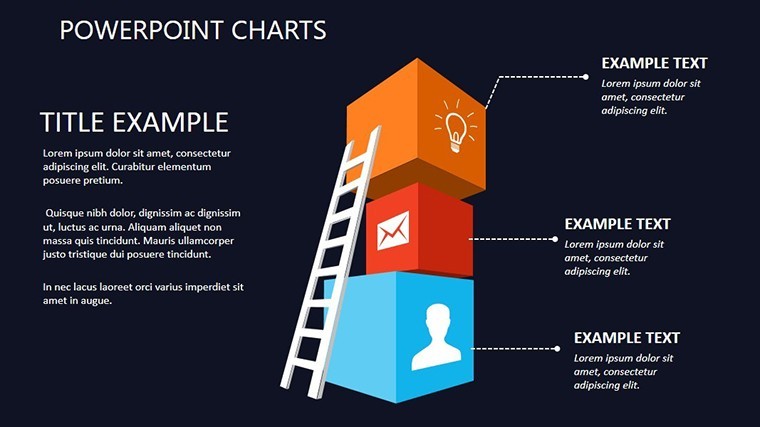
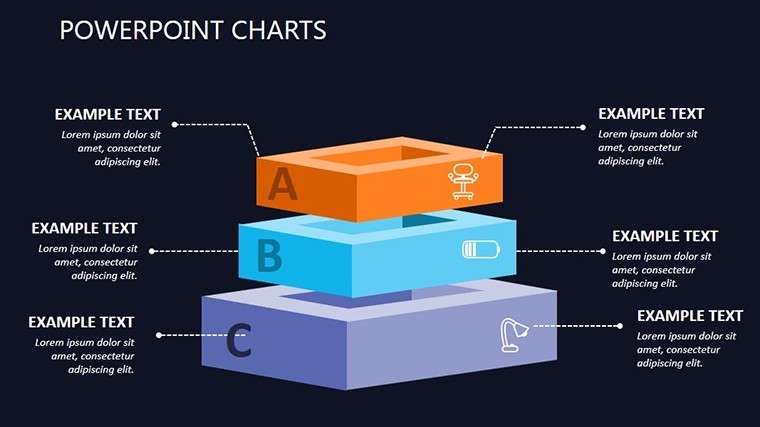
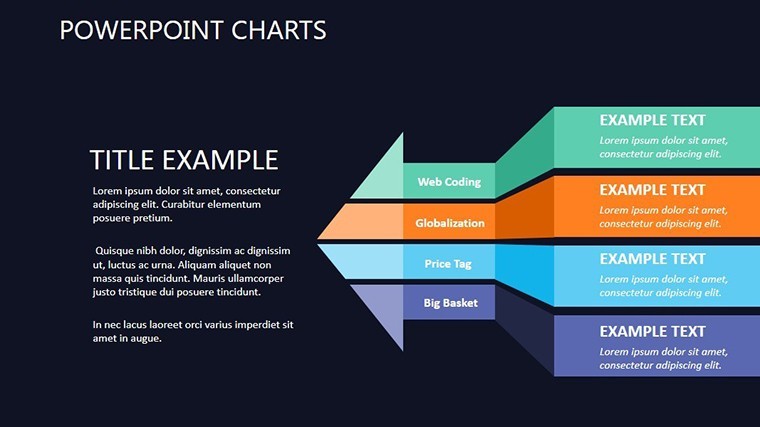
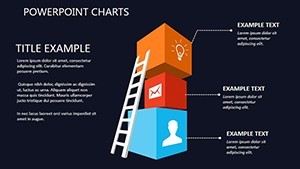
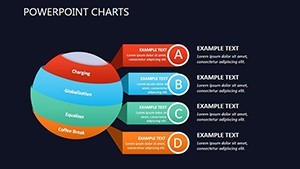
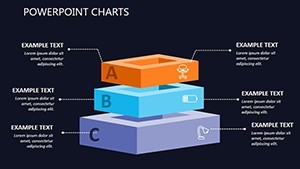
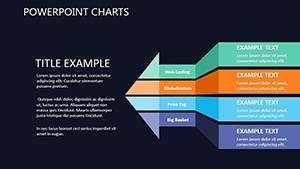
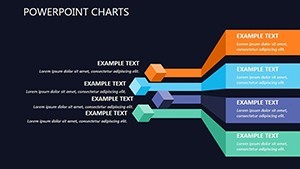
- Diverse Chart Types: From pie charts for market share breakdowns to flow diagrams for process definitions, this template covers a spectrum of visualization needs.
- Branding Flexibility: Swap out default blues and grays for your brand's vibrant hues, ensuring consistency across slides.
- Animation Support: Built-in transitions that reveal data progressively, keeping viewers hooked without overwhelming them.
Professionals in industries like finance and technology have praised similar templates for reducing preparation time by up to 70%, allowing more focus on refining messages. Drawing from best practices in visual communication - think principles from experts like Edward Tufte - this template avoids clutter, emphasizing clarity to make your definitions decisive and undeniable.
Real-World Applications: Bringing Decisions to Life
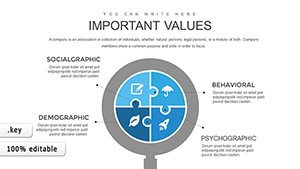
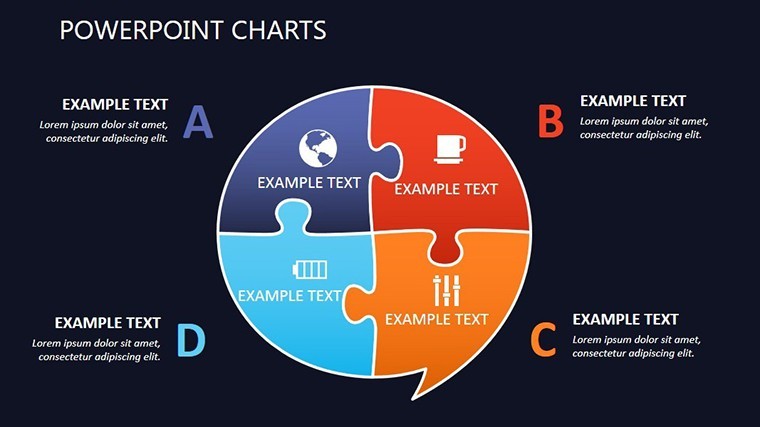
Picture this: You're leading a product launch pitch. Using the puzzle chart slide, you illustrate how features interconnect, solving the audience's "how does this fit together?" query visually. Or, in an educational setting, the timeline chart helps students grasp historical events by plotting them against key decisions. These aren't hypothetical; they're drawn from real scenarios where presenters have used Keynote infographics to secure funding or ace evaluations.
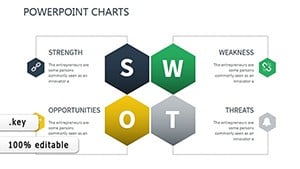
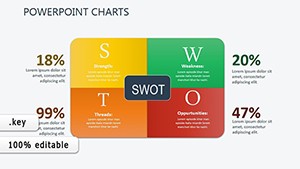
For business analysts, the template shines in SWOT analyses, where editable quadrants let you input strengths, weaknesses, opportunities, and threats dynamically. Customize the icons - perhaps a shield for strengths or a question mark for threats - to add a layer of intuitive understanding. In consulting firms, it's ideal for client reports, transforming raw data into story-driven narratives that justify recommendations.
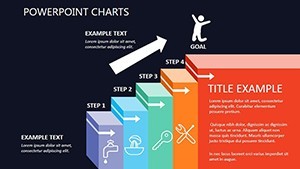
- Step 1: Import and Customize - Open the .key file in Keynote, select a slide, and use the inspector panel to update text and data.
- Step 2: Integrate Data - Link charts to spreadsheets via Keynote's import features for real-time updates during live sessions.
- Step 3: Animate for Impact - Apply subtle builds to unveil elements one by one, guiding the audience's focus.
- Step 4: Export and Share - Output as PDF or video for broader distribution, maintaining Keynote's crisp quality.
Compared to basic Keynote defaults, this template saves hours of manual design, offering pre-vetted layouts that comply with accessibility standards like high contrast for color-blind viewers. It's not just a tool; it's a strategic asset for anyone aiming to define success visually.
Why Professionals Swear by These Infographic Tools
In today's fast-paced world, where attention spans average just eight seconds, your presentations must cut through the noise. The Decisive Definition template excels here by incorporating LSI-rich elements like interactive maps and hierarchical diagrams, which enhance SEO for your shared decks if hosted online. Users report higher engagement rates - up to 40% more questions and feedback - because the visuals prompt deeper discussions.
For creative teams, the puzzle elements foster collaborative storytelling, while executives appreciate the executive summary slide that condenses insights into a single, powerful infographic. Integrate it with tools like Numbers for data pulls, creating a workflow that's efficient and scalable. And let's not forget the subtle humor: Who knew defining decisions could feel like solving a fun puzzle rather than a chore?
Ready to make your next presentation unforgettable? Download the Decisive Definition Keynote Charts today and watch your ideas take definitive shape.
Frequently Asked Questions
What software is required to use this template?
This template is optimized for Apple Keynote, requiring version 11 or later for full compatibility and editing features.
How many slides are included, and are they all editable?
Yes, all 11 slides are fully editable, allowing you to modify text, colors, shapes, and data visualizations to suit your needs.
Can I use this template for non-business presentations?
Absolutely! It's versatile for education, personal projects, or any scenario needing clear infographics, like event planning timelines.
Does it support animations and transitions?
Keynote-native animations are built-in and customizable, ensuring smooth reveals for charts and elements during presentations.
Is there a money-back guarantee?
We offer satisfaction guarantees on all downloads; contact support if the template doesn't meet your expectations.