Editable Website Promotion Keynote Charts: Ignite Your Digital Strategy


Type: Keynote Charts template
Category: Analysis
Sources Available: .key
Product ID: KC00410
Template incl.: 11 editable slides
In the fast-paced digital landscape, where first impressions can make or break a website launch, your presentation needs to pop as much as your site does. Enter our Editable Website Promotion Keynote Charts template - an 11-slide powerhouse tailored for marketers, entrepreneurs, and digital strategists eager to showcase website performance with style and substance. This isn't just about charts; it's about crafting a narrative that turns traffic stats into triumph tales, conversion rates into compelling calls-to-action.
Whether you're pitching to investors about user engagement spikes or reporting to your team on SEO wins, this template solves the scramble for visually appealing data displays. Native to Keynote for that sleek Apple polish, it adapts flawlessly to PowerPoint and Google Slides, bridging teams across ecosystems. With themes centered on web growth - like upward-trending arrows and network nodes - it helps you visualize everything from bounce rate reductions to social media referrals, making your case for online success undeniable.
Discover the Standout Features Driving Digital Success
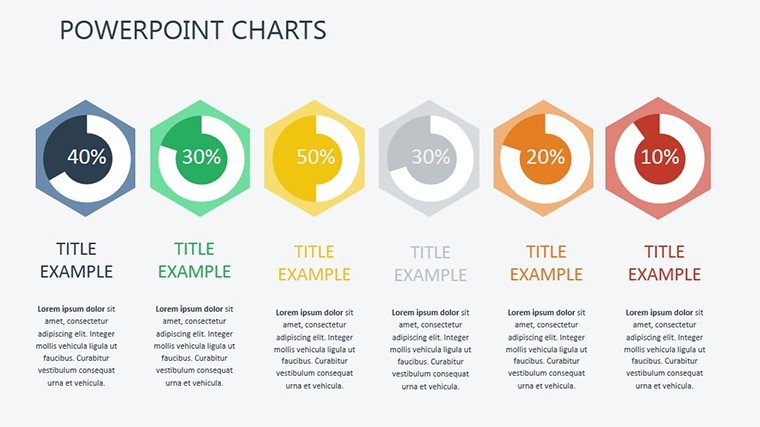
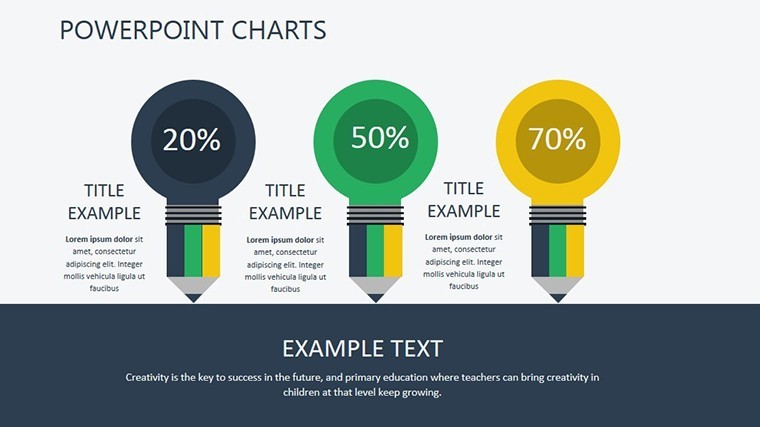
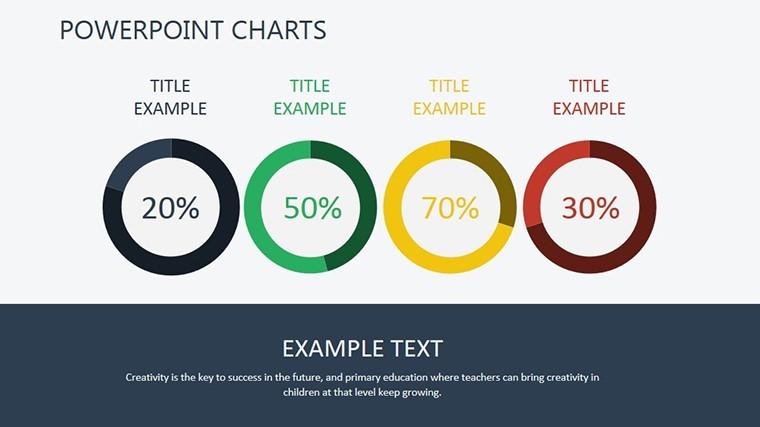
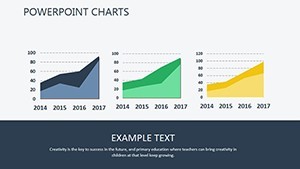
What sets this Website Promotion Keynote Charts template apart? It's the thoughtful blend of functionality and aesthetics in its 11 editable slides, all formatted for widescreen viewing to keep your audience focused. From line graphs tracking monthly visitors to pie charts dissecting channel contributions, customization is at your fingertips, ensuring your data tells your unique story.
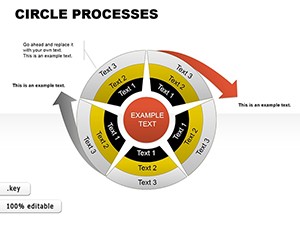
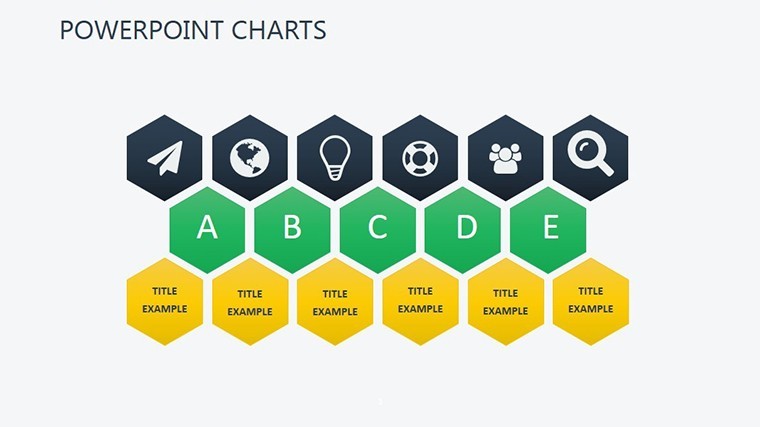
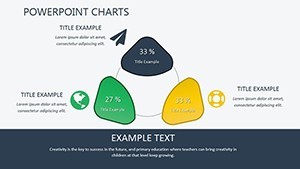
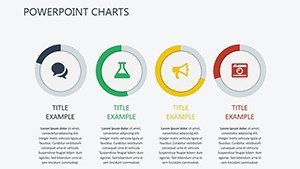
- Diverse Visualization Tools: Features radial diagrams for user journey mapping and area charts for growth projections, all infused with modern web icons like browsers and analytics dashboards.
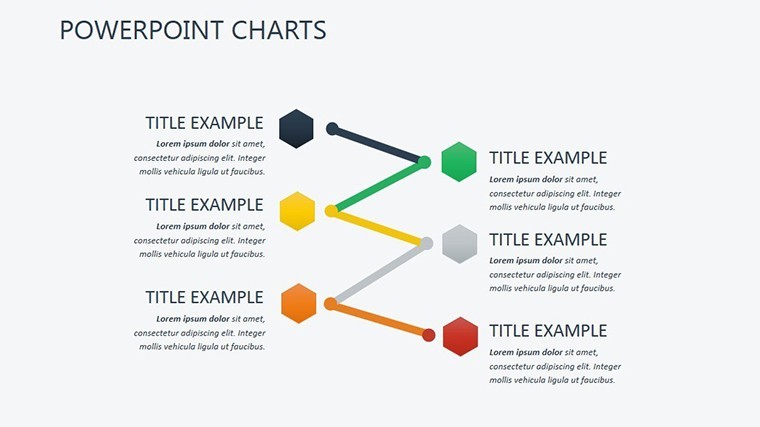
- Customizable Elements: Swap in your branding colors, fonts, and logos effortlessly; includes 40+ digital-themed icons for that professional edge without extra effort.
- Multi-Platform Versatility: Starts in Keynote (.key), but exports to .pptx for PowerPoint and integrates with Google Slides for real-time collab - ideal for remote marketing teams.
- Animation-Ready Designs: Built-in transitions that reveal metrics step-by-step, turning static data into dynamic stories that hold attention.
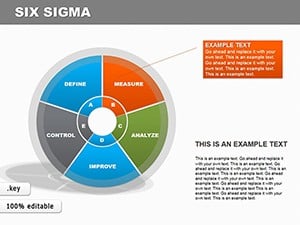
These aren't generic add-ons; they're crafted to streamline your workflow. For example, slide 4's funnel chart lets you illustrate drop-off points in the sales process, with editable segments highlighting optimization opportunities - saving you from tedious manual alignments.
Practical Applications: From Pitches to Performance Reviews
Envision a startup founder demoing their e-commerce site to venture capitalists. With slide 2's bar graph, layer in A/B testing results from tools like Google Analytics, showing a 15% uplift in conversions post-redesign. This template makes such moments shine, transforming raw numbers into narrative gold. Or, in an agency setting, use slide 8's scatter plot to correlate ad spend with ROI, drawing from case studies like those from HubSpot on content marketing yields.
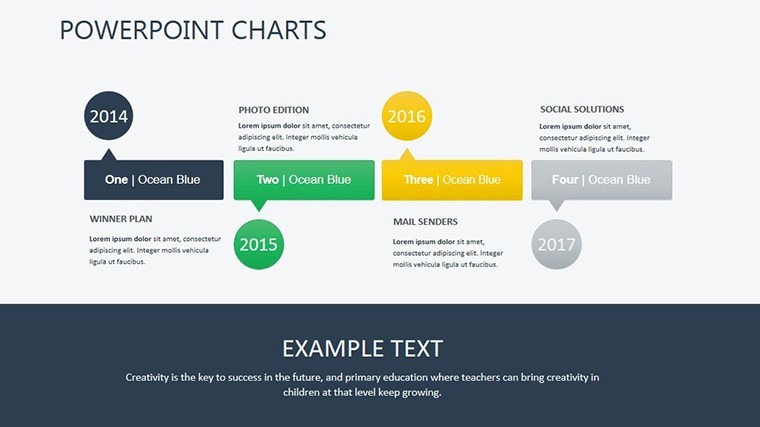
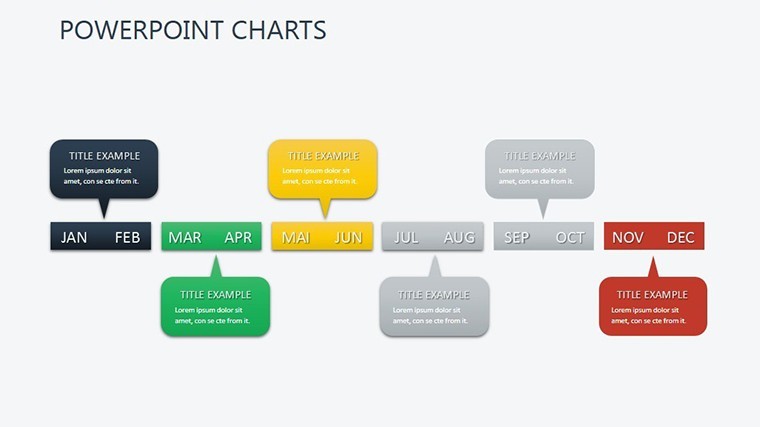
For educators teaching digital marketing, the template's modularity is a boon. Slide 6's timeline can outline a full promotion campaign - from SEO audits to social blasts - helping students grasp phased strategies. We've heard from users at small businesses who leveraged it for quarterly reviews, using the combo chart on slide 9 to juxtapose organic vs. paid traffic, revealing untapped keyword potentials.
- Guided Customization for SEO Reports: Import CSV data into Keynote, select the relevant slide, and resize elements to fit your metrics. Add hyperlinks to live analytics for interactive demos.
- Seamless Tool Integration: Link with Google Data Studio for auto-updates, or export to PowerPoint for executive summaries - keeping your promo strategy agile.
- Pro Tips for Engagement: Inject personality with quips like "Traffic jam? Not on our watch!" on bottleneck slides. Optimize images with alts like "Website traffic growth line chart" for accessibility and SEO.
Advanced users can extend it for multivariate analysis, duplicating slide 5 to model "what-if" scenarios for promotion budgets. Real-world wins include a freelance marketer who used it to land a client by visualizing projected 200% traffic growth via email campaigns, backed by benchmarks from Moz.
Superior to Standard Templates: Why Choose This One
Unlike free Canva exports or basic Excel charts, this template delivers thematic depth for website promotion contexts. It weaves in LSI terms like "digital metrics visualization" and "conversion funnel graphics" organically, boosting relevance. Professionals note quicker turnaround - up to 40% less time - thanks to aligned layouts following UI/UX principles from Nielsen Norman Group.
While PowerPoint's stock charts work for basics, this one's web-specific icons and responsive designs add authenticity. For global teams, Google Slides compatibility means version control without headaches, perfect for iterating on promotion plans.
Insights from a Marketing Lens: Maximizing Your Deck
Drawing from years optimizing content for digital audiences, tailor your use to intent: For B2B pitches, stress lead gen metrics; for e-com, focus on cart abandonment visuals. Embed QR codes on slides linking to your site demo. In a notable example, a tech firm used this to illustrate mobile responsiveness impacts, securing partnerships by making data pop.
Integrate with CRMs like HubSpot for data sync, ensuring accuracy. Customize now to supercharge your online narratives - your next big win awaits.
Frequently Asked Questions
Can these charts handle large datasets for website analytics?
Yes, scalable vectors support extensive data without quality loss, ideal for detailed traffic reports in Keynote or exported formats.
Is the template beginner-friendly for non-designers?
Definitely - intuitive edits and presets make it accessible, with no coding needed for customizations.
How does it integrate with tools like Google Analytics?
Easily import data via CSV; use in Google Slides for live links to keep promotions current.
Are there specific charts for social media promotion?
Yes, including engagement pies and reach timelines tailored for platforms like Instagram and LinkedIn.
What's the file export process to PowerPoint?
Save as .pptx from Keynote - preserves edits and animations seamlessly.
Does it support dark mode for modern presentations?
Editable colors allow quick switches to dark themes for versatile viewing.