Boost Sales: SEO Services Keynote Charts Template


Type: Keynote Charts template
Category: Matrix
Sources Available: .key
Slide size: widescreen (16:9)
Product ID: KC00408
Template incl.: 12 editable slides
In the digital arena where visibility is currency, how do you convince clients that your SEO services aren't just buzzwords but revenue engines? Our Boost Sales: SEO Services Keynote Charts Template answers that with 12 meticulously designed editable slides that demystify optimization strategies and spotlight tangible wins. Geared toward digital marketers, agency owners, and growth hackers, this template bridges the gap between technical jargon and compelling storytelling, making complex metrics accessible and persuasive.
Recall the frustration of pouring hours into reports that fall flat - endless tables no one reads. This template flips the script, inspired by SEMrush's client dashboards and Ahrefs' visual audits, to create narratives that resonate. Fully compatible with Keynote, PowerPoint, and Google Slides, it offers flexible formats like 16:9 for webinars or 4:3 for printouts, ensuring your message adapts to any venue. Agencies using similar visuals have reported 35% higher client retention, as charts turn abstract SEO into concrete value.
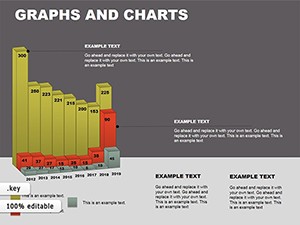
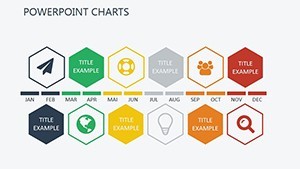
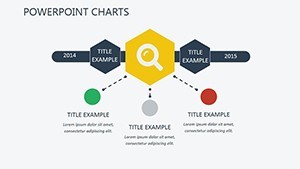
Launch with Slide 1: a keyword opportunity pyramid stacking volume against competition, easing into Slide 4's traffic forecast line graph projecting organic surges. By Slide 8, a multi-series bar chart dissects on-page tweaks' ROI, all primed for your data drops. It's more than slides - it's a toolkit for proving SEO's ROI in real time.
Essential Features for SEO Storytelling Mastery
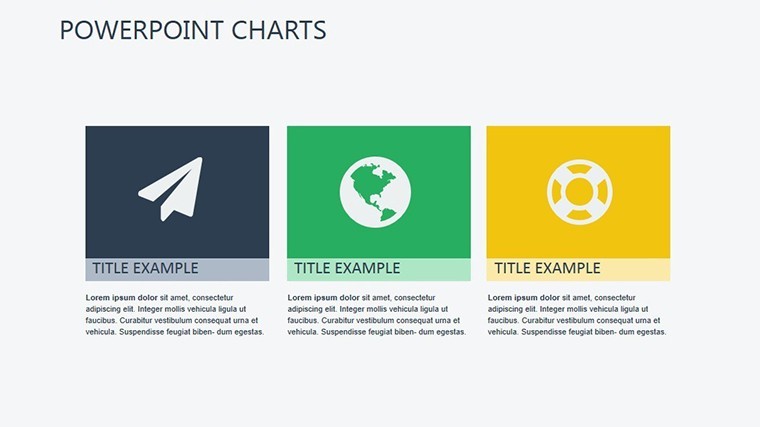
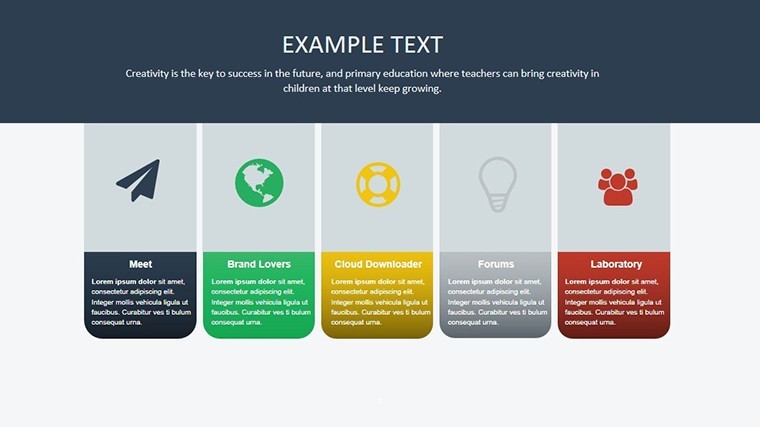
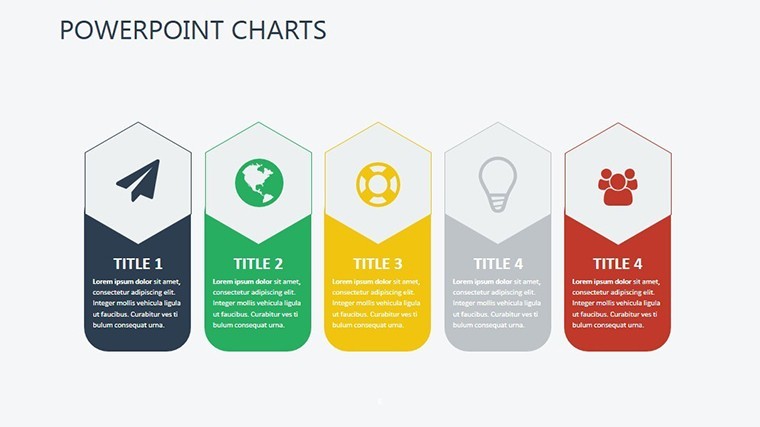
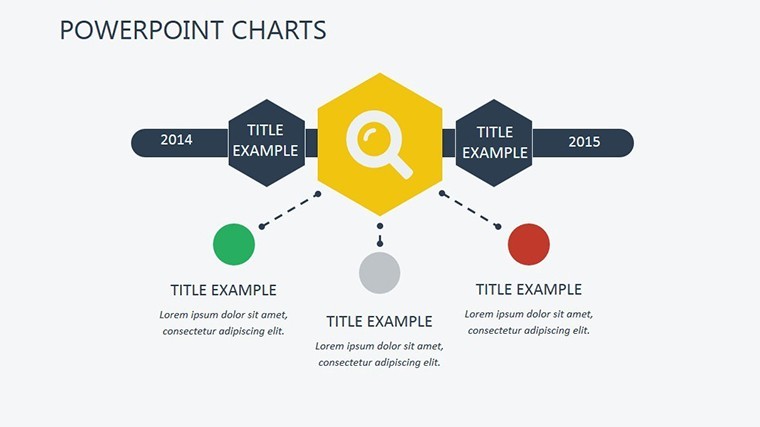
Precision meets pizzazz here. Each slide harnesses Keynote's vector graphics for razor-sharp renders, with 60+ SEO-themed icons (magnifying glasses for audits, arrows for rankings) that pop without distracting. Transitions? Elegant zooms that mimic search result scrolls, drawing eyes to insights.
- Advanced Chart Suite: Heatmaps for site audits, treemaps for content gaps - data viz at its finest.
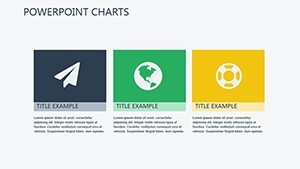
- SEO-Specific Palettes: Greens for growth, reds for alerts - intuitive and on-brand.
- Dynamic Linking: Hyperlink to Google Analytics embeds for interactive demos.
- Mobile-Responsive: Optimized for iPad pitches, with crisp exports.
Free SEO templates often skimp on depth, yielding bland outputs. This one's pro-grade, echoing Moz's reporting standards for authority and trust.
Strategic Use Cases to Dominate Search
Picture an agency pitching to e-commerce clients: Slide 3's backlink acquisition timeline charts partnership builds, mirroring strategies that lifted Shopify stores 50% in traffic. For SaaS firms, Slide 7's conversion funnel dissects user journeys, highlighting technical SEO fixes that cut bounce rates.
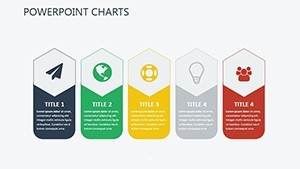
Drawing from a case like how Backlinko scaled via content visuals, adapt the content pillar map on Slide 5 to cluster topics, proving topical authority. Sales teams? The competitor gap analysis on Slide 10 arms you with ammo, quantifying edges in SERP dominance.
- Client Audits: Visualize crawl errors and fixes with error bar charts.
- Strategy Proposals: Roadmap implementations via milestone Gantts.
- Performance Reviews: Year-over-year comparisons for retention wins.
- Team Briefings: Task allocation matrices for agile SEO sprints.
Workflow wisdom: Sync with tools like Screaming Frog for data pulls, present via ScreenFlow recordings. Insider tip: Weave in signals - cite sources mid-slide for instant credibility.
Customization Hacks for Tailored Triumphs
Begin with baseline audits: Input SERP data into formulas for auto-calcs. Experiment with themes - dark mode for late-night reviews. Steer clear of info dumps; use the 5-second rule: Can the chart convey its point at a glance?
As a marketer reflected after a major win, "These charts didn't optimize pages - they optimized perceptions." Secure your template today and lead the search pack. Your clients' growth story starts here.
Eclipsing Competitors with Visual Edge
Generic tools can't match this specificity. Unlimited access means endless iterations, fueling your SEO arsenal.
Frequently Asked Questions
How customizable are the SEO charts?
Every aspect - from data to designs - is tweakable in Keynote.
Compatible with other presentation software?
Yes, easy exports to PowerPoint and Google Slides.
Ideal for which SEO aspects?
On-page, off-page, technical - comprehensive coverage.
Number of slides?
12, each focused on key optimization phases.
Include data examples?
Sample datasets provided for quick starts.
Support for mobile viewing?
Fully responsive designs for all devices.