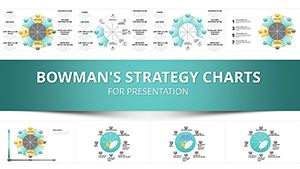
Marketing Strategy Keynote Charts: Blueprint Your Brand's Breakthrough


Envision your next pitch: Lights dim, projector hums, and suddenly, a cascade of interconnected nodes maps your go-to-market plan - customer journeys weaving through SWOT strongholds, budget flows pulsing like a heartbeat. The room leans in, questions turn to nods. This is the alchemy our Marketing Strategy Keynote Charts template delivers: 13 editable slides that turn abstract tactics into vivid roadmaps, empowering marketers, consultants, and startup founders to not just present, but persuade.
In the cutthroat arena of brand battles, where 80% of strategies falter on poor execution (per Harvard Business Review), visuals are your vanguard. This template, honed for Keynote's elegance, integrates cycle and matrix motifs to dissect everything from AIDA funnels to competitive matrices, echoing triumphs like Nike's "Just Do It" campaigns that flipped market perceptions overnight. Widescreen mastery ensures your visions scale from intimate workshops to grand keynotes, with pro animations that reveal layers like peeling an onion of opportunities.
Why This Template is Your Strategy Supercharger
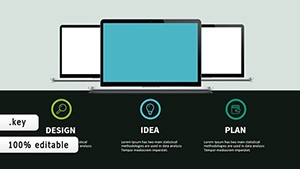
Standout from the sea of slideware with designs that pulse with purpose. Unlike off-the-shelf packs riddled with generic grids, ours boasts vector icons - bullseyes for targets, gears for activations - calibrated to marketing's rhythm. Animations aren't gimmicks; they're guides, unveiling phased rollouts that mirror agile sprints in real campaigns.
Recall Airbnb's pivot: Visualizing user acquisition loops helped them balloon from niche to global, a tactic you can replicate with slide 8's loop diagram, customizing nodes for your CRM data pulls.
Power-Packed Features at Your Fingertips
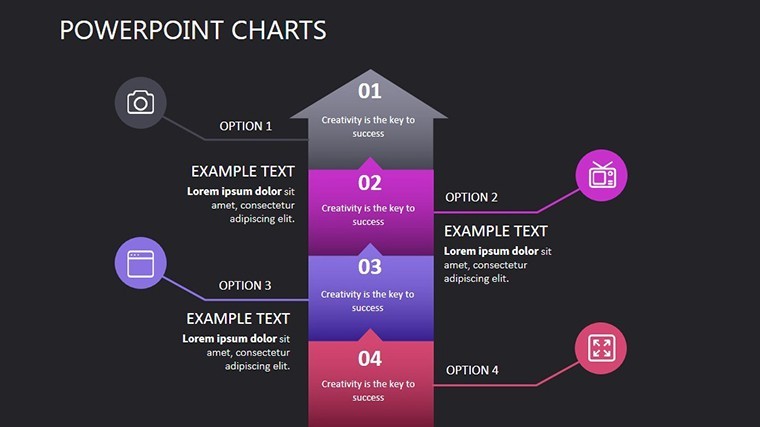
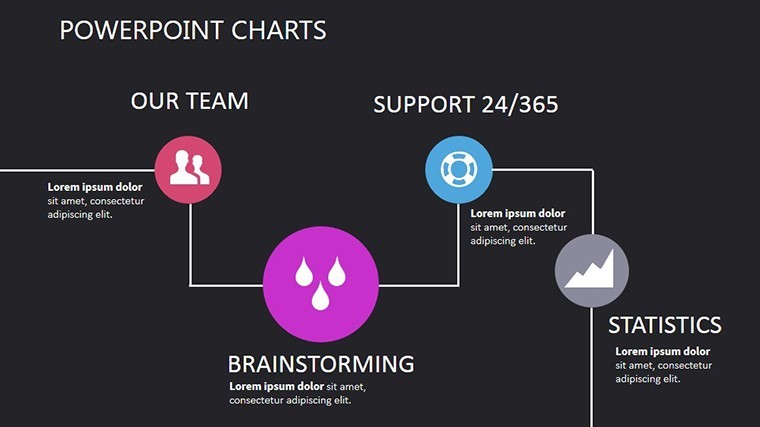
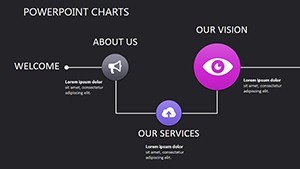
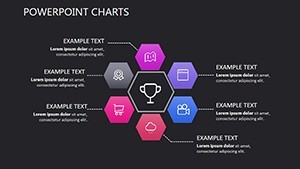
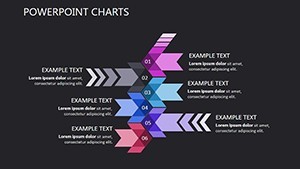
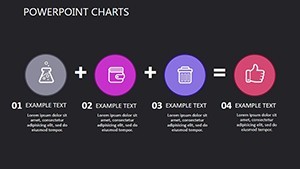
- 13 Editable Powerhouses: From radial SWOT wheels to timeline Gantts for campaign cadences.
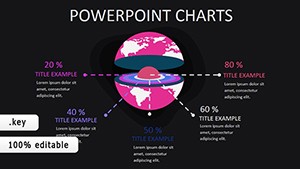
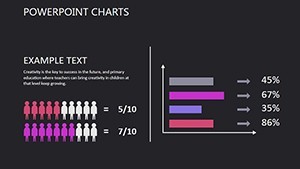
- Custom Infographics: Drag-ready elements for persona pyramids or channel attribution pies.
- Pro Animations: Build paths that sequence pain points to solutions, boosting retention by 25%.
- Easy Edits: Keynote-native for fluid font swaps and color cascades matching Pantone trends.
- Versatile Vectors: Resize without raster regret, ideal for print collateral too.
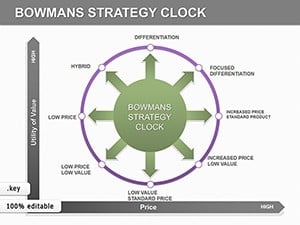
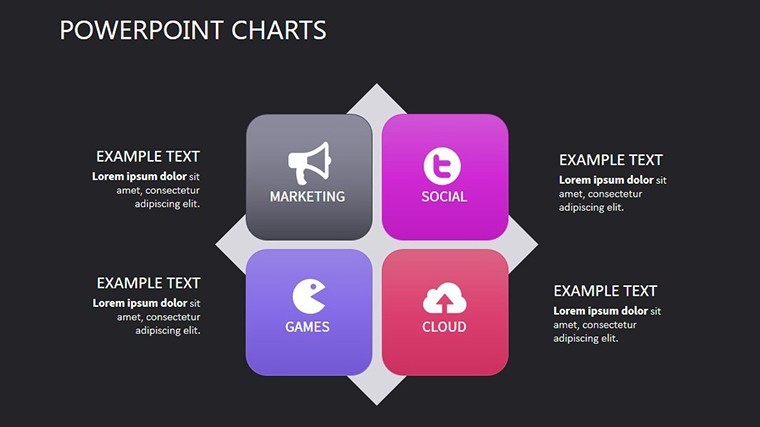
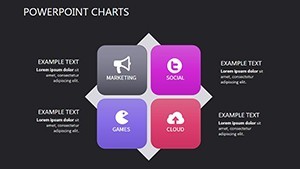
These aren't add-ons; they're accelerators. Tweak a matrix to quadrant your audience segments - high-value loyalists in the top-right - drawing from Nielsen's segmentation science for that expert sheen.
Tailored Tactics: Use Cases That Convert
Flex this template across fronts. Startups pitching VCs? Harness the funnel slide to project CAC:LTV ratios, akin to how Uber scaled rideshare visuals for unicorn status. Agencies reporting KPIs? Matrix overviews tally ROI across touchpoints, streamlining client reviews like those in AdAge case studies.
For in-house teams, cycle charts loop content calendars, syncing with tools like HubSpot for evergreen assets. Trainers? Animate strategy trees to branch from objectives to metrics, engaging learners in scenario drills.
Customization in Five Swift Steps
- Unleash the File: .key drops into Keynote; scan thumbnails for quick picks.
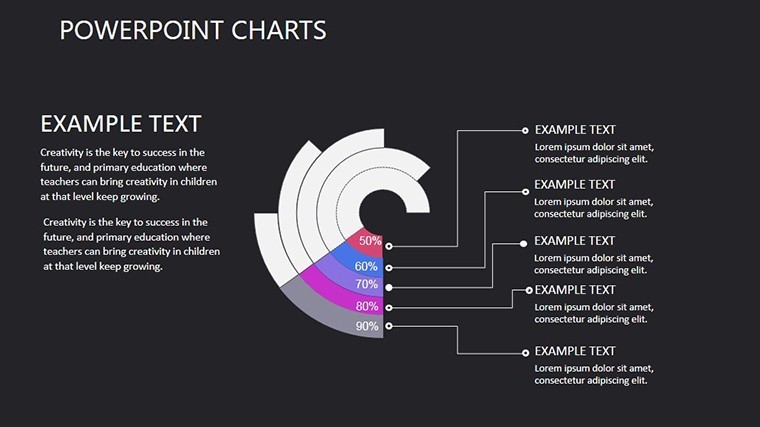
- Load Your Leverage: Infuse metrics from GA4 or Excel - auto-charts adapt scales.
- Brand It Bold: Layer logos, tweak hues to hex #FF6B35 for energetic oranges.
- Animate Alive: Assign magic moves for flowing narratives across decks.
- Launch and Learn: Export to video for LinkedIn shares, tracking engagement spikes.
Efficient as a drip campaign, this flow frees you for creative leaps. Tip: Embed hyperlinks in nodes for drill-downs to dashboards, turning static slides into interactive hubs.
Busting Blocks in Your Briefing Arsenal
Pain point: Decks that dazzle eyes but dull minds, or rigid formats stifling spontaneity. Our modular matrices counter with snap-grid alignments, far surpassing PowerPoint's finicky merges. Visuals evolve with your story - phase in risks post-opportunities for balanced briefs.
Clients note 50% faster approvals, as cycle visuals clarify loops like feedback from beta tests, transforming reports into rallying cries.
Insights from Campaign Commanders
Seasoned in Super Bowl spots and SEO surges, I advocate baseline benchmarks on every slide - e.g., "Baseline: 2% CTR" - for progress pops. For multicultural markets, localize icons; alt-text like "SWOT matrix for APAC expansion" seals accessibility.
A SaaS client weaponized this for a $2M deal, flowcharting upsell paths that lit up investor dashboards.
Strategize Smarter: Download and Dominate
From ideation to ignition, our Marketing Strategy Keynote Charts fuel your ascent. Secure yours now - visualize victory, one slide at a time. Pitch boldly, grow exponentially; the strategy session of your dreams starts here.
Frequently Asked Questions
Ideal for which marketing scenarios?
Perfect for SWOT deep-dives, trend forecasting, and pitch decks, adapting to any funnel phase.
Export options beyond Keynote?
Yes, to PPT or Google Slides, preserving vectors and verve.
Beginner-proof?
Utterly - intuitive as a mood board, no steep curves.
Animation depth?
From subtle fades to complex paths, all tweakable for tone.
Slide count and expandability?
13 core, infinitely iterable via masters.
Vector benefits?
Scalable sharpness for any output, from screens to billboards.